- Anoka Station, Anoka homes for sale
- Bass Creek, Minneapolis homes for sale
- Candlewood, Minneapolis homes for sale
- Coffee Cove, Spring Park homes for sale
- Downtown Champlin, Champlin homes for sale
- Downtown Maple Grove, Osseo homes for sale
- Harrison Bay, Mound homes for sale
- Jennings Bay, Mound homes for sale
- Kittredge Crossings, Albertville homes for sale
- Martin Farms, Otsego homes for sale
- North Arm, Long Lake homes for sale
- Northwoods, Minneapolis homes for sale
- Oak Grove, Minneapolis homes for sale
- Orchard Trail, Minneapolis homes for sale
- Rice Lake North, Osseo homes for sale
- River Park, Elk River homes for sale
- Tessman, Minneapolis homes for sale
- The Fields of Saint Michael, Saint Michael homes for sale
- Trout Brook Farm, Elk River homes for sale
- West Arm, Mound homes for sale
St Michael, MN - homes for sale
175 of 175 results displayed
- New
 $449,900Active4 beds 4 baths2,394 sq. ft.
3015 Jandura Avenue Ne, Saint Michael, MN 55376
MLS# 7067712Listed by: NEXTHOME WEST METRO - New
 $424,900Active3 beds 3 baths1,831 sq. ft.
3027 Jandura Avenue Ne, Saint Michael, MN 55376
MLS# 7067713Listed by: NEXTHOME WEST METRO - Coming SoonOpen Thu, 4:30 to 6pm
 $399,000Coming Soon3 beds 2 baths
414 Maple Knoll Way Nw, Saint Michael, MN 55376
MLS# 7067151Listed by: COLDWELL BANKER REALTY - New
 $524,900Active4 beds 2 baths2,034 sq. ft.
14588 54th Street Ne, Saint Michael, MN 55376
MLS# 7067233Listed by: EDINA REALTY, INC. - New
 $399,900Active4 beds 2 baths2,299 sq. ft.
600 3rd Street Sw, Saint Michael, MN 55376
MLS# 7064218Listed by: RE/MAX RESULTS  $405,747Pending3 beds 2 baths1,350 sq. ft.
3160 Jandura Avenue Ne, Saint Michael, MN 55376
MLS# 7066500Listed by: NEXTHOME WEST METRO- New
 $574,900Active5 beds 3 baths2,775 sq. ft.
937 Kepler Avenue Ne, Hanover, MN 55341
MLS# 7066283Listed by: JPW REALTY - New
 $809,900Active6 beds 5 baths4,410 sq. ft.
920 Kepler Avenue Ne, Hanover, MN 55341
MLS# 7066287Listed by: JPW REALTY - Open Wed, 1 to 4pmNew
 $624,900Active5 beds 4 baths3,088 sq. ft.
901 Kepler Avenue Ne, Hanover, MN 55341
MLS# 7066234Listed by: JPW REALTY - New
 $524,900Active6 beds 3 baths2,889 sq. ft.
9989 14th Circle Ne, Saint Michael, MN 55376
MLS# 7064773Listed by: KELLER WILLIAMS INTEGRITY REALTY - New
 $639,000Active5 beds 4 baths3,074 sq. ft.
5126 Nelmark Avenue Ne, Saint Michael, MN 55376
MLS# 7063657Listed by: RIVERSIDE REALTY, INC - New
 $545,000Active3 beds 3 baths2,756 sq. ft.
4566 Landmark Drive Ne, Saint Michael, MN 55376
MLS# 7064036Listed by: COLDWELL BANKER REALTY - New
 $450,000Active5 beds 3 baths2,841 sq. ft.
9195 25th Street Ne, Saint Michael, MN 55376
MLS# 7064170Listed by: REAL BROKER, LLC - New
 $425,000Active3 beds 2 baths1,915 sq. ft.
3547 Kadler Avenue Ne, Saint Michael, MN 55376
MLS# 7064619Listed by: KELLER WILLIAMS CLASSIC RLTY NW - New
 $1,190,000Active4 beds 4 baths4,776 sq. ft.
10560 31st Place Ne, Saint Michael, MN 55376
MLS# 7065407Listed by: RIVERSIDE REALTY, INC - New
 $707,000Active6 beds 6 baths5,449 sq. ft.
2505 Jaber Avenue Ne, Saint Michael, MN 55376
MLS# 7064800Listed by: EMPIRE REALTY LLC - Open Wed, 12 to 5pmNew
 $479,990Active4 beds 3 baths3,026 sq. ft.
11606 16th Circle Ne, Saint Michael, MN 55376
MLS# 7064863Listed by: M/I HOMES - Open Wed, 12 to 5pmNew
 $474,990Active4 beds 3 baths3,023 sq. ft.
1687 Langston Avenue Ne, Saint Michael, MN 55376
MLS# 7064757Listed by: M/I HOMES - Open Wed, 12 to 5pmNew
 $499,990Active4 beds 3 baths3,268 sq. ft.
11610 16th Circle Ne, Saint Michael, MN 55376
MLS# 7064759Listed by: M/I HOMES - New
 $489,000Active4 beds 4 baths3,140 sq. ft.
11063 20th Street Ne, Saint Michael, MN 55376
MLS# 7020946Listed by: COLDWELL BANKER REALTY - SOUTHWEST REGIONAL  $414,900Pending5 beds 3 baths2,444 sq. ft.
208 Cherrywood Avenue Nw, Saint Michael, MN 55376
MLS# 7058216Listed by: FAZENDIN REALTORS- New
 $515,000Active4 beds 4 baths3,492 sq. ft.
11229 22nd Street Ne, Saint Michael, MN 55376
MLS# 7055225Listed by: RE/MAX RESULTS - Coming Soon
 $340,000Coming Soon3 beds 2 baths
401 Main Street N, Saint Michael, MN 55376
MLS# 7064333Listed by: EXP REALTY - New
 $725,000Active5 beds 4 baths3,654 sq. ft.
10785 23rd Street Ne, Saint Michael, MN 55376
MLS# 7058989Listed by: KELLER WILLIAMS CLASSIC RLTY NW - New
 $400,000Active4 beds 2 baths2,158 sq. ft.
1401 Janett Avenue Ne, Saint Michael, MN 55376
MLS# 7060349Listed by: KELLER WILLIAMS CLASSIC RLTY NW - New
 $523,795Active4 beds 3 baths2,185 sq. ft.
9876 49th Place Ne, Saint Michael, MN 55376
MLS# 7063433Listed by: LENNAR SALES CORP - Open Wed, 12 to 5pmNew
 $479,990Active4 beds 3 baths2,682 sq. ft.
1692 Langston Avenue Ne, Saint Michael, MN 55376
MLS# 7063470Listed by: M/I HOMES - New
 $675,000Active5 beds 5 baths3,950 sq. ft.
9985 14th Circle Ne, Saint Michael, MN 55376
MLS# 7063483Listed by: KELLER WILLIAMS CLASSIC REALTY - New
 $375,000Active3 beds 2 baths2,023 sq. ft.
2397 Lachman Avenue Ne, Saint Michael, MN 55376
MLS# 7063181Listed by: BRIX REAL ESTATE - Coming SoonOpen Fri, 1 to 3pm
 $625,000Coming Soon5 beds 4 baths
2302 Kester Avenue Ne, Saint Michael, MN 55376
MLS# 7062309Listed by: EXP REALTY - New
 $485,000Active3 beds 2 baths1,485 sq. ft.
9776 47th Bay Ne, Saint Michael, MN 55376
MLS# 7062726Listed by: D.R. HORTON, INC. - New
 $639,000Active5 beds 4 baths3,299 sq. ft.
10752 23rd Street Ne, Saint Michael, MN 55376
MLS# 7059714Listed by: COLDWELL BANKER REALTY  $464,900Active5 beds 3 baths2,579 sq. ft.
2741 Ivy Avenue Ne, Saint Michael, MN 55376
MLS# 7061752Listed by: CAPSTONE REALTY, LLC $350,000Active4 beds 2 baths1,824 sq. ft.
319 Walnut Avenue Sw, Saint Michael, MN 55376
MLS# 7036074Listed by: KRIS LINDAHL REAL ESTATE $685,000Pending4 beds 3 baths3,145 sq. ft.
300 Ivory Avenue Ne, Saint Michael, MN 55376
MLS# 7053383Listed by: KELLER WILLIAMS INTEGRITY NW $519,900Active4 beds 3 baths2,596 sq. ft.
9686 32nd Street Ne, Saint Michael, MN 55376
MLS# 7060553Listed by: NEXTHOME WEST METRO $479,900Active4 beds 3 baths2,209 sq. ft.
3171 Jandura Avenue Ne, Saint Michael, MN 55376
MLS# 7060562Listed by: NEXTHOME WEST METRO $899,900Active6 beds 5 baths5,037 sq. ft.
4925 Otter Trail Ne, Saint Michael, MN 55376
MLS# 7054901Listed by: KELLER WILLIAMS CLASSIC RLTY NW $558,000Active4 beds 3 baths2,604 sq. ft.
4614 Landmark Drive Ne, Saint Michael, MN 55376
MLS# 7059236Listed by: RE/MAX RESULTS $389,900Pending4 beds 2 baths2,336 sq. ft.
4560 Mason Avenue Ne, Saint Michael, MN 55376
MLS# 7060114Listed by: COUNSELOR REALTY, INC. $525,000Pending3 beds 4 baths1,628 sq. ft.
9145 13th Street Ne, Saint Michael, MN 55376
MLS# 7060301Listed by: COLDWELL BANKER REALTY $299,000Pending3 beds 2 baths1,908 sq. ft.
513 4th Street Sw, Saint Michael, MN 55376
MLS# 6821821Listed by: COLDWELL BANKER REALTY - SOUTHWEST REGIONAL $439,900Pending5 beds 4 baths2,898 sq. ft.
10475 34th Street Ne, Saint Michael, MN 55376
MLS# 7059148Listed by: EXP REALTY $365,900Active3 beds 2 baths1,600 sq. ft.
501 Underwood Lane Nw, Saint Michael, MN 55376
MLS# 7059183Listed by: COUNSELOR REALTY, INC $550,000Pending4 beds 4 baths3,216 sq. ft.
4578 Lannon Avenue, Saint Michael, MN 55376
MLS# 6778726Listed by: KELLER WILLIAMS CLASSIC RLTY NW $699,999Active6 beds 5 baths5,147 sq. ft.
2563 Jaber Avenue Ne, Saint Michael, MN 55376
MLS# 7058058Listed by: KELLER WILLIAMS INTEGRITY NW $425,000Pending4 beds 2 baths2,245 sq. ft.
10145 46th Street Ne, Saint Michael, MN 55376
MLS# 7056006Listed by: RE/MAX RESULTS $609,000Active3 beds 2 baths1,878 sq. ft.
309 2nd Street Se, Saint Michael, MN 55376
MLS# 7055758Listed by: COLDWELL BANKER REALTY $700,000Active5 beds 4 baths3,804 sq. ft.
9984 14th Circle Ne, Saint Michael, MN 55376
MLS# 7055211Listed by: KELLER WILLIAMS CLASSIC REALTY $482,000Pending5 beds 3 baths2,870 sq. ft.
4588 Lasalle Avenue Ne, Saint Michael, MN 55376
MLS# 7041550Listed by: EDINA REALTY, INC. $391,000Pending3 beds 3 baths1,831 sq. ft.
3070 Jandura Avenue Ne, Saint Michael, MN 55376
MLS# 7054716Listed by: NEXTHOME WEST METRO $846,355Pending3 beds 3 baths3,257 sq. ft.
3742 Lucy Court Ne, Saint Michael, MN 55376
MLS# 7053743Listed by: COLDWELL BANKER REALTY- Open Sat, 12 to 2pm
 $600,000Active5 beds 4 baths3,600 sq. ft.
421 Butternut Lane Se, Saint Michael, MN 55376
MLS# 7047953Listed by: COLDWELL BANKER REALTY  $522,900Active4 beds 3 baths2,596 sq. ft.
9674 32nd Street Ne, Saint Michael, MN 55376
MLS# 7051507Listed by: NEXTHOME WEST METRO $398,900Pending3 beds 2 baths1,350 sq. ft.
3144 Jandura Avenue Ne, Saint Michael, MN 55376
MLS# 7053680Listed by: NEXTHOME WEST METRO $482,900Active4 beds 3 baths2,209 sq. ft.
3153 Jandura Avenue Ne, Saint Michael, MN 55376
MLS# 7051489Listed by: NEXTHOME WEST METRO $553,990Active2 beds 2 baths1,773 sq. ft.
11626 19th Street Ne, Saint Michael, MN 55376
MLS# 7053586Listed by: M/I HOMES $375,000Active3 beds 2 baths1,708 sq. ft.
313 Heights Road Nw, Saint Michael, MN 55376
MLS# 7017004Listed by: KELLER WILLIAMS PREMIER REALTY LAKE MINNETONKA $567,990Active4 beds 3 baths2,464 sq. ft.
11590 19th Street Ne, Saint Michael, MN 55376
MLS# 7053585Listed by: M/I HOMES $672,990Active4 beds 3 baths3,003 sq. ft.
11559 19th Street Ne, Saint Michael, MN 55376
MLS# 7053587Listed by: M/I HOMES $624,901Pending3 beds 2 baths1,954 sq. ft.
11998 38th Place Ne, Saint Michael, MN 55376
MLS# 7053556Listed by: COLDWELL BANKER REALTY $469,900Active5 beds 2 baths1,206 sq. ft.
10506 Kahlen Drive Ne, Hanover, MN 55341
MLS# 7050360Listed by: RE/MAX ADVANTAGE PLUS $732,758Pending4 beds 4 baths3,436 sq. ft.
2726 Kensington Avenue Ne, Saint Michael, MN 55376
MLS# 7052651Listed by: HANSON BUILDERS INC $715,000Active5 beds 5 baths4,675 sq. ft.
13841 48th Lane Ne, Saint Michael, MN 55376
MLS# 7052048Listed by: RE/MAX RESULTS- Open Wed, 12 to 5pm
 $649,990Active5 beds 4 baths3,917 sq. ft.
11528 19th Street Ne, Saint Michael, MN 55376
MLS# 7051448Listed by: M/I HOMES  $575,000Pending4 beds 4 baths3,294 sq. ft.
12826 46th Circle Ne, Saint Michael, MN 55376
MLS# 7041719Listed by: EDINA REALTY, INC. $494,895Active3 beds 2 baths1,783 sq. ft.
4907 Jandura Bay Ne, Saint Michael, MN 55376
MLS# 7050752Listed by: LENNAR SALES CORP $369,900Pending3 beds 2 baths1,856 sq. ft.
300 Edgewood Drive Se, Saint Michael, MN 55376
MLS# 7050299Listed by: COLDWELL BANKER REALTY $659,900Active2 beds 2 baths2,317 sq. ft.
220 2nd Street Se, Saint Michael, MN 55376
MLS# 7047501Listed by: COLDWELL BANKER REALTY $739,900Active4 beds 3 baths3,419 sq. ft.
916 Kepler Avenue Ne, Hanover, MN 55341
MLS# 7049956Listed by: JPW REALTY $850,000Active5 beds 4 baths3,170 sq. ft.
1294 Jamison Avenue Ne, Saint Michael, MN 55376
MLS# 7030216Listed by: KELLER WILLIAMS CLASSIC RLTY NW $1,200,000Pending5 beds 5 baths5,364 sq. ft.
2269 Lakeshore Point Drive Ne, Saint Michael, MN 55376
MLS# 7042295Listed by: KELLER WILLIAMS CLASSIC RLTY NW $389,900Pending4 beds 2 baths2,002 sq. ft.
4569 Kady Avenue Ne, Saint Michael, MN 55376
MLS# 7048831Listed by: BRIDGE REALTY, LLC- Open Sat, 12 to 2pm
 $649,500Active5 beds 5 baths4,002 sq. ft.
10958 23rd Street Ne, Saint Michael, MN 55376
MLS# 7049178Listed by: EDINA REALTY, INC.  $375,000Pending3 beds 2 baths1,910 sq. ft.
3663 Kahler Drive Ne, Saint Michael, MN 55376
MLS# 7030805Listed by: KELLER WILLIAMS CLASSIC RLTY NW $550,000Active4 beds 3 baths2,776 sq. ft.
9784 47th Bay Ne, Saint Michael, MN 55376
MLS# 7048834Listed by: D.R. HORTON, INC. $474,900Pending5 beds 4 baths3,461 sq. ft.
4562 Mcallister Avenue Ne, Saint Michael, MN 55376
MLS# 7026241Listed by: RE/MAX RESULTS $650,000Pending4 beds 3 baths3,546 sq. ft.
10712 28th Court Ne, Saint Michael, MN 55376
MLS# 7033841Listed by: EXP REALTY $665,000Pending2 beds 2 baths1,810 sq. ft.
1569 Hansack Ave Ne, Saint Michael, MN 55376
MLS# 7047432Listed by: RE/MAX RESULTS $464,900Pending5 beds 3 baths2,579 sq. ft.
2735 Ivy Avenue Ne, Saint Michael, MN 55376
MLS# 7047470Listed by: CAPSTONE REALTY, LLC $574,900Pending4 beds 3 baths3,056 sq. ft.
4881 Mcallister Avenue Ne, Saint Michael, MN 55376
MLS# 7042043Listed by: JPW REALTY- Open Wed, 12 to 5pm
 $487,990Active4 beds 3 baths3,282 sq. ft.
11614 16th Circle Ne, Saint Michael, MN 55376
MLS# 7045095Listed by: M/I HOMES - Open Wed, 12 to 5pm
 $535,000Active5 beds 3 baths3,232 sq. ft.
11618 16th Circle Ne, Saint Michael, MN 55376
MLS# 7045096Listed by: M/I HOMES  $469,135Active4 beds 3 baths2,505 sq. ft.
2527 Jandell Avenue Ne, Saint Michael, MN 55376
MLS# 7045540Listed by: LENNAR SALES CORP $619,085Active5 beds 3 baths3,078 sq. ft.
9827 49th Place Ne, Saint Michael, MN 55376
MLS# 7045502Listed by: LENNAR SALES CORP $664,975Pending4 beds 3 baths2,624 sq. ft.
11578 19th Street Ne, Saint Michael, MN 55376
MLS# 7045040Listed by: M/I HOMES $599,999Active4 beds 3 baths2,682 sq. ft.
9934 14th Circle Ne, Saint Michael, MN 55376
MLS# 7044190Listed by: BRIDGE REALTY, LLC $437,525Active4 beds 3 baths2,344 sq. ft.
2539 Jandell Avenue Ne, Saint Michael, MN 55376
MLS# 7044261Listed by: LENNAR SALES CORP $449,290Active5 beds 3 baths2,488 sq. ft.
2413 Jandell Avenue Ne, Saint Michael, MN 55341
MLS# 7044122Listed by: LENNAR SALES CORP $474,920Active4 beds 3 baths2,328 sq. ft.
2407 Jandell Avenue Ne, Saint Michael, MN 55376
MLS# 7044110Listed by: LENNAR SALES CORP $449,290Active5 beds 3 baths2,199 sq. ft.
2413 Jandell Avenue Ne, Saint Michael, MN 55341
MLS# 7044122Listed by: LENNAR SALES CORP $425,000Pending4 beds 3 baths2,429 sq. ft.
4405 Mazula Court Ne, Saint Michael, MN 55376
MLS# 7040602Listed by: ENGEL & VOLKERS LAKE MINNETONKA $686,945Active4 beds 3 baths3,010 sq. ft.
4637 Jamocha Avenue Ne, Saint Michael, MN 55376
MLS# 7040633Listed by: ROBERT THOMAS HOMES, INC. $589,990Pending5 beds 4 baths3,003 sq. ft.
9515 49th Place Ne, Saint Michael, MN 55376
MLS# 7040641Listed by: D.R. HORTON, INC.- Open Thu, 12 to 4:30pm
 $831,480Active5 beds 4 baths3,822 sq. ft.
4666 Jamocha Bay Ne, Saint Michael, MN 55376
MLS# 7040693Listed by: ROBERT THOMAS HOMES, INC.  $698,000Active4 beds 4 baths3,710 sq. ft.
5429 Nelmark Avenue Ne, Saint Michael, MN 55376
MLS# 7041384Listed by: RE/MAX ADVANTAGE PLUS $599,990Active5 beds 4 baths3,156 sq. ft.
9533 49th Place Ne, Saint Michael, MN 55376
MLS# 7042012Listed by: D.R. HORTON, INC.- Open Wed, 12 to 4pm
 $424,640Active4 beds 3 baths2,049 sq. ft.
2504 Jandell Avenue Ne, Saint Michael, MN 55376
MLS# 7042159Listed by: LENNAR SALES CORP  $539,900Active5 beds 4 baths2,821 sq. ft.
9972 14th Circle Ne, Saint Michael, MN 55376
MLS# 7042490Listed by: COUNSELOR REALTY, INC $377,900Pending3 beds 3 baths1,809 sq. ft.
9709 31st Street Ne, Saint Michael, MN 55376
MLS# 7042775Listed by: NEXTHOME WEST METRO $320,000Active3 beds 2 baths1,708 sq. ft.
416 Cottonwood Avenue Ne, Saint Michael, MN 55376
MLS# 7043208Listed by: PREMIER REAL ESTATE SERVICES $485,900Pending4 beds 3 baths2,209 sq. ft.
3199 Jandura Avenue Ne, Saint Michael, MN 55376
MLS# 7043320Listed by: NEXTHOME WEST METRO $524,135Active5 beds 3 baths2,692 sq. ft.
Address Withheld By Seller, Saint Michael, MN 55376
MLS# 7043464Listed by: LENNAR SALES CORP $459,420Active2 beds 2 baths1,725 sq. ft.
4928 Jandura Bay Ne, Saint Michael, MN 55376
MLS# 7043499Listed by: LENNAR SALES CORP $464,900Pending5 beds 3 baths2,841 sq. ft.
2723 Ivy Avenue Ne, Saint Michael, MN 55376
MLS# 7043808Listed by: CAPSTONE REALTY, LLC $434,770Active3 beds 2 baths1,582 sq. ft.
2410 Jandell Avenue Ne, Saint Michael, MN 55376
MLS# 7043815Listed by: LENNAR SALES CORP $469,900Pending5 beds 3 baths2,714 sq. ft.
2739 Ivy Avenue Ne, Saint Michael, MN 55376
MLS# 7043953Listed by: CAPSTONE REALTY, LLC $499,900Pending4 beds 4 baths2,910 sq. ft.
11911 48th Street Ne, Saint Michael, MN 55376
MLS# 7038687Listed by: RE/MAX RESULTS $1,200,000Active6 beds 5 baths5,533 sq. ft.
2210 Lancaster Avenue Ne, Saint Michael, MN 55376
MLS# 7036089Listed by: COLDWELL BANKER REALTY $925,000Active5 beds 5 baths5,407 sq. ft.
14899 50th Street Ne, Saint Michael, MN 55376
MLS# 7036904Listed by: SODL $469,900Pending5 beds 3 baths2,654 sq. ft.
2749 Ivy Avenue Ne, Saint Michael, MN 55376
MLS# 7036757Listed by: CAPSTONE REALTY, LLC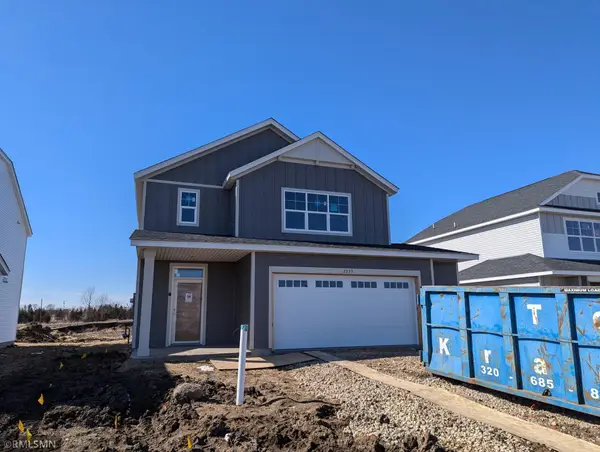 $389,900Active3 beds 3 baths2,087 sq. ft.
2735 Ivan Avenue Ne, Saint Michael, MN 55376
MLS# 7036719Listed by: CAPSTONE REALTY, LLC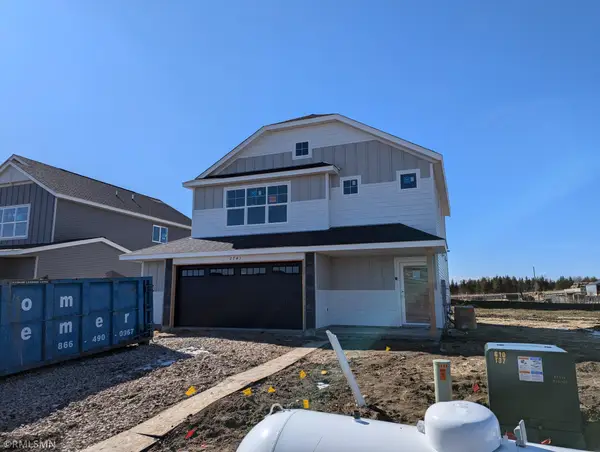 $374,900Pending3 beds 3 baths1,719 sq. ft.
2743 Ivan Avenue Ne, Saint Michael, MN 55376
MLS# 7036578Listed by: CAPSTONE REALTY, LLC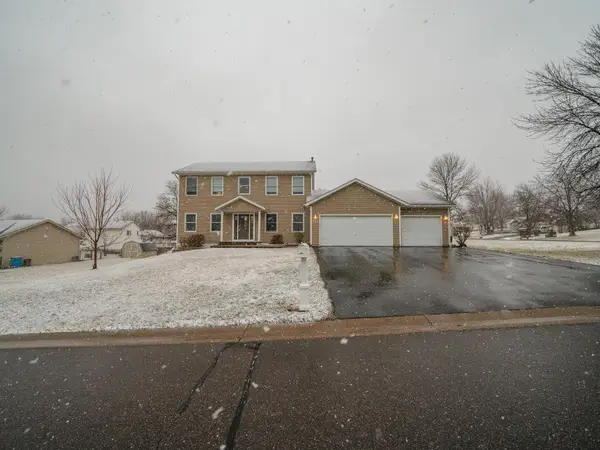 $449,900Active4 beds 4 baths2,848 sq. ft.
512 Dogwood Avenue Nw, Saint Michael, MN 55376
MLS# 7036453Listed by: ELEVATE REALTY LLC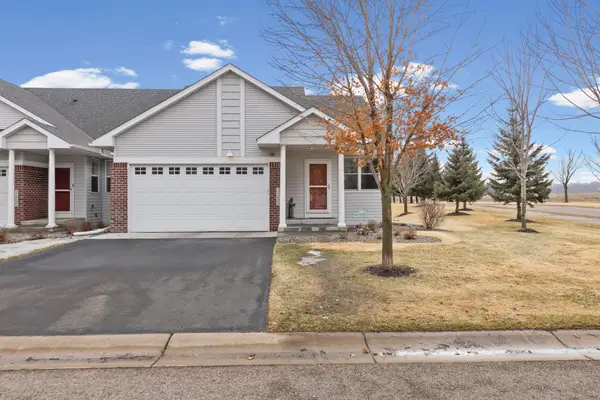 $357,000Active4 beds 3 baths2,537 sq. ft.
11038 16th Street Ne, Saint Michael, MN 55376
MLS# 7026647Listed by: PEMBERTON RE $574,900Pending4 beds 3 baths3,396 sq. ft.
10667 38th Circle Ne, Saint Michael, MN 55376
MLS# 7034811Listed by: RE/MAX RESULTS $625,000Pending5 beds 4 baths3,637 sq. ft.
2409 Jaber Avenue Ne, Saint Michael, MN 55376
MLS# 7033406Listed by: EDINA REALTY, INC. $519,900Active5 beds 3 baths2,421 sq. ft.
3345 Lachman Court Ne, Saint Michael, MN 55376
MLS# 7033891Listed by: FIRST IMPRESSIONS HOME GROUP $525,000Pending3 beds 4 baths3,113 sq. ft.
13690 43rd Street Ne, Saint Michael, MN 55376
MLS# 7023641Listed by: RE/MAX RESULTS $519,900Pending5 beds 4 baths3,678 sq. ft.
2274 Langston Court Ne, Saint Michael, MN 55376
MLS# 7025946Listed by: KELLER WILLIAMS INTEGRITY NW $925,000Active5 beds 5 baths4,480 sq. ft.
2275 Lakeshore Point Drive Ne, Saint Michael, MN 55376
MLS# 7030822Listed by: EDINA REALTY, INC. $665,000Pending4 beds 3 baths2,816 sq. ft.
9969 14th Circle Ne, Saint Michael, MN 55376
MLS# 7026920Listed by: KELLER WILLIAMS CLASSIC REALTY $990,000Active6 beds 5 baths4,397 sq. ft.
15070 50th Street Ne, Saint Michael, MN 55376
MLS# 7029449Listed by: EDINA REALTY, INC. $465,000Pending4 beds 3 baths2,262 sq. ft.
3262 Kahlen Avenue Ne, Saint Michael, MN 55376
MLS# 7016742Listed by: KELLER WILLIAMS CLASSIC RLTY NW $369,900Active3 beds 3 baths2,335 sq. ft.
3223 Kady Avenue Ne, Saint Michael, MN 55376
MLS# 7020678Listed by: COUNSELOR REALTY- Open Thu, 12:30 to 4pm
 $679,950Active5 beds 4 baths3,232 sq. ft.
4601 Jamocha Avenue Ne, Saint Michael, MN 55376
MLS# 7028350Listed by: ROBERT THOMAS HOMES, INC.  $399,000Active4 beds 3 baths2,510 sq. ft.
11419 17th Street Ne, Saint Michael, MN 55376
MLS# 7017831Listed by: KELLER WILLIAMS INTEGRITY NW $375,000Pending4 beds 2 baths1,776 sq. ft.
409 Heights Road Nw, Saint Michael, MN 55376
MLS# 7025872Listed by: EXP REALTY $379,900Pending3 beds 3 baths1,809 sq. ft.
9737 31st Street Ne, Saint Michael, MN 55376
MLS# 7034237Listed by: NEXTHOME WEST METRO $659,675Pending4 beds 3 baths2,633 sq. ft.
4658 Jamocha Bay Ne, Saint Michael, MN 55376
MLS# 7024789Listed by: ROBERT THOMAS HOMES, INC. $379,900Pending3 beds 3 baths1,809 sq. ft.
9723 31st Street Ne, Saint Michael, MN 55376
MLS# 7023697Listed by: NEXTHOME WEST METRO- Open Wed, 12 to 5pm
 $550,000Active4 beds 3 baths2,776 sq. ft.
9798 47th Bay Ne, Saint Michael, MN 55376
MLS# 7021576Listed by: D.R. HORTON, INC.  $685,000Pending6 beds 5 baths5,067 sq. ft.
2600 Ivy Avenue Ne, Saint Michael, MN 55376
MLS# 7006857Listed by: KELLER WILLIAMS CLASSIC RLTY NW $599,900Active4 beds 3 baths2,405 sq. ft.
9933 14th Circle Ne, Saint Michael, MN 55376
MLS# 7018899Listed by: KELLER WILLIAMS CLASSIC REALTY $475,000Active3 beds 2 baths1,485 sq. ft.
4964 Jamocha Avenue Ne, Saint Michael, MN 55376
MLS# 7018688Listed by: D.R. HORTON, INC. $883,825Pending4 beds 4 baths4,071 sq. ft.
1798 Laquey Avenue Ne, Saint Michael, MN 55376
MLS# 7017490Listed by: HANSON BUILDERS INC $449,900Pending5 beds 3 baths2,579 sq. ft.
2621 Ivy Avenue Ne, Saint Michael, MN 55376
MLS# 7014166Listed by: CAPSTONE REALTY, LLC $352,000Pending3 beds 3 baths2,786 sq. ft.
11052 16th Street Ne, Saint Michael, MN 55376
MLS# 7014057Listed by: RE/MAX RESULTS $639,990Active5 beds 4 baths3,448 sq. ft.
9555 49th Place Ne, Saint Michael, MN 55349
MLS# 7012567Listed by: D.R. HORTON, INC. $555,000Active5 beds 3 baths3,003 sq. ft.
9577 49th Place Ne, Saint Michael, MN 55376
MLS# 7012555Listed by: D.R. HORTON, INC.- Open Thu, 12 to 5pm
 $1,059,973Active4 beds 5 baths5,013 sq. ft.
11470 19th Street Ne, Saint Michael, MN 55376
MLS# 7004594Listed by: HANSON BUILDERS INC 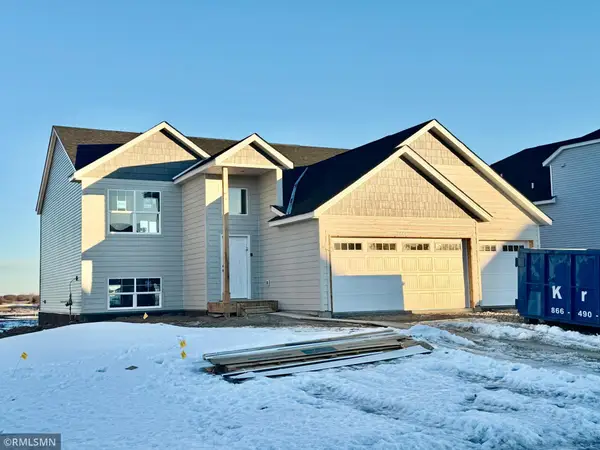 $449,900Pending5 beds 3 baths2,841 sq. ft.
2826 Ivory Avenue Ne, Saint Michael, MN 55376
MLS# 7011472Listed by: CAPSTONE REALTY, LLC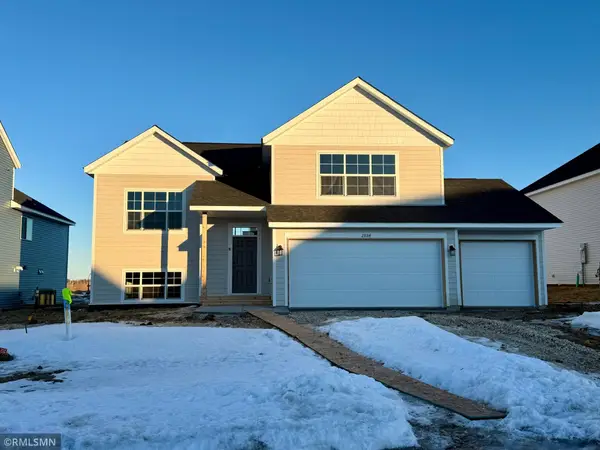 $444,900Pending5 beds 3 baths2,579 sq. ft.
2884 Ivory Avenue Ne, Saint Michael, MN 55376
MLS# 7011363Listed by: CAPSTONE REALTY, LLC $450,000Active4 beds 4 baths3,128 sq. ft.
3435 Kalenda Avenue Ne, Saint Michael, MN 55376
MLS# 7009772 $529,900Active5 beds 4 baths3,204 sq. ft.
1986 Laquey Avenue Ne, Saint Michael, MN 55376
MLS# 7009538Listed by: RE/MAX RESULTS $852,445Active3 beds 3 baths3,189 sq. ft.
3749 Lucy Court Ne, Saint Michael, MN 55376
MLS# 7006583Listed by: COLDWELL BANKER REALTY- Open Wed, 12 to 5pm
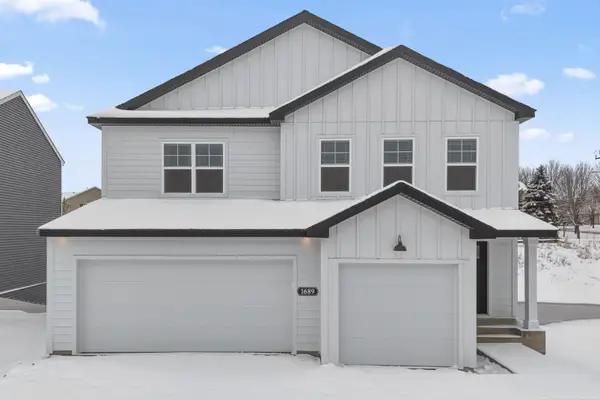 $469,990Pending3 beds 3 baths2,365 sq. ft.
1689 Langston Avenue Ne, Saint Michael, MN 55376
MLS# 7025771Listed by: M/I HOMES  $440,000Active3 beds 2 baths1,800 sq. ft.
2075 Langston Lane Ne, Saint Michael, MN 55376
MLS# 6826859Listed by: WALLIN RESIDENTIAL PROPERTIES $440,000Active3 beds 2 baths1,800 sq. ft.
2075 Langston Lane Ne, Saint Michael, MN 55376
MLS# 6826859Listed by: WALLIN RESIDENTIAL PROPERTIES $526,250Active4 beds 3 baths2,143 sq. ft.
9948 14th Circle Ne, Saint Michael, MN 55376
MLS# 6824900Listed by: COUNSELOR REALTY, INC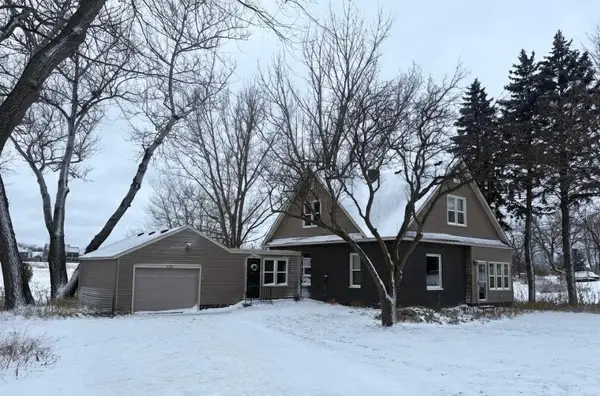 $299,900Active4 beds 1 baths1,440 sq. ft.
309 Central Avenue W, Saint Michael, MN 55376
MLS# 6823411Listed by: PEMBERTON RE $444,900Pending5 beds 3 baths2,579 sq. ft.
2876 Iverson Avenue Ne, Saint Michael, MN 55376
MLS# 6824423Listed by: CAPSTONE REALTY, LLC- Open Thu, 12 to 4pm
 $334,990Pending3 beds 3 baths2,070 sq. ft.
2752 Kepler Avenue Ne, Saint Michael, MN 55376
MLS# 6818973Listed by: M/I HOMES  $522,935Active4 beds 3 baths3,161 sq. ft.
9951 14th Circle Ne, Saint Michael, MN 55376
MLS# 6817106Listed by: COUNSELOR REALTY, INC- Open Sat, 12 to 3pm
 $652,975Active4 beds 3 baths2,641 sq. ft.
3880 Larabee Avenue Ne, Saint Michael, MN 55376
MLS# 7036648Listed by: COLDWELL BANKER REALTY - Open Wed, 12 to 5pm
 $439,990Pending3 beds 3 baths2,183 sq. ft.
1688 Langston Avenue Ne, Saint Michael, MN 55376
MLS# 7020282Listed by: M/I HOMES  $818,000Active4 beds 5 baths4,028 sq. ft.
10991 23rd Street Ne, Saint Michael, MN 55376
MLS# 6795689Listed by: HANSON BUILDERS INC- Open Wed, 12 to 5pm
 $494,990Active4 beds 3 baths2,526 sq. ft.
1690 Langston Avenue Ne, Saint Michael, MN 55376
MLS# 7039488Listed by: M/I HOMES - Open Sat, 12 to 3pm
 $657,945Active3 beds 2 baths1,878 sq. ft.
11876 38th Place Ne, Saint Michael, MN 55376
MLS# 7032665Listed by: COLDWELL BANKER REALTY - Open Wed, 11am to 6pm
 $734,311Active5 beds 4 baths3,624 sq. ft.
11500 19th Street Ne, Saint Michael, MN 55376
MLS# 6788640Listed by: M/I HOMES  $349,900Pending4 beds 2 baths1,821 sq. ft.
3455 Kahler Drive Ne, Saint Michael, MN 55376
MLS# 6787834Listed by: MINNESOTA HOME VENTURE, INC. $550,000Pending5 beds 4 baths3,546 sq. ft.
12745 39th Street Ne, Saint Michael, MN 55376
MLS# 7026006Listed by: KELLER WILLIAMS CLASSIC RLTY NW $1,091,842Pending4 beds 4 baths4,683 sq. ft.
1858 Lasalle Avenue Ne, Saint Michael, MN 55376
MLS# 6774078Listed by: HANSON BUILDERS INC $1,660,726Pending5 beds 5 baths6,594 sq. ft.
1870 Lasalle Avenue Ne, Saint Michael, MN 55376
MLS# 6773756Listed by: HANSON BUILDERS INC $600,000Active4 beds 4 baths3,050 sq. ft.
2301 Keystone Avenue Ne, Saint Michael, MN 55376
MLS# 7007468Listed by: KELLER WILLIAMS CLASSIC RLTY NW $669,900Pending6 beds 5 baths3,298 sq. ft.
2600 Ivy Avenue Ne, Saint Michael, MN 55376
MLS# 6717024Listed by: CAPSTONE REALTY, LLC $399,900Active3 beds 2 baths1,513 sq. ft.
3468 Kachina Avenue Ne, Saint Michael, MN 55376
MLS# 7029973Listed by: EXP REALTY $349,990Pending3 beds 3 baths1,921 sq. ft.
2724 Kepler Avenue Ne, Saint Michael, MN 55376
MLS# 6698605Listed by: M/I HOMES- $534,715Pending4 beds 3 baths2,808 sq. ft.
4694 Landmark Drive Ne, Saint Michael, MN 55376
MLS# 6374330Listed by: COLDWELL BANKER REALTY - Open Sat, 12 to 3pm
 $764,055Active3 beds 3 baths2,946 sq. ft.
3886 Larabee Avenue Ne, Saint Michael, MN 55376
MLS# 7032668Listed by: COLDWELL BANKER REALTY  $425,000Pending4 beds 3 baths2,328 sq. ft.
2328 Jandell Avenue Ne, Saint Michael, MN 55376
MLS# 7018705Listed by: KRIS LINDAHL REAL ESTATE $450,000Pending3 beds 3 baths2,283 sq. ft.
10669 29th Street Ne, Saint Michael, MN 55376
MLS# 6712143Listed by: M/I HOMES $530,859Active4 beds 3 baths2,214 sq. ft.
2745 Kepler Avenue Ne, Saint Michael, MN 55376
MLS# 7004978Listed by: M/I HOMES $564,900Active3 beds 2 baths1,984 sq. ft.
3291 Kady Avenue Ne, Saint Michael, MN 55376
MLS# 6604231Listed by: FIRST IMPRESSIONS HOME GROUP $634,805Pending4 beds 4 baths4,201 sq. ft.
5050 Jana Court Ne, Saint Michael, MN 55376
MLS# 6424200Listed by: LENNAR SALES CORP
Local realty services provided by:CENTURY 21 FM Realty
Neighborhoods near St Michael, MN
Zip codes near St Michael, MN
- 55301 homes for sale
- 55303 homes for sale
- 55309 homes for sale
- 55311 homes for sale
- 55313 homes for sale
- 55327 homes for sale
- 55328 homes for sale
- 55330 homes for sale
- 55340 homes for sale
- 55341 homes for sale
- 55356 homes for sale
- 55357 homes for sale
- 55358 homes for sale
- 55359 homes for sale
- 55362 homes for sale
- 55363 homes for sale
- 55369 homes for sale
- 55373 homes for sale
- 55374 homes for sale
- 55376 homes for sale
Popular searches near St Michael, MN
- Albertville homes for sale
- Big Lake homes for sale
- Big Lake Township homes for sale
- Buffalo homes for sale
- Buffalo Township homes for sale
- Corcoran homes for sale
- Delano homes for sale
- Elk River homes for sale
- Greenfield homes for sale
- Hamel homes for sale
- Hanover homes for sale
- Hanover homes for sale
- Loretto homes for sale
- Monticello homes for sale
- Monticello Township homes for sale
- Otsego homes for sale
- Rockford homes for sale
- Rockford Township homes for sale
- Rockford homes for sale
- Rogers homes for sale
Protect your home and budget from life's surprises with an Assurant Home Warranty, backed by a partner that supports you through every step of homeownership. Explore Plans.
©2026 Century 21 Real Estate LLC. All rights reserved. CENTURY 21®, the CENTURY 21 Logo and C21® are service marks owned by Century 21 Real Estate LLC. Century 21 Real Estate LLC fully supports the principles of the Fair Housing Act and the Equal Opportunity Act. Each office is independently owned and operated. Listing information is deemed reliable but not guaranteed accurate.