- Bacons Castle homes for sale
- Benns Church homes for sale
- Carrollton homes for sale
- Carrsville homes for sale
- Chesapeake homes for sale
- Hampton homes for sale
- Hardy homes for sale
- Ivor homes for sale
- Newport homes for sale
- Newport News homes for sale
- Norfolk homes for sale
- Poquoson homes for sale
- Portsmouth homes for sale
- Rushmere homes for sale
- Seaford homes for sale
- Smithfield homes for sale
- Suffolk homes for sale
- Virginia Beach homes for sale
- Windsor homes for sale
- Zuni homes for sale
23435, VA - homes for sale
300 of 400 results displayed
 $442,605Pending2 beds 2 baths1,527 sq. ft.
431 Braden Lane, Suffolk, VA 23435
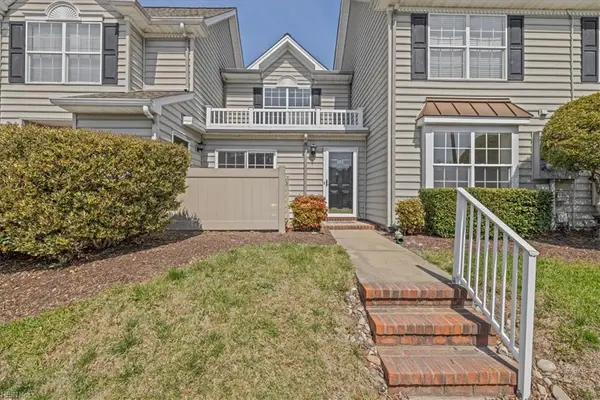
MLS# 10627530Listed by: BHHS RW Towne Realty $425,486Pending3 beds 4 baths2,068 sq. ft.
1005 Serene Road #100, Suffolk, VA 23435
MLS# 10627550Listed by: BHHS RW Towne Realty $737,465Pending5 beds 5 baths3,354 sq. ft.
6027 Sam Callis Circle, Suffolk, VA 23434
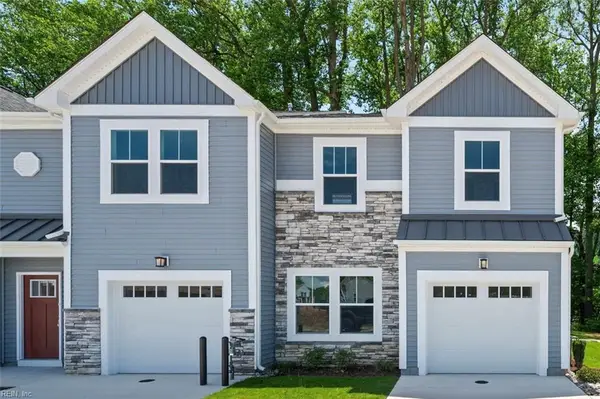
MLS# 10627586Listed by: BHHS RW Towne Realty $342,860Pending3 beds 3 baths1,308 sq. ft.
1011 Serene Road #101, Suffolk, VA 23435
MLS# 10627300Listed by: BHHS RW Towne Realty $710,975Pending3 beds 3 baths3,138 sq. ft.
6023 Sam Callis Circle, Suffolk, VA 23435
MLS# 10627308Listed by: BHHS RW Towne Realty $742,975Pending5 beds 5 baths3,914 sq. ft.
205 Balfour Drive, Suffolk, VA 23435
MLS# 10627421Listed by: Today Homes Realty LLC- New
 $571,240Active4 beds 4 baths2,312 sq. ft.
5121 Duxbury Road, Suffolk, VA 23435
MLS# 10627373Listed by: D R Horton Realty of Virginia - New
 $592,740Active4 beds 3 baths2,623 sq. ft.
5127 Duxbury Road, Suffolk, VA 23435
MLS# 10627374Listed by: D R Horton Realty of Virginia - New
 $537,000Active2 beds 2 baths2,213 sq. ft.
2005 Asher (lot 74) Drive, Suffolk, VA 23435
MLS# 10627358Listed by: BHHS RW Towne Realty - New
 $679,000Active3 beds 3 baths2,698 sq. ft.
119 Creek Lane, Suffolk, VA 23435
MLS# 10627240Listed by: Howard Hanna Real Estate Svcs.  $391,515Pending3 beds 2 baths1,527 sq. ft.
107 Kini Lane, Suffolk, VA 23432
MLS# 10627106Listed by: BHHS RW Towne Realty $349,545Pending3 beds 3 baths1,408 sq. ft.
1008 Serene Road #102, Suffolk, VA 23435
MLS# 10627180Listed by: BHHS RW Towne Realty- New
 $345,000Active3 beds 3 baths1,452 sq. ft.
6118 Cushing Street, Suffolk, VA 23435
MLS# 10626457Listed by: Howard Hanna Real Estate Svcs. - New
 $345,000Active4 beds 3 baths1,739 sq. ft.
943 Vineyard Place #A, Suffolk, VA 23435
MLS# 10626618Listed by: Howard Hanna Real Estate Svcs. - New
 $574,900Active4 beds 3 baths2,842 sq. ft.
MM River Club (sandalwood ), Suffolk, VA 23435
MLS# 10627177Listed by: Today Homes Realty LLC - New
 $1,275,000Active5 beds 5 baths5,052 sq. ft.
5225 Regatta Pointe Road, Suffolk, VA 23435
MLS# 10626858Listed by: BHHS RW Towne Realty - New
 $400,000Active3 beds 4 baths2,068 sq. ft.
2022 Laycock Lane #101, Suffolk, VA 23435
MLS# 10627083Listed by: KW Allegiance - Open Sat, 10am to 6pmNew
 $592,240Active4 beds 3 baths2,613 sq. ft.
5122 Duxbury Road, Suffolk, VA 23435
MLS# 10627099Listed by: D R Horton Realty of Virginia  $530,815Pending4 beds 3 baths2,619 sq. ft.
2021 Canvasback Drive, Suffolk, VA 23435
MLS# 10626998Listed by: Today Homes Realty LLC- New
 $389,900Active4 beds 3 baths2,200 sq. ft.
2003 Augusta Court, Suffolk, VA 23435
MLS# 10626961Listed by: XRealty.NET LLC - New
 $586,900Active5 beds 4 baths3,081 sq. ft.
MM River Club (azalea), Suffolk, VA 23435
MLS# 10626968Listed by: Today Homes Realty LLC - New
 $365,000Active3 beds 3 baths1,673 sq. ft.
3033 Frederick Street, Suffolk, VA 23435
MLS# 10626989Listed by: VA Realty Professionals - New
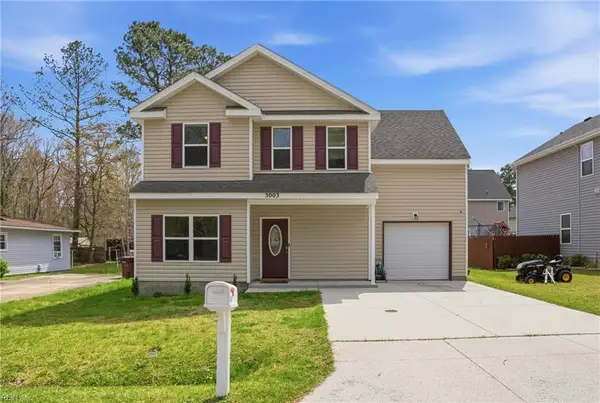 $449,900Active5 beds 3 baths2,350 sq. ft.
5003 Clifton Street, Chesapeake, VA 23321
MLS# 10626543Listed by: Atlantic Sothebys Int'l Realty - New
 $363,900Active3 beds 2 baths1,320 sq. ft.
5905 Knotts Neck Road, Suffolk, VA 23435
MLS# 10626899Listed by: A Better Way Realty Inc. - New
 $475,000Active3 beds 3 baths2,500 sq. ft.
3005 Wincanton Cove, Suffolk, VA 23435
MLS# 10626659Listed by: 1st Class Real Estate Flagship - New
 $529,688Active3 beds 3 baths2,880 sq. ft.
2053 Asher (lot 2) Drive, Suffolk, VA 23435
MLS# 10626810Listed by: BHHS RW Towne Realty - New
 $429,900Active3 beds 2 baths2,002 sq. ft.
919 Vineyard Place #B, Suffolk, VA 23435
MLS# 10626837Listed by: A Better Way Realty Inc. - New
 $425,000Active3 beds 4 baths2,249 sq. ft.
1241 Worden Way, Suffolk, VA 23435
MLS# 10626503Listed by: Keller Williams Realty Twn Ctr 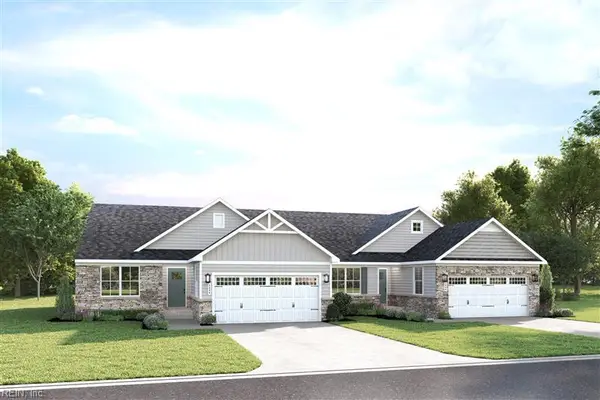 $410,460Pending3 beds 2 baths1,527 sq. ft.
210 Joy Lane, Suffolk, VA 23435
MLS# 10626368Listed by: BHHS RW Towne Realty- New
 $264,900Active2 beds 3 baths1,321 sq. ft.
905 Lakeside Drive, Suffolk, VA 23435
MLS# 10626762Listed by: Own Real Estate LLC - New
 $645,975Active4 beds 4 baths2,748 sq. ft.
MM Nansemond River Estates (siena 2), Suffolk, VA 23435
MLS# 10626609Listed by: BHHS RW Towne Realty - New
 $703,900Active5 beds 3 baths3,351 sq. ft.
162 Long Cove Drive, Suffolk, VA 23435
MLS# 10626664Listed by: Today Homes Realty LLC - New
 $373,046Active3 beds 3 baths1,530 sq. ft.
1008 Serene Road #100, Suffolk, VA 23435
MLS# 10626699Listed by: BHHS RW Towne Realty 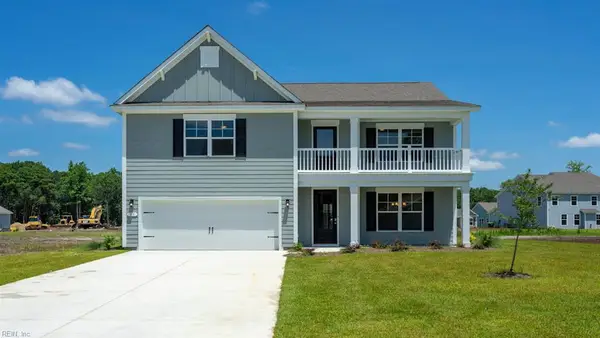 $629,990Pending5 beds 4 baths3,226 sq. ft.
5124 Duxbury Road, Suffolk, VA 23435
MLS# 10626703Listed by: D R Horton Realty of Virginia- New
 $356,909Active3 beds 3 baths1,408 sq. ft.
1011 Serene Road #102, Suffolk, VA 23435
MLS# 10626651Listed by: BHHS RW Towne Realty - New
 $604,315Active5 beds 4 baths2,623 sq. ft.
1008 Eastport Place, Suffolk, VA 23435
MLS# 10626700Listed by: D R Horton Realty of Virginia - New
 $541,841Active3 beds 3 baths2,859 sq. ft.
2092 Asher (lot 52) Drive, Suffolk, VA 23435
MLS# 10626621Listed by: BHHS RW Towne Realty - New
 $369,900Active4 beds 3 baths1,964 sq. ft.
207 Rockwood Place, Suffolk, VA 23435
MLS# 10626597Listed by: Iron Valley Real Estate HR  $584,740Pending4 beds 4 baths2,312 sq. ft.
1006 Eastport Place, Suffolk, VA 23435
MLS# 10626298Listed by: D R Horton Realty of Virginia- New
 $714,900Active5 beds 4 baths3,319 sq. ft.
337 Rhapsody Drive, Suffolk, VA 23435
MLS# 10626553Listed by: Today Homes Realty LLC - New
 $315,000Active3 beds 3 baths1,618 sq. ft.
3766 Pear Orchard Way, Suffolk, VA 23435
MLS# 10626406Listed by: Proactive Real Estate Services - New
 $312,000Active3 beds 3 baths1,804 sq. ft.
3736 Pear Orchard Way, Suffolk, VA 23435
MLS# 10626407Listed by: Proactive Real Estate Services - New
 $612,240Active5 beds 3 baths2,511 sq. ft.
5126 Duxbury Road, Suffolk, VA 23435
MLS# 10626384Listed by: D R Horton Realty of Virginia - New
 $521,007Active3 beds 3 baths2,859 sq. ft.
1014 Libby (lot 60) Way, Suffolk, VA 23435
MLS# 10626345Listed by: BHHS RW Towne Realty - New
 $624,900Active5 beds 3 baths3,100 sq. ft.
3720 Finish Line Arch, Suffolk, VA 23435
MLS# 10613681Listed by: Earl Sanders Realty Inc - New
 $364,000Active3 beds 3 baths1,972 sq. ft.
6060 Newington Place, Suffolk, VA 23435
MLS# 10625895Listed by: Howard Hanna Real Estate Svcs. - New
 $1,064,900Active5 beds 5 baths4,151 sq. ft.
118 Sleepy Point Way, Suffolk, VA 23435
MLS# 10626227Listed by: BHHS RW Towne Realty - New
 $842,615Active5 beds 3 baths3,175 sq. ft.
310 Rhapsody Drive, Suffolk, VA 23435
MLS# 10626182Listed by: Today Homes Realty LLC - New
 $397,000Active4 beds 3 baths2,281 sq. ft.
2006 Silver Charm Circle, Suffolk, VA 23435
MLS# 10626171Listed by: AtCoastal Realty  $416,900Active3 beds 3 baths2,013 sq. ft.
504 Crystal Bay Circle, Suffolk, VA 23435
MLS# 10626148Listed by: COVA Home Realty $250,000Active2 beds 3 baths1,154 sq. ft.
308 Waters Edge Lane, Suffolk, VA 23435
MLS# 10625724Listed by: The Real Estate Group $760,000Active4 beds 3 baths3,270 sq. ft.
206 Selby Court, Suffolk, VA 23435
MLS# 10625965Listed by: World Class Realty $270,000Pending3 beds 3 baths1,635 sq. ft.
3509 Burlington Street #23, Suffolk, VA 23435
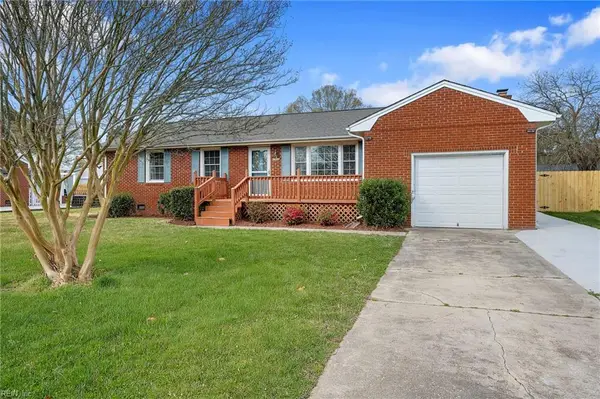
MLS# 10626009Listed by: 1st Class RealEstate Integrity $369,000Active4 beds 2 baths1,710 sq. ft.
2824 Country Club Drive, Suffolk, VA 23435
MLS# 10625936Listed by: Surry Side Realty $349,990Pending2 beds 2 baths1,489 sq. ft.
2010 Ashworth Way, Suffolk, VA 23435
MLS# 10625954Listed by: Pointe East Realty LLC $529,000Active4 beds 3 baths2,760 sq. ft.
102 Foxcroft Road, Suffolk, VA 23435
MLS# 10625921Listed by: Swell Real Estate Co $399,990Active3 beds 3 baths1,930 sq. ft.
2004 Ashworth Way, Suffolk, VA 23435
MLS# 10625084Listed by: Pointe East Realty LLC $389,990Active2 beds 4 baths1,978 sq. ft.
2012 Ashworth Way, Suffolk, VA 23435
MLS# 10625261Listed by: Pointe East Realty LLC $394,990Active3 beds 3 baths2,015 sq. ft.
1014 Ashworth Way, Suffolk, VA 23435
MLS# 10625267Listed by: Pointe East Realty LLC $470,000Active4 beds 3 baths2,573 sq. ft.
6322 Townsend Place, Suffolk, VA 23435
MLS# 10625690Listed by: Atlantic Sothebys Int'l Realty $374,900Active3 beds 3 baths1,541 sq. ft.
5040 Huntclub Chase, Suffolk, VA 23435
MLS# 10625752Listed by: Keller Williams Capital Props. $829,000Active4 beds 3 baths3,200 sq. ft.
6533 Harbour Pointe Drive, Suffolk, VA 23435
MLS# 10625843Listed by: BHHS RW Towne Realty $565,000Active5 beds 4 baths2,560 sq. ft.
1124 Erin Drive, Suffolk, VA 23435
MLS# 10625781Listed by: Real Broker LLC $399,000Active4 beds 3 baths2,002 sq. ft.
119 Stoney Ridge Ave, Suffolk, VA 23435
MLS# 10625746Listed by: KW Coastal Virginia Chesapeake $985,900Active5 beds 5 baths4,700 sq. ft.
314 Rhapsody Drive, Suffolk, VA 23435
MLS# 10625712Listed by: Today Homes Realty LLC $727,900Active5 beds 4 baths3,333 sq. ft.
158 Long Cove Drive, Suffolk, VA 23435
MLS# 10625706Listed by: Today Homes Realty LLC $492,950Active3 beds 3 baths2,066 sq. ft.
MM Bennetts Creek Quarter (salerno 3), Suffolk, VA 23435
MLS# 10625380Listed by: BHHS RW Towne Realty $379,990Active2 beds 2 baths1,217 sq. ft.
1020 Ashworth Way, Suffolk, VA 23435
MLS# 10625279Listed by: Pointe East Realty LLC $310,719Active2 beds 2 baths1,069 sq. ft.
2006 Ashworth Way, Suffolk, VA 23435
MLS# 10625286Listed by: Pointe East Realty LLC $399,900Active4 beds 3 baths2,100 sq. ft.
6340 Old Townpoint Road, Suffolk, VA 23435
MLS# 10625391Listed by: Atlantic Sothebys Int'l Realty $355,000Active3 beds 3 baths2,276 sq. ft.
3753 Pear Orchard Way, Suffolk, VA 23435
MLS# 10624185Listed by: BHHS RW Towne Realty $400,000Active3 beds 3 baths1,741 sq. ft.
1218 Gunboat Drive #E, Suffolk, VA 23435
MLS# 10625095Listed by: Long & Foster Real Estate Inc. $975,000Active6 beds 4 baths4,778 sq. ft.
6004 Spinnaker Cove Court, Suffolk, VA 23435
MLS# 10625168Listed by: VA Realty Professionals $375,000Active4 beds 3 baths1,556 sq. ft.
3503 Derby Cove, Suffolk, VA 23435
MLS# 10624978Listed by: LPT Network Realty LLC $175,000Pending3 beds 2 baths1,508 sq. ft.
4506 John Street, Suffolk, VA 23439
MLS# 10624879Listed by: RE/MAX Elevate
 $435,000Pending3 beds 3 baths2,369 sq. ft.
3605 Canal Turn Court, Suffolk, VA 23435
MLS# 10624972Listed by: CENTURY 21 Nachman Realty $698,295Active4 beds 4 baths2,957 sq. ft.
6021 Sam Callis Circle, Suffolk, VA 23435
MLS# 10624973Listed by: BHHS RW Towne Realty $521,270Active3 beds 3 baths2,176 sq. ft.
MM Bennetts Creek Quarter (spinnaker 3 Bedroom), Suffolk, VA 23435
MLS# 10619761Listed by: BHHS RW Towne Realty $475,000Active4 beds 3 baths2,470 sq. ft.
6303 S Oaken Gate Drive, Suffolk, VA 23435
MLS# 10624544Listed by: BHHS RW Towne Realty $515,000Active3 beds 3 baths2,535 sq. ft.
216 Preservation Reach, Suffolk, VA 23435
MLS# 10624649Listed by: Keller Williams Capital Props. $604,740Pending5 beds 3 baths2,511 sq. ft.
Lot 58 Duxbury Road, Suffolk, VA 23435
MLS# 10624611Listed by: D R Horton Realty of Virginia $699,000Active4 beds 3 baths3,272 sq. ft.
3413 Mintonville Point Drive, Suffolk, VA 23435
MLS# 10624315Listed by: RE/MAX Connect- Open Sat, 12 to 4pm
 $369,990Active2 beds 2 baths1,527 sq. ft.
105 Kini Lane, Suffolk, VA 23435
MLS# 10624547Listed by: BHHS RW Towne Realty - Open Sat, 12 to 4pm
 $369,990Active3 beds 2 baths1,343 sq. ft.
424 Braden Lane, Suffolk, VA 23435
MLS# 10624552Listed by: BHHS RW Towne Realty  $721,405Pending10 beds 5 baths3,914 sq. ft.
206 Balfour Drive, Suffolk, VA 23435
MLS# 10624448Listed by: Today Homes Realty LLC $398,254Active3 beds 3 baths1,702 sq. ft.
1007 Serene Road #101, Suffolk, VA 23435
MLS# 10624459Listed by: BHHS RW Towne Realty $400,000Active3 beds 3 baths1,530 sq. ft.
1002 Opal Street #104, Suffolk, VA 23435
MLS# 10624236Listed by: EXP Realty LLC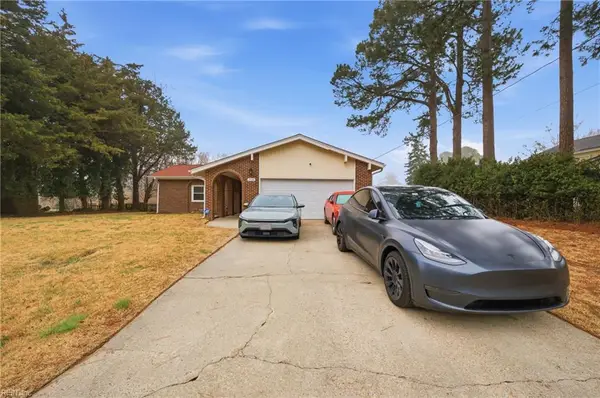 $389,000Active3 beds 2 baths1,260 sq. ft.
3736 Concord Drive, Suffolk, VA 23435
MLS# 10624294Listed by: Queen Real Estate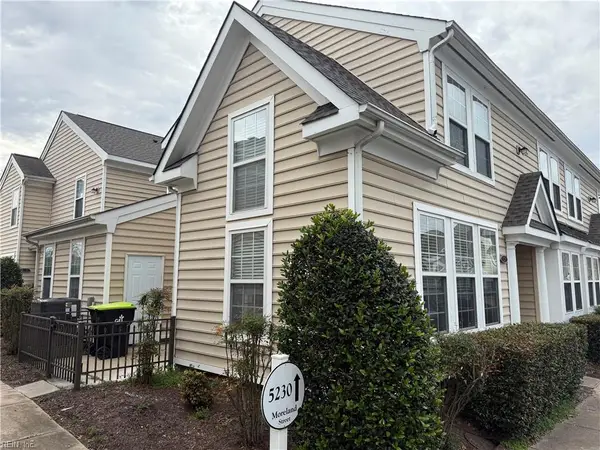 $309,900Active3 beds 3 baths1,498 sq. ft.
5228 Moreland Street, Suffolk, VA 23435
MLS# 10624243Listed by: Real Broker LLC $499,950Active4 beds 3 baths2,390 sq. ft.
1011 Diamond Way #C, Suffolk, VA 23435
MLS# 10624126Listed by: RE/MAX Country to Coast $435,220Pending4 beds 4 baths2,071 sq. ft.
4301 Abercorn Drive #100, Suffolk, VA 23435
MLS# 10623881Listed by: BHHS RW Towne Realty $300,000Active3 beds 3 baths1,706 sq. ft.
5250 Moreland Street, Suffolk, VA 23435
MLS# 10623335Listed by: AtCoastal Realty $475,000Pending4 beds 3 baths2,195 sq. ft.
5043 Bay Circle, Suffolk, VA 23435
MLS# 10623860Listed by: Own Real Estate LLC $359,000Active4 beds 3 baths1,720 sq. ft.
6705 Hampton Roads Parkway, Suffolk, VA 23435
MLS# 10623880Listed by: BHHS RW Towne Realty $299,000Active2 beds 2 baths1,052 sq. ft.
2002 Ashworth Way, Suffolk, VA 23435
MLS# 10623806Listed by: Garrett Realty Partners $339,990Active3 beds 3 baths1,900 sq. ft.
5027 Prestwick Street, Suffolk, VA 23435
MLS# 10623775Listed by: CENTURY 21 Nachman Realty $369,075Pending3 beds 2 baths1,343 sq. ft.
418 Braden Lane, Suffolk, VA 23435
MLS# 10623557Listed by: BHHS RW Towne Realty- Open Fri, 1 to 3pm
 $1,275,000Active6 beds 5 baths4,805 sq. ft.
6003 Spinnaker Cove Court, Suffolk, VA 23435
MLS# 10623448Listed by: Keller Williams Capital Props.  $430,000Active3 beds 3 baths1,960 sq. ft.
6210 Glenrose Drive, Suffolk, VA 23435
MLS# 10623262Listed by: Wainwright Real Estate $707,700Pending4 beds 3 baths3,080 sq. ft.
113 Windy Point Drive, Suffolk, VA 23435
MLS# 10623230Listed by: COVA Home Realty $329,900Pending3 beds 3 baths1,308 sq. ft.
1008 Serene Road #101, Suffolk, VA 23435
MLS# 10623303Listed by: BHHS RW Towne Realty $785,000Pending5 beds 4 baths2,750 sq. ft.
3121 Summerhouse Drive, Suffolk, VA 23435
MLS# 10623293Listed by: BHHS RW Towne Realty $499,500Active4 beds 2 baths2,443 sq. ft.
200 Catalpa Court, Suffolk, VA 23435
MLS# 10623330Listed by: BHHS RW Towne Realty $425,380Active4 beds 4 baths2,071 sq. ft.
1007 Serene Road #102, Suffolk, VA 23435
MLS# 10623337Listed by: BHHS RW Towne Realty $592,740Active4 beds 3 baths2,623 sq. ft.
5220 Corolla Drive, Suffolk, VA 23435
MLS# 10623346Listed by: D R Horton Realty of Virginia $569,740Active4 beds 4 baths2,312 sq. ft.
5133 Duxbury Road, Suffolk, VA 23435
MLS# 10623352Listed by: D R Horton Realty of Virginia $272,000Active2 beds 3 baths1,321 sq. ft.
605 Waters Edge Lane, Suffolk, VA 23435
MLS# 10623184Listed by: Triumph Realty $514,900Active3 beds 3 baths2,557 sq. ft.
MM Nansemond, Suffolk, VA 23435
MLS# 10592309Listed by: BHHS RW Towne Realty $410,000Active3 beds 3 baths2,013 sq. ft.
1005 Bay Breeze Boulevard, Suffolk, VA 23435
MLS# 10623149Listed by: Holloway Experience Real Est. $298,000Active2 beds 2 baths1,359 sq. ft.
1710 Union Pacific Way, Suffolk, VA 23435
MLS# 10623061Listed by: BHHS RW Towne Realty $517,000Pending4 beds 3 baths2,135 sq. ft.
2917 Ames Cove Drive, Suffolk, VA 23435
MLS# 10623002Listed by: 1st Advantage Realty LLC $514,900Active4 beds 3 baths2,925 sq. ft.
202 Thornwood Drive, Suffolk, VA 23435
MLS# 10622992Listed by: RE/MAX Country to Coast $149,000Active1 Acres
4200 John (301728600) Street, Suffolk, VA 23435
MLS# 10623007Listed by: Metro Brokers of Hampton Roads $425,000Pending4 beds 2 baths1,900 sq. ft.
5540 Weatherby Way, Suffolk, VA 23435
MLS# 10622997Listed by: 1st Class Real Estate Flagship $499,990Active4 beds 3 baths1,953 sq. ft.
1118 Erin Drive, Suffolk, VA 23435
MLS# 10620456Listed by: D R Horton Realty of Virginia $383,620Pending3 beds 2 baths1,343 sq. ft.
412 Braden Lane, Suffolk, VA 23435
MLS# 10622939Listed by: BHHS RW Towne Realty $543,545Active5 beds 3 baths2,438 sq. ft.
MM Bennetts Creek Quarter (palermo 5 Bedroom), Suffolk, VA 23435
MLS# 10622743Listed by: BHHS RW Towne Realty $395,000Pending4 beds 4 baths2,034 sq. ft.
1212 Gunboat Drive, Suffolk, VA 23435
MLS# 10622761Listed by: 1st Class Real Estate Flagship $395,000Pending3 beds 3 baths2,356 sq. ft.
1023 Silver Charm Circle, Suffolk, VA 23435
MLS# 10622784Listed by: Iron Valley Real Estate HR $410,000Active4 beds 3 baths2,334 sq. ft.
164 Stoney Ridge Avenue, Suffolk, VA 23435
MLS# 10622715Listed by: Real Broker LLC $599,770Active3 beds 3 baths2,334 sq. ft.
MM Nansemond River Estates (marino), Suffolk, VA 23435
MLS# 10621473Listed by: BHHS RW Towne Realty $650,000Pending6 beds 4 baths3,254 sq. ft.
103 Sea Biscuit Run, Suffolk, VA 23435
MLS# 10621510Listed by: KW Coastal Virginia Chesapeake $813,250Pending5 beds 5 baths3,900 sq. ft.
123 Margolies Court, Suffolk, VA 23435
MLS# 10621357Listed by: Today Homes Realty LLC $409,900Active3 beds 4 baths2,068 sq. ft.
2009 Laycock Lane #102, Suffolk, VA 23435
MLS# 10621225Listed by: BHHS RW Towne Realty $574,361Pending3 beds 3 baths2,557 sq. ft.
2057 Asher (lot 4) Drive, Suffolk, VA 23435
MLS# 10621213Listed by: BHHS RW Towne Realty $360,000Active3 beds 3 baths1,787 sq. ft.
4025 Palmer Court, Suffolk, VA 23435
MLS# 10621134Listed by: ONYX Realty Professionals $1,038,850Pending5 beds 5 baths3,556 sq. ft.
326 Rhapsody Drive, Suffolk, VA 23435
MLS# 10621099Listed by: Today Homes Realty LLC $385,455Pending3 beds 2 baths1,343 sq. ft.
414 Braden Lane, Suffolk, VA 23435
MLS# 10621065Listed by: BHHS RW Towne Realty $919,900Active5 beds 4 baths3,489 sq. ft.
320 Rhapsody Drive, Suffolk, VA 23435
MLS# 10621039Listed by: Today Homes Realty LLC $917,500Active5 beds 5 baths3,694 sq. ft.
322 Rhapsody Drive, Suffolk, VA 23435
MLS# 10621051Listed by: Today Homes Realty LLC $398,700Pending3 beds 3 baths2,300 sq. ft.
4029 Burr Oak Place, Suffolk, VA 23435
MLS# 10620990Listed by: Howard Hanna Real Estate Svcs. $275,000Pending3 beds 2 baths1,056 sq. ft.
5001 Pearl Street, Chesapeake, VA 23321
MLS# 10620935Listed by: COVA Home Realty $830,859Pending6 beds 6 baths4,462 sq. ft.
202 Balfour Drive, Suffolk, VA 23435
MLS# 10620861Listed by: Today Homes Realty LLC $749,000Active4 beds 3 baths3,214 sq. ft.
3409 Mintonville Point Drive, Suffolk, VA 23435
MLS# 10620739Listed by: RE/MAX Connect $679,000Active4 beds 3 baths2,878 sq. ft.
3411 Mintonville Point Drive, Suffolk, VA 23435
MLS# 10620794Listed by: RE/MAX Connect $40,000Active0.18 Acres
L 60 Clifton Street, Suffolk, VA 23435
MLS# 10619764Listed by: John E. Wood Realty Inc. $639,900Active5 beds 4 baths3,133 sq. ft.
160 Secretariat Drive, Suffolk, VA 23435
MLS# 10620710Listed by: Atlantic Connection Real Est.- $40,000Active0.17 Acres
L 54 Clifton Street, Suffolk, VA 23435
MLS# 10620744Listed by: John E. Wood Realty Inc. - $40,000Active0.17 Acres
L 58 Clifton Street, Suffolk, VA 23435
MLS# 10620761Listed by: John E. Wood Realty Inc. - $40,000Active0.16 Acres
L 62 Clifton Street, Suffolk, VA 23435
MLS# 10620767Listed by: John E. Wood Realty Inc.  $865,113Pending4 beds 3 baths3,368 sq. ft.
204 Balfour Drive Drive, Suffolk, VA 23435
MLS# 10620697Listed by: Today Homes Realty LLC $514,000Pending4 beds 3 baths2,300 sq. ft.
3003 Beech Grove Lane, Suffolk, VA 23435
MLS# 10620666Listed by: The Real Estate Group- Open Sat, 12 to 5pm
 $379,990Active3 beds 2 baths1,343 sq. ft.
416 Braden Lane, Suffolk, VA 23435
MLS# 10620542Listed by: BHHS RW Towne Realty  $445,000Active4 beds 3 baths2,286 sq. ft.
211 Ivystone Reach, Suffolk, VA 23435
MLS# 10620461Listed by: Reeds Real Estate LLC $459,900Active3 beds 3 baths2,479 sq. ft.
6801 Ivanhoe Court, Suffolk, VA 23435
MLS# 10620172Listed by: Cottage Street Realty LLC $540,000Active4 beds 3 baths2,436 sq. ft.
221 Baron Boulevard, Suffolk, VA 23435
MLS# 10620019Listed by: BHHS RW Towne Realty $559,999Pending5 beds 3 baths3,400 sq. ft.
4487 Chatham Road, Suffolk, VA 23435
MLS# 10620160Listed by: Iron Valley Real Est Norfolk- Open Sat, 1 to 3pm
 $649,900Active4 beds 3 baths3,186 sq. ft.
122 Affirmed Drive, Suffolk, VA 23435
MLS# 10620097Listed by: Southside Real Estate  $664,900Active3 beds 2 baths2,558 sq. ft.
317 Rhapsody Drive, Suffolk, VA 23435
MLS# 10620024Listed by: Today Homes Realty LLC $269,899Pending3 beds 1 baths960 sq. ft.
5653 Person Street, Suffolk, VA 23435
MLS# 10619953Listed by: World Class Realty $465,000Active4 beds 4 baths2,436 sq. ft.
3046 Bay Shore Lane, Suffolk, VA 23435
MLS# 10619861Listed by: Seaside Realty $980,000Pending5 beds 5 baths4,295 sq. ft.
3115 Summerhouse Drive, Suffolk, VA 23435
MLS# 10619877Listed by: The Real Estate Group $548,900Active3 beds 2 baths2,176 sq. ft.
2232 Patrick Drive, Suffolk, VA 23435
MLS# 10619838Listed by: Today Homes Realty LLC $662,900Active5 beds 3 baths3,351 sq. ft.
2024 Canvasback Drive, Suffolk, VA 23435
MLS# 10619834Listed by: Today Homes Realty LLC $589,900Active4 beds 3 baths2,619 sq. ft.
2231 Patrick Drive, Suffolk, VA 23435
MLS# 10619783Listed by: Today Homes Realty LLC $499,990Active4 beds 3 baths1,953 sq. ft.
3039 Dalton Circle, Suffolk, VA 23435
MLS# 10619808Listed by: D R Horton Realty of Virginia- Open Sat, 10am to 6pm
 $499,990Active4 beds 3 baths1,953 sq. ft.
3030 Dalton Circle, Suffolk, VA 23435
MLS# 10619814Listed by: D R Horton Realty of Virginia  $250,900Active3 beds 3 baths1,800 sq. ft.
923 Teton Circle #110, Suffolk, VA 23435
MLS# 10619818Listed by: Benham Real Estate LLC $596,900Active4 beds 3 baths2,619 sq. ft.
2028 Canvasback Drive, Suffolk, VA 23435
MLS# 10619827Listed by: Today Homes Realty LLC $505,125Active4 beds 3 baths2,278 sq. ft.
MM Bennetts Creek Quarter (venosa 4 Bedroom), Suffolk, VA 23435
MLS# 10619635Listed by: BHHS RW Towne Realty $589,000Active5 beds 3 baths2,784 sq. ft.
101 Affirmed Dr, Suffolk, VA 23435
MLS# 10619589Listed by: KW Coastal Virginia Chesapeake $474,450Active3 beds 3 baths1,825 sq. ft.
MM Bennetts Creek Quarter (mondovi 3 Bedroom), Suffolk, VA 23435
MLS# 10619529Listed by: BHHS RW Towne Realty $410,000Pending3 beds 3 baths2,100 sq. ft.
1003 Silver Charm Circle, Suffolk, VA 23435
MLS# 10619419Listed by: EXIT Realty Central $715,000Pending4 beds 4 baths3,388 sq. ft.
3747 Willow Glenn Circle, Suffolk, VA 23435
MLS# 10619111Listed by: Iron Valley Real Estate HR $583,567Pending4 beds 3 baths2,619 sq. ft.
207 Balfour Drive, Suffolk, VA 23435
MLS# 10619296Listed by: Today Homes Realty LLC $769,839Active5 beds 5 baths3,354 sq. ft.
6031 Sam Callis Circle, Suffolk, VA 23434
MLS# 10619027Listed by: BHHS RW Towne Realty $740,000Pending6 beds 3 baths3,600 sq. ft.
6016 Spinnaker Cove Court, Suffolk, VA 23435
MLS# 10618909Listed by: Better Homes & Gdns Ntv Am Grp $575,990Active4 beds 3 baths2,618 sq. ft.
5232 Corolla Drive, Suffolk, VA 23435
MLS# 10619056Listed by: D R Horton Realty of Virginia $875,000Active6 beds 4 baths4,617 sq. ft.
3352 Oyster Creek Drive, Suffolk, VA 23435
MLS# 10618520Listed by: BHHS RW Towne Realty $439,800Pending4 beds 4 baths2,360 sq. ft.
1014 Bay Breeze Drive, Suffolk, VA 23435
MLS# 10618978Listed by: COVA Home Realty $638,618Pending4 beds 3 baths2,619 sq. ft.
305 Rhapsody Drive, Suffolk, VA 23435
MLS# 10618921Listed by: Today Homes Realty LLC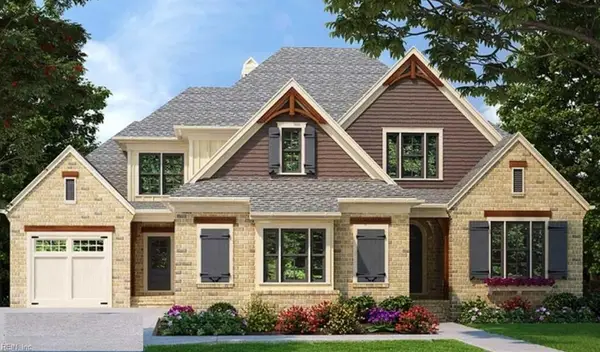 $1,750,000Active5 beds 4 baths4,307 sq. ft.
9508 North River Road, Suffolk, VA 23435
MLS# 10618906Listed by: East West Realty-Hampton Roads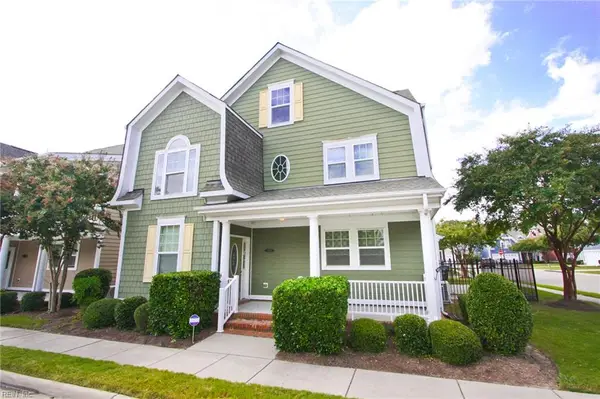 $545,000Active5 beds 4 baths3,542 sq. ft.
304 Ford Drive, Suffolk, VA 23435
MLS# 10618785Listed by: BHHS RW Towne Realty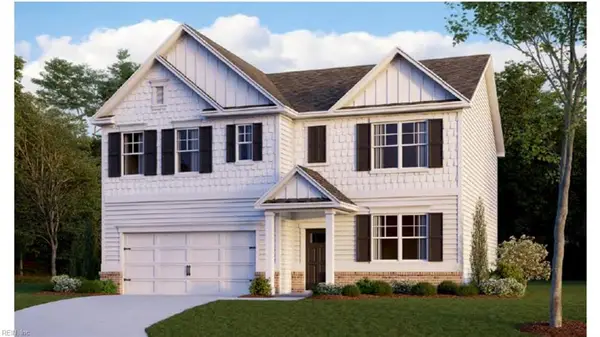 $576,990Pending5 beds 3 baths2,511 sq. ft.
3043 Dalton Circle, Suffolk, VA 23435
MLS# 10618818Listed by: D R Horton Realty of Virginia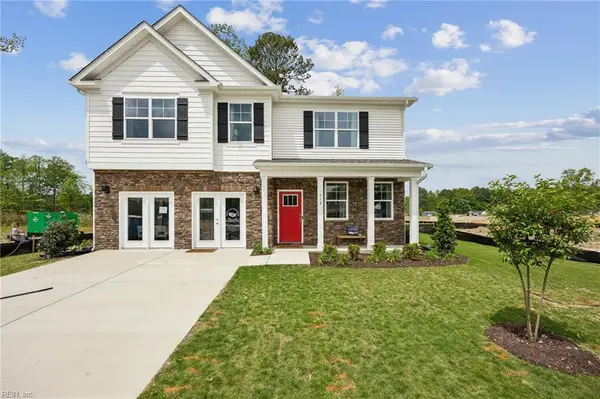 $566,990Pending4 beds 3 baths2,804 sq. ft.
3041 Dalton Circle, Suffolk, VA 23435
MLS# 10618743Listed by: D R Horton Realty of Virginia $590,695Active3 beds 3 baths2,859 sq. ft.
1103 Elaina (lot 44) Place, Suffolk, VA 23435
MLS# 10618618Listed by: BHHS RW Towne Realty $490,000Active4 beds 3 baths2,390 sq. ft.
1008 Paragon Way #D, Suffolk, VA 23435
MLS# 10618570Listed by: BHHS RW Towne Realty $554,740Active5 beds 4 baths2,199 sq. ft.
5224 Corolla Drive, Suffolk, VA 23435
MLS# 10618604Listed by: D R Horton Realty of Virginia $289,990Active1 beds 2 baths1,006 sq. ft.
MM Signature Series @ Legacy Lakeside Lofts, Suffolk, VA 23435
MLS# 10618467Listed by: Pointe East Realty LLC $589,000Active3 beds 3 baths2,720 sq. ft.
1013 Strawberry Court, Suffolk, VA 23435
MLS# 10618003Listed by: BHHS RW Towne Realty $349,990Pending3 beds 2 baths1,343 sq. ft.
334 Medley Lane, Suffolk, VA 23435
MLS# 10618390Listed by: BHHS RW Towne Realty $529,990Pending5 beds 4 baths2,199 sq. ft.
5214 Corolla Drive, Suffolk, VA 23435
MLS# 10618393Listed by: D R Horton Realty of Virginia $569,000Active5 beds 4 baths3,000 sq. ft.
2306 Juniper Lane, Suffolk, VA 23435
MLS# 10618405Listed by: Holloway Experience Real Est. $399,900Active3 beds 3 baths2,310 sq. ft.
1020 Silver Charm Circle, Suffolk, VA 23435
MLS# 10618331Listed by: Prodigy Realty $376,870Pending3 beds 2 baths1,343 sq. ft.
336 Medley Lane, Suffolk, VA 23435
MLS# 10618239Listed by: BHHS RW Towne Realty $733,900Active4 beds 4 baths2,936 sq. ft.
6026 Sam Callis Circle, Suffolk, VA 23435
MLS# 10618257Listed by: BHHS RW Towne Realty $629,900Active5 beds 3 baths2,900 sq. ft.
112 Sea Biscuit Run, Suffolk, VA 23435
MLS# 10618142Listed by: BHHS RW Towne Realty $583,490Active5 beds 3 baths2,511 sq. ft.
1125 Erin Drive, Suffolk, VA 23435
MLS# 10618195Listed by: D R Horton Realty of Virginia $388,215Pending3 beds 2 baths1,343 sq. ft.
420 Braden Lane, Suffolk, VA 23435
MLS# 10617884Listed by: BHHS RW Towne Realty $376,870Pending3 beds 2 baths1,343 sq. ft.
414 Braden Lane, Suffolk, VA 23435
MLS# 10617894Listed by: BHHS RW Towne Realty $394,177Pending3 beds 2 baths1,527 sq. ft.
212 Joy Lane, Suffolk, VA 23435
MLS# 10618066Listed by: BHHS RW Towne Realty $500,000Pending3 beds 3 baths2,841 sq. ft.
204 Bennetts Grove Lane, Suffolk, VA 23435
MLS# 10618076Listed by: Howard Hanna Real Estate Svcs. $559,990Pending5 beds 3 baths2,511 sq. ft.
1128 Erin Drive, Suffolk, VA 23435
MLS# 10618044Listed by: D R Horton Realty of Virginia $566,990Active4 beds 3 baths2,804 sq. ft.
1127 Erin Drive, Suffolk, VA 23435
MLS# 10618053Listed by: D R Horton Realty of Virginia $550,000Pending5 beds 3 baths3,122 sq. ft.
202 Ferguson Place, Suffolk, VA 23435
MLS# 10617842Listed by: Atlantic Sothebys Int'l Realty $719,265Active4 beds 4 baths3,138 sq. ft.
6033 Sam Callis Circle, Suffolk, VA 23435
MLS# 10617859Listed by: BHHS RW Towne Realty $250,000Active2 beds 3 baths1,154 sq. ft.
708 Lakeside Drive, Suffolk, VA 23435
MLS# 10617639Listed by: Real Broker LLC $556,600Pending5 beds 3 baths2,486 sq. ft.
4015 Sleepy Hole Road, Suffolk, VA 23435
MLS# 2601265Listed by: THE HOGAN GROUP REAL ESTATE $387,855Pending3 beds 2 baths1,343 sq. ft.
332 Medley Lane, Suffolk, VA 23435
MLS# 10617574Listed by: BHHS RW Towne Realty $363,645Pending3 beds 3 baths1,530 sq. ft.
1008 Serene Road #103, Suffolk, VA 23435
MLS# 10617582Listed by: BHHS RW Towne Realty $368,385Pending3 beds 3 baths1,530 sq. ft.
1011 Serene Road #100, Suffolk, VA 23435
MLS# 10617433Listed by: BHHS RW Towne Realty $475,000Pending4 beds 4 baths2,400 sq. ft.
202 Baron Boulevard, Suffolk, VA 23435
MLS# 10617438Listed by: RE/MAX Alliance $40,000Active0.39 Acres
0.39Ac Griffin Land, Suffolk, VA 23435
MLS# 10617118Listed by: Keller Williams Realty Twn Ctr $649,900Active5 beds 4 baths3,100 sq. ft.
Lot 1 Nansemond Parkway, Suffolk, VA 23435
MLS# 10617189Listed by: Garrett Realty Partners $998,750Active5 beds 3 baths3,240 sq. ft.
3426 Raintree Circle, Suffolk, VA 23435
MLS# 10617259Listed by: East West Realty-Hampton Roads $797,317Pending5 beds 5 baths3,938 sq. ft.
127 Margolies Court, Suffolk, VA 23435
MLS# 10617086Listed by: Today Homes Realty LLC $575,000Pending3 beds 2 baths1,450 sq. ft.
4798 Afton Court, Suffolk, VA 23435
MLS# 10616886Listed by: Cottage Street Realty LLC $527,955Pending4 beds 3 baths2,066 sq. ft.
1021 Bennett's Arch, Suffolk, VA 23435
MLS# 10617034Listed by: The Property Shoppe $1,550,000Active5 beds 6 baths6,560 sq. ft.
121 Windy Point Drive, Suffolk, VA 23435
MLS# 10616955Listed by: Realty Source $374,990Active3 beds 2 baths1,527 sq. ft.
MM Rollingbrook Villas (caicos 3), Suffolk, VA 23435
MLS# 10616285Listed by: BHHS RW Towne Realty $372,465Pending3 beds 2 baths1,343 sq. ft.
330 Medley Lane, Suffolk, VA 23435
MLS# 10616720Listed by: BHHS RW Towne Realty $629,000Pending4 beds 3 baths2,619 sq. ft.
307 Rhapsody Drive, Suffolk, VA 23435
MLS# 10616774Listed by: Today Homes Realty LLC $547,000Active3 beds 3 baths2,758 sq. ft.
126 Creek Front Lane, Suffolk, VA 23435
MLS# 10616625Listed by: Howard Hanna Real Estate Svcs. $424,900Active4 beds 2 baths2,452 sq. ft.
5565 Bennetts Pasture Road, Suffolk, VA 23435
MLS# 10616639Listed by: Keller Williams Realty Twn Ctr $50,000Pending3 beds 2 baths1,052 sq. ft.
6336 Old Townpoint Road, Suffolk, VA 23435
MLS# 10616591Listed by: Iron Valley Real Est Norfolk $425,255Active4 beds 4 baths2,071 sq. ft.
1005 Serene Road #103, Suffolk, VA 23435
MLS# 10616420Listed by: BHHS RW Towne Realty $431,829Pending3 beds 4 baths2,068 sq. ft.
1007 Serene Road #100, Suffolk, VA 23435
MLS# 10616553Listed by: BHHS RW Towne Realty $523,800Active4 beds 3 baths2,600 sq. ft.
1012 Bennetts Pasture Road, Suffolk, VA 23435
MLS# 10616481Listed by: CENTURY 21 Nachman Realty $319,000Active3 beds 3 baths1,646 sq. ft.
3762 Pear Orchard Way, Suffolk, VA 23435
MLS# 10616095Listed by: Better Homes & Gdns Ntv Am Grp $604,740Active5 beds 3 baths2,511 sq. ft.
5134 Duxbury Road, Suffolk, VA 23435
MLS# 10616450Listed by: D R Horton Realty of Virginia $378,999Active4 beds 3 baths1,541 sq. ft.
5018 Huntclub Chase, Suffolk, VA 23435
MLS# 10615713Listed by: BHHS RW Towne Realty $475,000Active4 beds 3 baths2,210 sq. ft.
6078 Mainsail Lane, Suffolk, VA 23435
MLS# 10616370Listed by: Signature Homes- Open Sat, 10am to 6pm
 $624,740Active5 beds 4 baths3,224 sq. ft.
5136 Duxbury Road, Suffolk, VA 23435
MLS# 10616202Listed by: D R Horton Realty of Virginia  $479,000Pending3 beds 3 baths2,758 sq. ft.
204 Thornwood Drive, Suffolk, VA 23435
MLS# 10616166Listed by: RE/MAX Connect $445,000Pending3 beds 3 baths2,424 sq. ft.
3004 Doncaster Drive, Suffolk, VA 23435
MLS# 10615941Listed by: MR Rivera Realty Group $878,900Pending5 beds 5 baths3,924 sq. ft.
120 Everclear Drive, Suffolk, VA 23435
MLS# 10616056Listed by: Today Homes Realty LLC $599,740Pending5 beds 3 baths2,511 sq. ft.
5138 Duxbury Road, Suffolk, VA 23435
MLS# 10615972Listed by: D R Horton Realty of Virginia $543,630Pending4 beds 3 baths2,150 sq. ft.
1027 Bennetts Arch, Suffolk, VA 23435
MLS# 10615825Listed by: The Property Shoppe $375,800Active3 beds 3 baths2,262 sq. ft.
3001 Hogan Way, Suffolk, VA 23435
MLS# 10615752Listed by: BHHS RW Towne Realty $488,500Active3 beds 3 baths2,613 sq. ft.
5407 Sports Club Run, Suffolk, VA 23435
MLS# 10615771Listed by: BHHS RW Towne Realty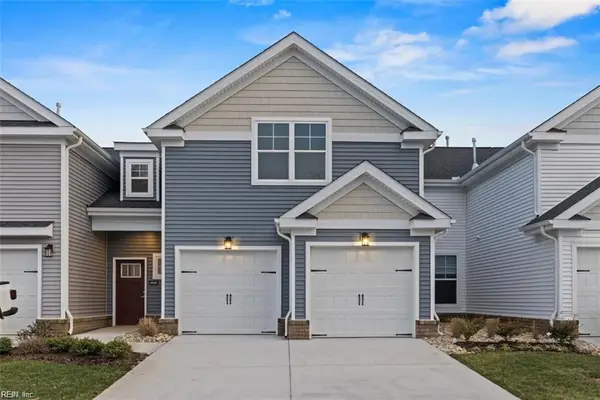 $515,000Active3 beds 3 baths2,859 sq. ft.
1204 Brianna (lot 32) Lane, Suffolk, VA 23435
MLS# 10615504Listed by: BHHS RW Towne Realty $649,740Pending5 beds 4 baths3,226 sq. ft.
5132 Duxbury Road, Suffolk, VA 23435
MLS# 10615670Listed by: D R Horton Realty of Virginia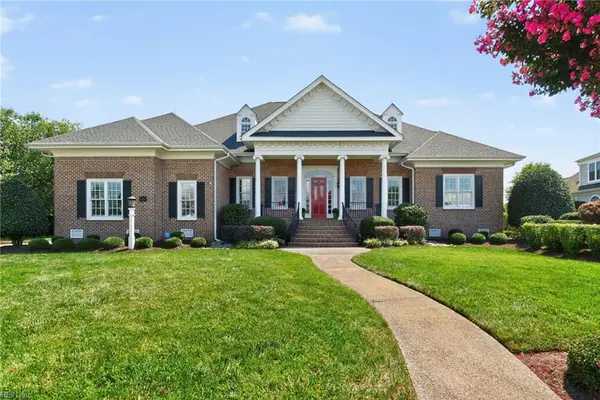 $1,199,000Active4 beds 4 baths3,954 sq. ft.
3434 Village Square Place, Suffolk, VA 23435
MLS# 10615425Listed by: The Real Estate Group $687,103Pending5 beds 4 baths3,369 sq. ft.
120 Margolies Court, Suffolk, VA 23435
MLS# 10615314Listed by: Today Homes Realty LLC $649,900Active4 beds 3 baths3,553 sq. ft.
3405 Dumpling Court, Suffolk, VA 23435
MLS# 10615199Listed by: RE/MAX Allegiance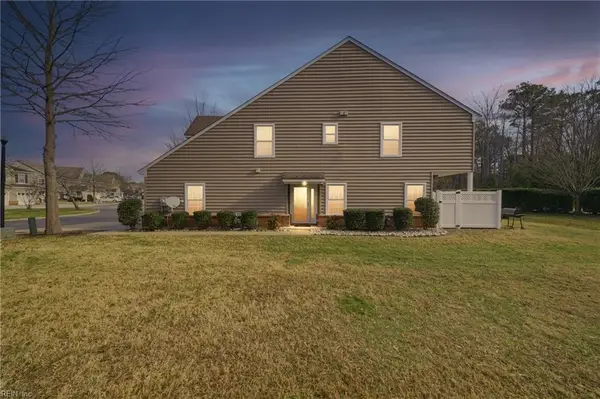 $320,000Active3 beds 3 baths1,726 sq. ft.
3770 Pear Orchard Way, Suffolk, VA 23435
MLS# 10614884Listed by: LPT Realty LLC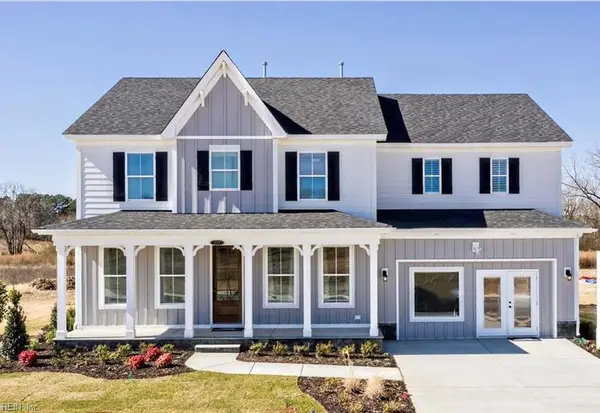 $614,900Active5 beds 4 baths3,309 sq. ft.
MM Roseleigh At River Club, Suffolk, VA 23435
MLS# 10614826Listed by: Today Homes Realty LLC $604,900Active5 beds 3 baths3,351 sq. ft.
MM Everest At River Club, Suffolk, VA 23435
MLS# 10614824Listed by: Today Homes Realty LLC $424,900Active4 beds 4 baths2,195 sq. ft.
1207 Worden Way, Suffolk, VA 23435
MLS# 10614815Listed by: BHHS RW Towne Realty $755,000Active5 beds 5 baths3,354 sq. ft.
6025 Sam Callis Circle, Suffolk, VA 23434
MLS# 10614550Listed by: BHHS RW Towne Realty $390,645Pending3 beds 3 baths1,702 sq. ft.
4301 Abercorn Drive #102, Suffolk, VA 23435
MLS# 10614467Listed by: BHHS RW Towne Realty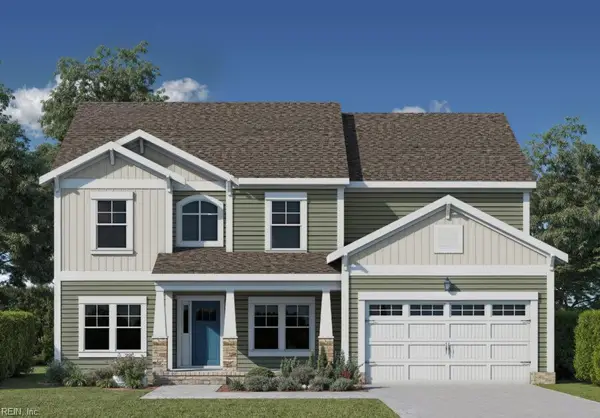 $641,015Pending4 beds 4 baths3,164 sq. ft.
6023 Sam Callis Circle, Suffolk, VA 23435
MLS# 10614510Listed by: BHHS RW Towne Realty $50,000Pending1.5 Acres
3600 Nansemond (block) Parkway, Suffolk, VA 23435
MLS# 10614499Listed by: Wainwright Real Estate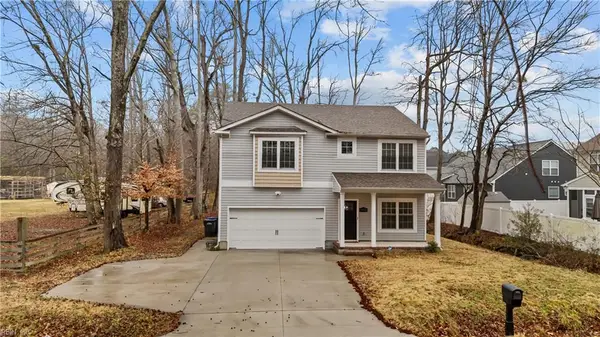 $459,999Active4 beds 3 baths2,220 sq. ft.
3972 Pughsville Road, Suffolk, VA 23435
MLS# 10620987Listed by: ONYX Realty Professionals LLC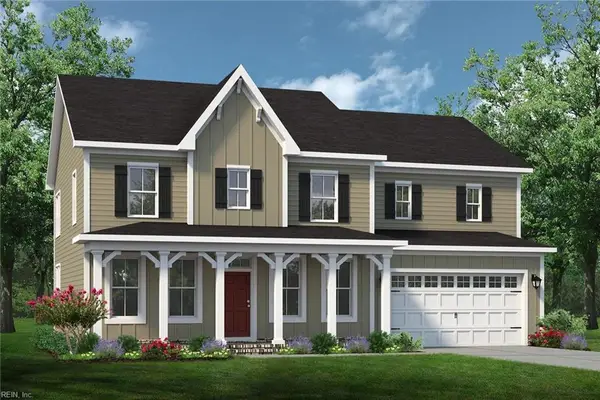 $671,454Pending5 beds 4 baths3,319 sq. ft.
126 Margolies Court, Suffolk, VA 23435
MLS# 10614188Listed by: Today Homes Realty LLC- Open Sat, 10am to 6pm
 $639,740Pending5 beds 4 baths3,224 sq. ft.
5128 Duxbury Road, Suffolk, VA 23435
MLS# 10614193Listed by: D R Horton Realty of Virginia 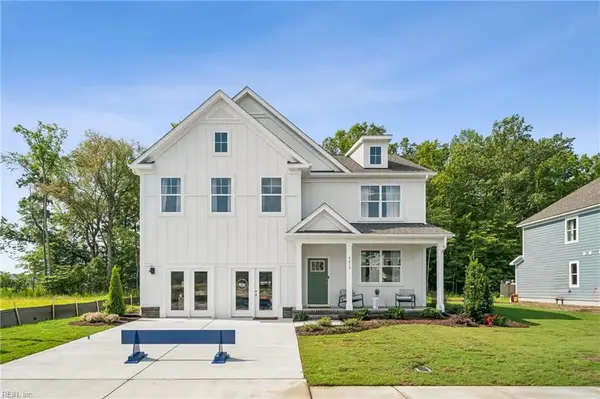 $614,740Active5 beds 3 baths2,511 sq. ft.
5130 Duxbury Road, Suffolk, VA 23435
MLS# 10614198Listed by: D R Horton Realty of Virginia $404,000Pending4 beds 3 baths2,171 sq. ft.
6404 Pelican Crescent, Suffolk, VA 23435
MLS# 10614137Listed by: Warrior Realty of Virginia LLC $380,025Pending3 beds 2 baths1,343 sq. ft.
408 Braden Lane, Suffolk, VA 23432
MLS# 10613803Listed by: BHHS RW Towne Realty $650,000Pending3 beds 3 baths3,196 sq. ft.
119 Beacon Run, Suffolk, VA 23435
MLS# 10613700Listed by: Prodigy Realty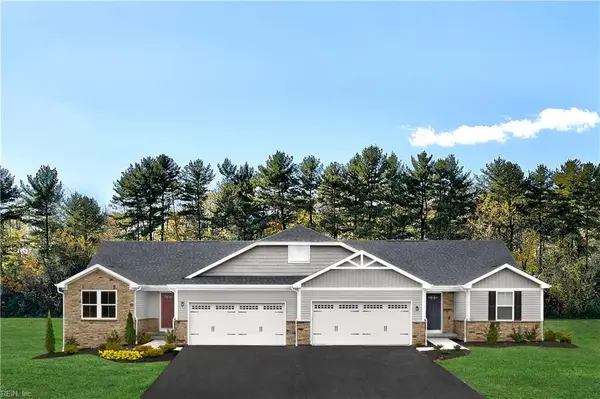 $379,730Pending3 beds 2 baths1,343 sq. ft.
424 Braden Lane, Suffolk, VA 23435
MLS# 10613716Listed by: BHHS RW Towne Realty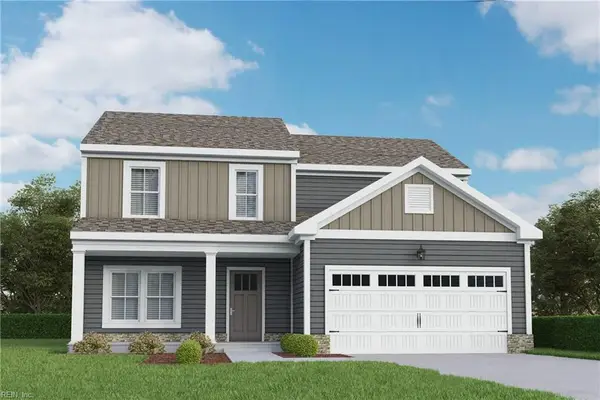 $536,450Pending4 beds 3 baths2,066 sq. ft.
1041 Bennett's Arch, Suffolk, VA 23435
MLS# 10613401Listed by: The Property Shoppe $379,417Pending2 beds 2 baths1,343 sq. ft.
410 Braden Lane, Suffolk, VA 23432
MLS# 10613214Listed by: BHHS RW Towne Realty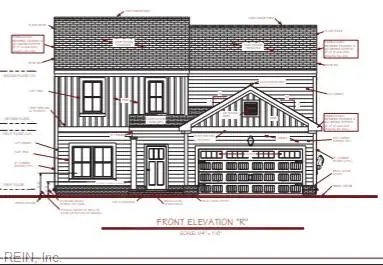 $518,680Pending5 beds 3 baths2,066 sq. ft.
1008 Bennett's Arch, Suffolk, VA 23435
MLS# 10613016Listed by: The Property Shoppe $515,000Active4 beds 3 baths2,832 sq. ft.
223 Creek Front Lane, Suffolk, VA 23435
MLS# 10612975Listed by: BHHS RW Towne Realty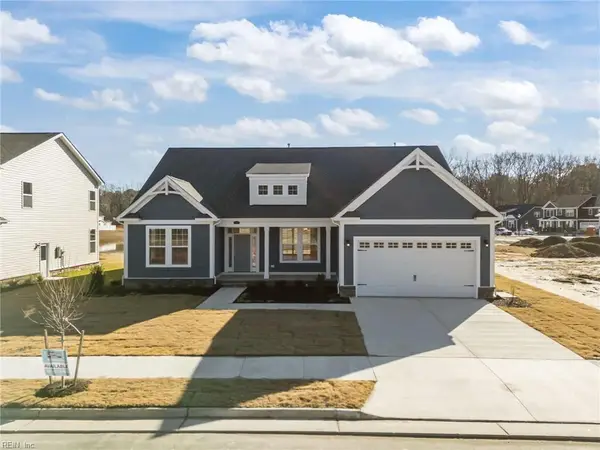 $759,900Active4 beds 3 baths3,368 sq. ft.
339 Rhapsody Drive, Suffolk, VA 23435
MLS# 10621370Listed by: Today Homes Realty LLC $619,833Active4 beds 4 baths2,526 sq. ft.
4424 Abercorn Drive, Suffolk, VA 23435
MLS# 10612618Listed by: The Property Shoppe- Open Sat, 11am to 1pm
 $589,900Active3 beds 3 baths3,289 sq. ft.
144 Creek Front Lane, Suffolk, VA 23435
MLS# 10612509Listed by: Howard Hanna Real Estate Svcs.  $389,650Pending3 beds 3 baths1,702 sq. ft.
1005 Serene Road #101, Suffolk, VA 23435
MLS# 10621521Listed by: BHHS RW Towne Realty $835,444Pending5 beds 5 baths4,122 sq. ft.
125 Margolies Court, Suffolk, VA 23435
MLS# 10612331Listed by: Today Homes Realty LLC $400,000Active3 beds 2 baths2,482 sq. ft.
3504 Bridge Road, Suffolk, VA 23435
MLS# 10612380Listed by: Swell Real Estate Co $830,241Pending5 beds 5 baths3,938 sq. ft.
209 Balfour Drive, Suffolk, VA 23435
MLS# 10611901Listed by: Today Homes Realty LLC $720,065Pending5 beds 5 baths3,162 sq. ft.
6022 Sam Callis Circle, Suffolk, VA 23434
MLS# 10611457Listed by: BHHS RW Towne Realty $404,765Active4 beds 4 baths1,808 sq. ft.
1005 Serene Road #102, Suffolk, VA 23435
MLS# 10611656Listed by: BHHS RW Towne Realty $343,250Pending3 beds 3 baths1,308 sq. ft.
1011 Serene Road #103, Suffolk, VA 23435
MLS# 10611485Listed by: BHHS RW Towne Realty $606,740Active4 beds 4 baths2,806 sq. ft.
4412 Abercorn Drive, Suffolk, VA 23435
MLS# 10611577Listed by: BHHS RW Towne Realty $397,900Active4 beds 4 baths2,023 sq. ft.
2001 Laycock Lane #102, Suffolk, VA 23435
MLS# 10610688Listed by: The Bowen Group $409,560Pending3 beds 2 baths1,503 sq. ft.
329 Medley Lane, Suffolk, VA 23432
MLS# 10611116Listed by: BHHS RW Towne Realty $387,650Pending3 beds 2 baths1,503 sq. ft.
400 Braden Lane, Suffolk, VA 23432
MLS# 10608733Listed by: BHHS RW Towne Realty $387,805Pending3 beds 2 baths1,343 sq. ft.
402 Braden Lane, Suffolk, VA 23432
MLS# 10610865Listed by: BHHS RW Towne Realty $397,865Pending3 beds 2 baths1,343 sq. ft.
422 Braden Lane, Suffolk, VA 23432
MLS# 10610868Listed by: BHHS RW Towne Realty $395,000Active3 beds 3 baths1,743 sq. ft.
1211 Worden Way, Suffolk, VA 23435
MLS# 10625293Listed by: Keller Williams Capital Props. $571,240Pending4 beds 4 baths2,312 sq. ft.
5218 Corolla Drive, Suffolk, VA 23435
MLS# 10625640Listed by: D R Horton Realty of Virginia $375,000Active3 beds 3 baths1,723 sq. ft.
6309 Freeman Avenue, Suffolk, VA 23435
MLS# 10610535Listed by: Atlantic Sothebys Int'l Realty $460,000Active4 beds 3 baths2,315 sq. ft.
206 Ivystone Reach, Suffolk, VA 23435
MLS# 10609749Listed by: Haven Hampton Roads Realty $359,990Pending2 beds 2 baths1,343 sq. ft.
406 Braden Lane, Suffolk, VA 23432
MLS# 10609958Listed by: BHHS RW Towne Realty $379,990Pending3 beds 2 baths1,527 sq. ft.
107 Kini Lane, Suffolk, VA 23432
MLS# 10609959Listed by: BHHS RW Towne Realty $387,315Pending3 beds 2 baths1,343 sq. ft.
326 Medley Lane, Suffolk, VA 23432
MLS# 10609990Listed by: BHHS RW Towne Realty $393,060Pending3 beds 2 baths1,343 sq. ft.
426 Braden Lane, Suffolk, VA 23432
MLS# 10609989Listed by: BHHS RW Towne Realty $508,295Pending3 beds 3 baths1,965 sq. ft.
1039 Bennett's Arch, Suffolk, VA 23435
MLS# 10610034Listed by: The Property Shoppe $548,490Pending4 beds 3 baths2,804 sq. ft.
1123 Erin Drive, Suffolk, VA 23435
MLS# 10610362Listed by: D R Horton Realty of Virginia $298,000Active2 beds 2 baths1,359 sq. ft.
1804 Union Pacific Way, Suffolk, VA 23435
MLS# 10610202Listed by: Liz Moore & Associates LLC $394,350Active3 beds 4 baths2,068 sq. ft.
1005 Opal Street #105, Suffolk, VA 23435
MLS# 10610278Listed by: Long & Foster Real Estate Inc. $571,826Active3 beds 3 baths2,880 sq. ft.
2069 Asher (lot 10) Drive, Suffolk, VA 23435
MLS# 10609622Listed by: BHHS RW Towne Realty $360,340Pending2 beds 2 baths1,343 sq. ft.
404 Braden Lane, Suffolk, VA 23432
MLS# 10609141Listed by: BHHS RW Towne Realty $368,990Pending3 beds 2 baths1,343 sq. ft.
328 Medley Lane, Suffolk, VA 23435
MLS# 10618381Listed by: BHHS RW Towne Realty $416,250Pending3 beds 2 baths1,503 sq. ft.
113 Kini Street, Suffolk, VA 23432
MLS# 10608592Listed by: BHHS RW Towne Realty $412,320Pending3 beds 2 baths1,503 sq. ft.
331 Medley Lane, Suffolk, VA 23432
MLS# 10608594Listed by: BHHS RW Towne Realty $376,380Pending2 beds 2 baths1,503 sq. ft.
115 Kini Street, Suffolk, VA 23432
MLS# 10607882Listed by: BHHS RW Towne Realty $806,965Pending5 beds 5 baths3,924 sq. ft.
123 Everclear Drive, Suffolk, VA 23435
MLS# 10607825Listed by: Today Homes Realty LLC $384,990Pending3 beds 2 baths1,527 sq. ft.
103 Kini Lane, Suffolk, VA 23435
MLS# 10618382Listed by: BHHS RW Towne Realty $714,900Pending4 beds 4 baths3,031 sq. ft.
4010 Evan Circle, Suffolk, VA 23435
MLS# 10607025Listed by: Howard Hanna Real Estate Svcs. $355,000Pending3 beds 3 baths2,272 sq. ft.
2062 Nicklaus Drive, Suffolk, VA 23435
MLS# 10606823Listed by: BHHS RW Towne Realty $564,615Pending4 beds 3 baths2,150 sq. ft.
4427 Abercorn Drive, Suffolk, VA 23435
MLS# 10606479Listed by: The Property Shoppe $533,210Pending3 beds 3 baths2,066 sq. ft.
4423 Abercorn Drive, Suffolk, VA 23435
MLS# 10606491Listed by: The Property Shoppe $345,000Active3 beds 3 baths2,272 sq. ft.
2064 Nicklaus Drive, Suffolk, VA 23435
MLS# 10606458Listed by: First Providence Realty Inc $330,378Pending3 beds 3 baths1,582 sq. ft.
1008 Ashworth Way, Suffolk, VA 23435
MLS# 10606025Listed by: Pointe East Realty LLC $387,678Pending2 beds 2 baths1,489 sq. ft.
1018 Ashworth Way, Suffolk, VA 23435
MLS# 10606030Listed by: Pointe East Realty LLC $785,100Pending5 beds 3 baths3,368 sq. ft.
121 Everclear Drive, Suffolk, VA 23435
MLS# 10605417Listed by: Today Homes Realty LLC $629,900Pending4 beds 3 baths2,619 sq. ft.
331 Rhapsody Drive, Suffolk, VA 23435
MLS# 10620270Listed by: Today Homes Realty LLC
Local realty services provided by:CENTURY 21 Realty @ Home, CENTURY 21 Nachman Realty
The listings data displayed on this medium comes in part from the Real Estate Information Network Inc. (REIN) and has been authorized by participating listing Broker Members of REIN for display. REIN's listings are based upon Data submitted by its Broker Members, and REIN therefore makes no representation or warranty regarding the accuracy of the Data. All users of REIN's listings database should confirm the accuracy of the listing information directly with the listing agent. 2026 REIN. REIN's listings Data and information is protected under federal copyright laws. Federal law prohibits, among other acts, the unauthorized copying or alteration of, or preparation of derivative works from, all or any part of copyrighted materials, including certain compilations of Data and information. COPYRIGHT VIOLATORS MAY BE SUBJECT TO SEVERE FINES AND PENALTIES UNDER FEDERAL LAW. REIN updates its listings on a daily basis. Data last updated: March 19, 2026 This application does not include information on all of the properties available for sale at this time.
Some listings may be duplicated in the search results due to the co-mingling of listings from more than one multiple listing service. Should there be different listing information between the duplicated listings; user is advised to verify the accuracy of the listing information before making any financial decisions.
2026 REIN, Inc. Information Deemed Reliable But Not Guaranteed.
Popular searches near 23435
Popular neighborhoods near 23435
- Aberdeen, Hampton homes for sale
- Camelot, Chesapeake homes for sale
- Chestnut, Newport News homes for sale
- Downtown, Portsmouth homes for sale
- Greater Wythe, Hampton homes for sale
- Hilton Village, Newport News homes for sale
- Huntington, Newport News homes for sale
- Jefferson Park, Newport News homes for sale
- Marshall, Newport News homes for sale
- New Market, Newport News homes for sale
- Newsome, Newport News homes for sale
- North Newport News, Newport News homes for sale
- Olde Towne, Portsmouth homes for sale
- Salters Creek, Newport News homes for sale
- South Norfolk, Chesapeake homes for sale
- Stuart Gardens, Newport News homes for sale
- Uptown, Portsmouth homes for sale
- Western Branch, Chesapeake homes for sale
- Wickham, Newport News homes for sale
- Wythe, Hampton homes for sale
Counties near Suffolk, 23435
- Chesapeake city County homes for sale
- Franklin city County homes for sale
- Gates County homes for sale
- Gloucester County homes for sale
- Hampton city County homes for sale
- Isle of Wight County homes for sale
- James City County homes for sale
- Mathews County homes for sale
- Newport News city County homes for sale
- Norfolk city County homes for sale
- Northampton County homes for sale
- Pasquotank County homes for sale
- Poquoson city County homes for sale
- Portsmouth city County homes for sale
- Southampton County homes for sale
- Suffolk city County homes for sale
- Surry County homes for sale
- Virginia Beach city County homes for sale
- Williamsburg city County homes for sale
- York County homes for sale
Protect your home and budget from life's surprises with an Assurant Home Warranty, backed by a partner that supports you through every step of homeownership. Explore Plans.
©2026 Century 21 Real Estate LLC. All rights reserved. CENTURY 21®, the CENTURY 21 Logo and C21® are service marks owned by Century 21 Real Estate LLC. Century 21 Real Estate LLC fully supports the principles of the Fair Housing Act and the Equal Opportunity Act. Each office is independently owned and operated. Listing information is deemed reliable but not guaranteed accurate.