- Arrowcreek, Reno homes for sale
- Caughlin Ranch, Reno homes for sale
- Damonte Ranch, Reno homes for sale
- Donner Summit, Soda Springs homes for sale
- Fieldcreek Ranch, Reno homes for sale
- Galena, Reno homes for sale
- Galena Forest, Reno homes for sale
- Lake Tahoe, 961Hw homes for sale
- Lakeridge, Reno homes for sale
- Montreux, Reno homes for sale
- Mortensen, Reno homes for sale
- North Lake Tahoe, 961Hw homes for sale
- Rancharrah, Reno homes for sale
- Saddlehorn, Reno homes for sale
- St. James Village, Reno homes for sale
- South Meadows, Reno homes for sale
- Southeast, Reno homes for sale
- Southwest Reno, Reno homes for sale
- Tahoe Donner, Truckee homes for sale
- West Washoe Valley, Washoe Valley homes for sale
Tahoma, CA - homes for sale
4 of 4 results displayed
- New
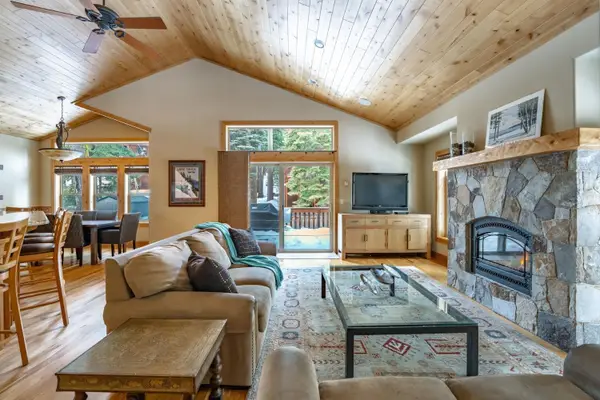 $1,325,000Active3 beds 3 baths2,281 sq. ft.
7282 9th Avenue, Tahoma, CA 96142
MLS# 226082571Listed by: SIERRA SOTHEBY'S INTERNATIONAL REALTY 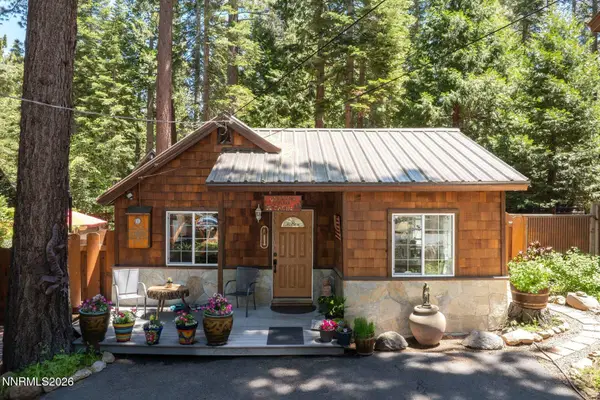 $605,000Active2 beds 1 baths862 sq. ft.
315 Placer Street, Tahoma, CA 96142
MLS# 260007546Listed by: SIERRA SOTHEBYS INTL. REALTY $1,200,000Pending3 beds 3 baths1,501 sq. ft.
360 Grouse Dr, Homewood, CA 96141
MLS# 41135130Listed by: SYNERGI PROPERTIES- Open Sat, 1 to 3pm
 $699,999Active3 beds 1 baths930 sq. ft.
7213 3rd Avenue, Tahoma, CA 96142
MLS# 226052642Listed by: COLDWELL BANKER REALTY
Local realty services provided by:CENTURY 21 Select Real Estate, Inc., CENTURY 21 Sonoma Realty, CENTURY 21 Masters
MetroList MLS 2026. This information is being provided by MetroList MLS. All measurements and calculations of area are approximate. Information provided by Seller/Other sources, not verified by Broker. All interested persons should independently verify accuracy of information. Provided properties may or may not be listed by the office/agent presenting the information. Data Updated: July 9, 2026. Information being provided is for consumers' personal, non-commercial use and may not be used for any purpose other than to identify prospective properties consumers may be interested in purchasing. Information deemed reliable but not guaranteed. Any offer of compensation is made only to Participants of MLS where the subject listing is filed and in accordance with such MLS's regulations or rules. MFMLS Member Broker: Mike Southwick
The information being provided by California Regional MLS (Southern California) is for the consumer's personal, non-commercial use and may not be used for any purpose other than to identify prospective properties consumer may be interested in purchasing. Any information relating to real estate for sale referenced on this web site comes from the Internet Data Exchange (IDX) program of the California Regional MLS (Southern California). CENTURY 21 Masters is not a Multiple Listing Service (MLS), nor does it offer MLS access. This website is a service of CENTURY 21 Masters, a broker participant of California Regional MLS (Southern California). This web site may reference real estate listing(s) held by a brokerage firm other than the broker and/or agent who owns this web site.
The accuracy of all information, regardless of source, including but not limited to open house information, square footages and lot sizes, is deemed reliable but not guaranteed and should be personally verified through personal inspection by and/or with the appropriate professionals. The data contained herein is copyrighted by California Regional MLS (Southern California) and is protected by all applicable copyright laws. Any unauthorized dissemination of this information is in violation of copyright laws and is strictly prohibited.
Copyright 2021 California Regional MLS (Southern California). All rights reserved. CRMLS Member Broker: Randy Keith Thompson
Neighborhoods near Tahoma, CA
Zip codes near Tahoma, CA
- 89402 homes for sale
- 89411 homes for sale
- 89413 homes for sale
- 89423 homes for sale
- 89448 homes for sale
- 89449 homes for sale
- 89451 homes for sale
- 89460 homes for sale
- 89703 homes for sale
- 89704 homes for sale
- 89705 homes for sale
- 95720 homes for sale
- 95721 homes for sale
- 95735 homes for sale
- 96142 homes for sale
- 96143 homes for sale
- 96146 homes for sale
- 96148 homes for sale
- 96150 homes for sale
- 96161 homes for sale
Popular searches near Tahoma, CA
- 897HW homes for sale
- Crystal Bay homes for sale
- Echo Lake homes for sale
- Genoa homes for sale
- Genoa-Jacks Valley homes for sale
- Glenbrook homes for sale
- Incline Village homes for sale
- Kings Beach homes for sale
- Kingsbury homes for sale
- Kyburz homes for sale
- Lake Tahoe homes for sale
- Lakeridge homes for sale
- Olympic Valley homes for sale
- Round Hill Village homes for sale
- South Lake Tahoe homes for sale
- Stateline homes for sale
- Tahoe Vista homes for sale
- Truckee homes for sale
- Twin Bridges homes for sale
- Zephyr Cove homes for sale
Protect your home and budget from life's surprises with an Assurant Home Warranty, backed by a partner that supports you through every step of homeownership. Explore Plans.
©2026 Century 21 Real Estate LLC. All rights reserved. CENTURY 21®, the CENTURY 21 Logo and C21® are service marks owned by Century 21 Real Estate LLC. Century 21 Real Estate LLC fully supports the principles of the Fair Housing Act and the Equal Opportunity Act. Each office is independently owned and operated. Listing information is deemed reliable but not guaranteed accurate.