- Bedford Walk, Columbia homes for sale
- Cedar Lake, Columbia homes for sale
- Douglass Park, Columbia homes for sale
- Grindstone, Columbia homes for sale
- Katy Lake Estates, Columbia homes for sale
- King's Meadow, Columbia homes for sale
- Lake Woodrail, Columbia homes for sale
- Mill Creek Manor, Columbia homes for sale
- North Central, Columbia homes for sale
- Park DeVille, Columbia homes for sale
- Parkdale, Columbia homes for sale
- Ridgeway, Columbia homes for sale
- Rothwell Heights, Columbia homes for sale
- Smithton Ridge, Columbia homes for sale
- Southwest Hills, Columbia homes for sale
- Sunset Hill, Columbia homes for sale
- The Highlands, Columbia homes for sale
- Thornbrook, Columbia homes for sale
- University Park, Columbia homes for sale
- Valley View Gardens, Columbia homes for sale
Tipton, MO - homes for sale
4 of 4 results displayed
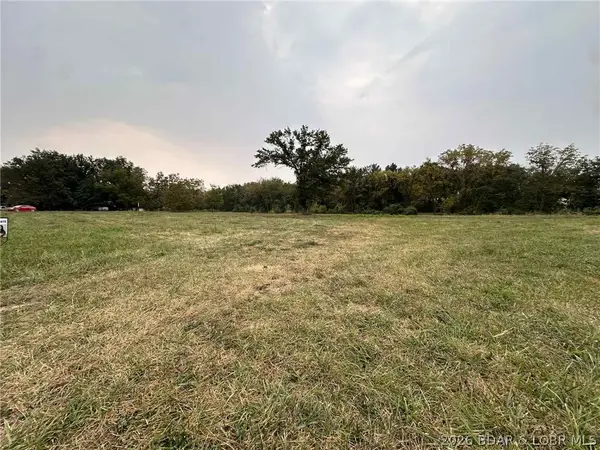 $99,000Active2.42 Acres
Wade Boulevard, Tipton, MO 65081
MLS# 3586172Listed by: EXP REALTY LLC (LOBR)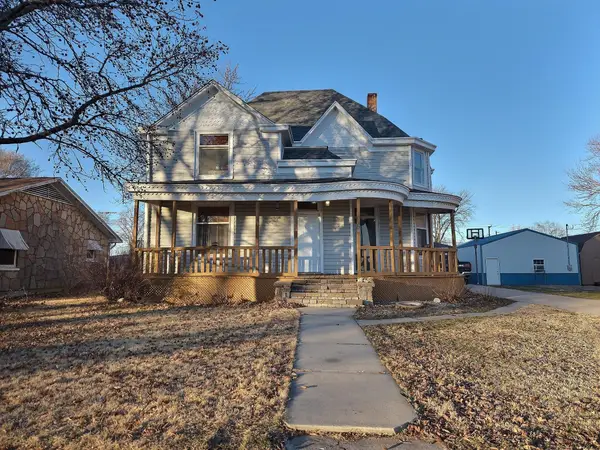 $150,000Active6 beds 3 baths2,606 sq. ft.
123 E Cooper St, TIPTON, MO 65081
MLS# 431674Listed by: EXP REALTY LLC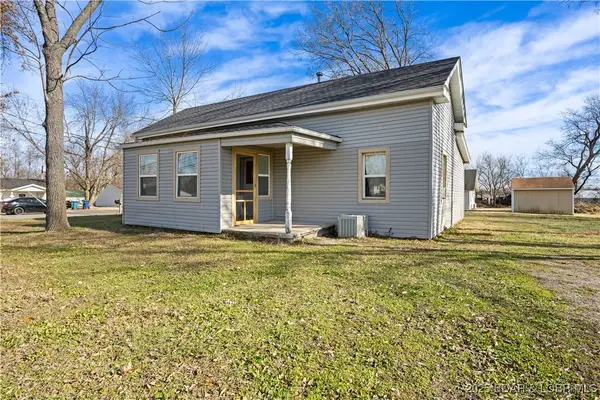 $110,000Active2 beds 1 baths1,064 sq. ft.
230 N Moreau Avenue, Tipton, MO 65081
MLS# 3582879Listed by: OZARK REALTY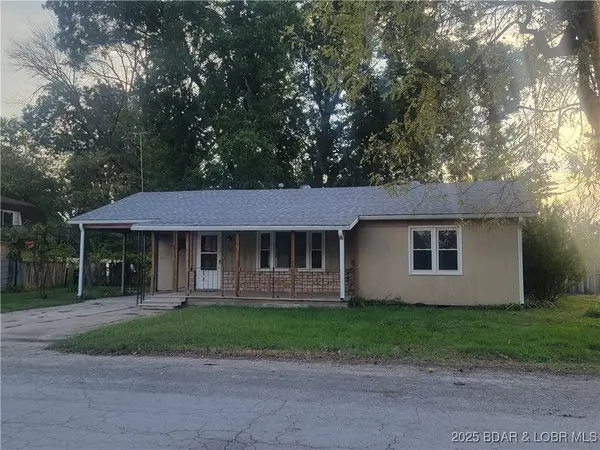 $139,900Active3 beds 1 baths1,044 sq. ft.
310 Miller Avenue, Tipton, MO 65081
MLS# 3580937Listed by: EXP REALTY LLC (LOBR)
Local realty services provided by:CENTURY 21 Community, CENTURY 21 McDaniel Realty
Neighborhoods near Tipton, MO
Zip codes near Tipton, MO
- 65011 homes for sale
- 65018 homes for sale
- 65026 homes for sale
- 65037 homes for sale
- 65039 homes for sale
- 65064 homes for sale
- 65072 homes for sale
- 65074 homes for sale
- 65078 homes for sale
- 65081 homes for sale
- 65084 homes for sale
- 65203 homes for sale
- 65233 homes for sale
- 65274 homes for sale
- 65279 homes for sale
- 65287 homes for sale
- 65301 homes for sale
- 65325 homes for sale
- 65329 homes for sale
- 65347 homes for sale
Popular searches near Tipton, MO
- Barnett homes for sale
- Boonville homes for sale
- Boonville Township homes for sale
- California homes for sale
- Eldon homes for sale
- Gravois Mills homes for sale
- Haw Creek homes for sale
- Mill Creek homes for sale
- Moreau homes for sale
- Moreau homes for sale
- Olean homes for sale
- Saline homes for sale
- Sedalia township homes for sale
- Sedalia homes for sale
- Stover homes for sale
- Versailles homes for sale
- Walker homes for sale
- Willow Fork homes for sale
- Windsor Place homes for sale
- Wooldridge homes for sale
Protect your home and budget from life's surprises with an Assurant Home Warranty, backed by a partner that supports you through every step of homeownership. Explore Plans.
©2026 Century 21 Real Estate LLC. All rights reserved. CENTURY 21®, the CENTURY 21 Logo and C21® are service marks owned by Century 21 Real Estate LLC. Century 21 Real Estate LLC fully supports the principles of the Fair Housing Act and the Equal Opportunity Act. Each office is independently owned and operated. Listing information is deemed reliable but not guaranteed accurate.