- Arleta homes for sale
- Encino homes for sale
- Granada Hills homes for sale
- Lake Balboa homes for sale
- Mission Hills homes for sale
- North Hills homes for sale
- North Hollywood homes for sale
- Northridge homes for sale
- Pacoima homes for sale
- Panorama City homes for sale
- Reseda homes for sale
- San Fernando Valley homes for sale
- Sherman Oaks homes for sale
- Studio City homes for sale
- Tarzana homes for sale
- Valley Glen homes for sale
- Valley Village homes for sale
- Van Nuys homes for sale
- Winnetka homes for sale
- Woodland Hills homes for sale
91406, CA - homes for sale
133 of 133 results displayed
- New
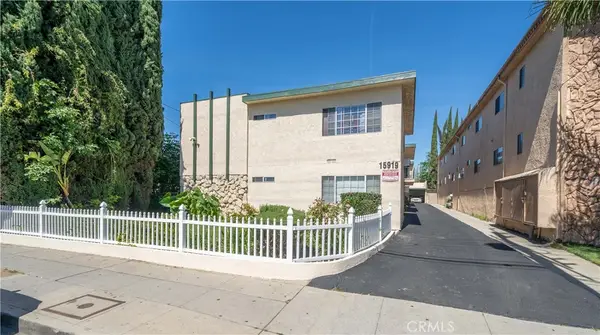 $1,850,000Active-- beds -- baths6,450 sq. ft.
15919 Vanowen Street, Van Nuys, CA 91406
MLS# SR26064384Listed by: EQUITY UNION - Open Sun, 2 to 5pmNew
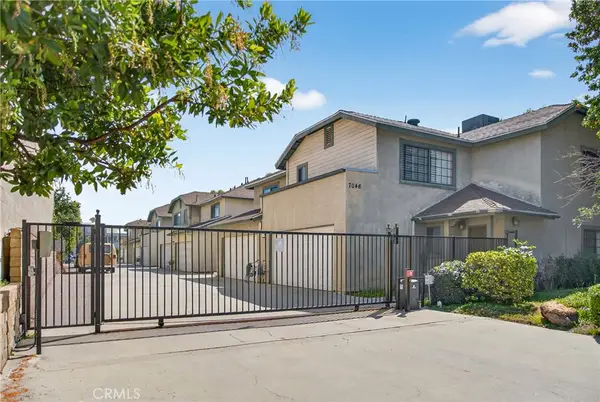 $575,000Active2 beds 3 baths1,230 sq. ft.
7046 De Celis Place #7, Lake Balboa, CA 91406
MLS# SR26065288Listed by: RODEO REALTY - New
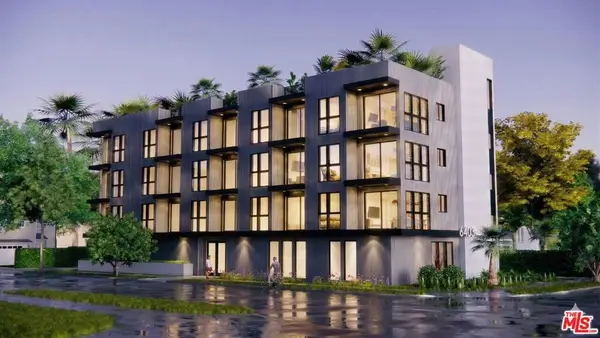
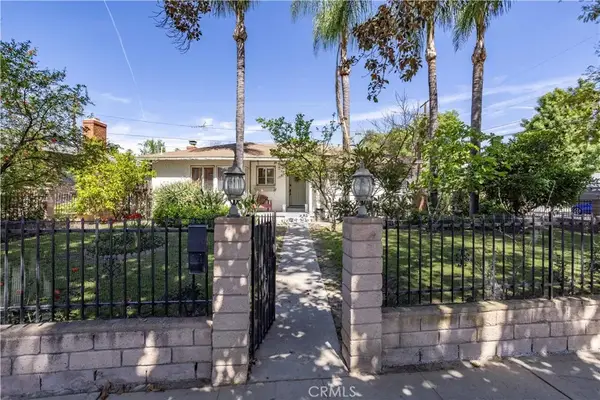 $975,000Active3 beds 2 baths1,384 sq. ft.
17101 Gault, Lake Balboa, CA 91406
MLS# SR26063888Listed by: PARK REGENCY REALTY - Open Sat, 1 to 4pmNew
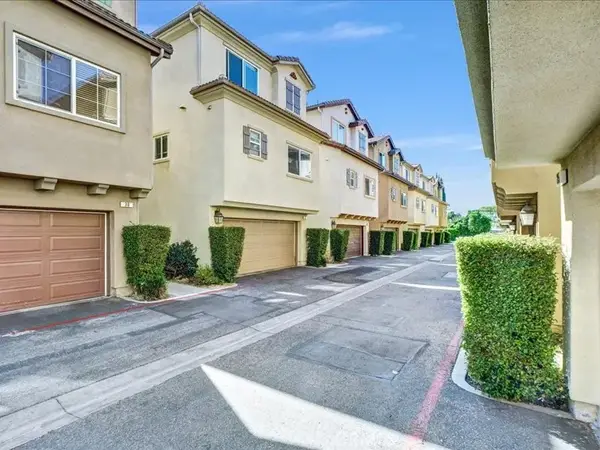
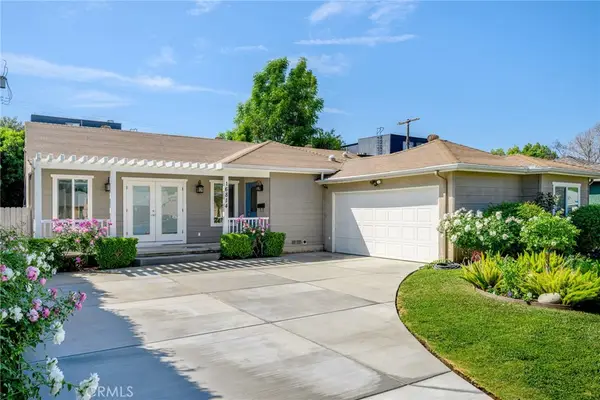 $899,000Active3 beds 2 baths1,562 sq. ft.
16814 Hartland, Lake Balboa, CA 91406
MLS# SR26059331Listed by: COLDWELL BANKER REALTY - Open Sat, 1 to 4pmNew
 $1,275,000Active3 beds 3 baths1,873 sq. ft.
7530 Gaviota Avenue, Van Nuys, CA 91406
MLS# 226001341Listed by: ALTERA REAL ESTATE SERVICES - New
 $569,000Active2 beds 3 baths1,580 sq. ft.
7100 Balboa Boulevard #1003, Lake Balboa, CA 91406
MLS# BB26003314Listed by: REAL BROKERAGE TECHNOLOGIES - Open Sat, 1 to 4pmNew
 $899,000Active3 beds 2 baths1,410 sq. ft.
16125 Haynes Street, Van Nuys, CA 91406
MLS# PW26060330Listed by: WEDGEWOOD HOMES REALTY  $1,500,000Pending6 beds 6 baths
6424 Densmore, Van Nuys, CA 91406
MLS# SR26026898Listed by: RE/MAX ONE $845,000Pending3 beds 2 baths1,609 sq. ft.
6446 Mclennan, Van Nuys, CA 91406
MLS# SR26059813Listed by: DUGGAN PROPERTY MANAGEMENT, INC.- New
 $897,000Active3 beds 2 baths1,400 sq. ft.
7822 Peach Avenue, Van Nuys (los Angeles), CA 91406
MLS# CL26665855Listed by: THE AGENCY - New
 $775,000Active2 beds 2 baths926 sq. ft.
16937 Hartland, Lake Balboa, CA 91406
MLS# GD26059408Listed by: LPT REALTY - Open Sun, 2 to 4pmNew
 $569,000Active2 beds 3 baths1,580 sq. ft.
7100 Balboa Boulevard #1003, Lake Balboa, CA 91406
MLS# BB26003314Listed by: REAL BROKERAGE TECHNOLOGIES - Open Sun, 1 to 4pmNew
 $945,000Active4 beds 2 baths1,507 sq. ft.
17008 Hartland St, Lake Balboa, CA 91406
MLS# SR26059103Listed by: KELLER WILLIAMS VIP PROPERTIES - Open Sun, 1 to 4pmNew
 $849,000Active3 beds 2 baths1,226 sq. ft.
6524 Forbes, Lake Balboa, CA 91406
MLS# SR26059853Listed by: EQUITY UNION - New
 $999,000Active3 beds 2 baths1,420 sq. ft.
16421 Haynes Street, Lake Balboa, CA 91406
MLS# 226001183Listed by: COMPASS - Open Sat, 12 to 3pmNew
 $799,500Active3 beds 2 baths1,454 sq. ft.
7701 Orion Avenue, Van Nuys, CA 91406
MLS# SR26009067Listed by: PARK REGENCY REALTY  $689,000Pending2 beds 1 baths1,345 sq. ft.
6553 Odessa Avenue, Los Angeles, CA 91406
MLS# BB26053637Listed by: EQUITY UNION- New
 $1,900,000Active6 beds 7 baths
7909 Aldea Avenue, Lake Balboa, CA 91406
MLS# SR26057806Listed by: KELLER WILLIAMS LUXURY - Open Sat, 2 to 5pmNew
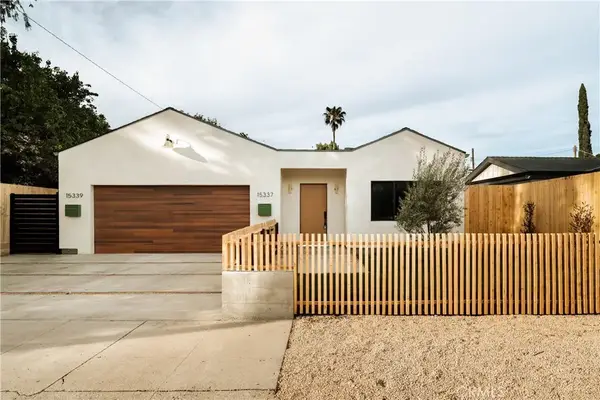 $1,600,000Active6 beds 5 baths2,680 sq. ft.
15337 Lemay Street, Van Nuys, CA 91406
MLS# DW26057780Listed by: REALTY ONE GROUP UNITED  $899,000Active3 beds 2 baths1,504 sq. ft.
16620 Hamlin Street, Los Angeles, CA 91406
MLS# CL26663241Listed by: SOTHEBY'S INTERNATIONAL REALTY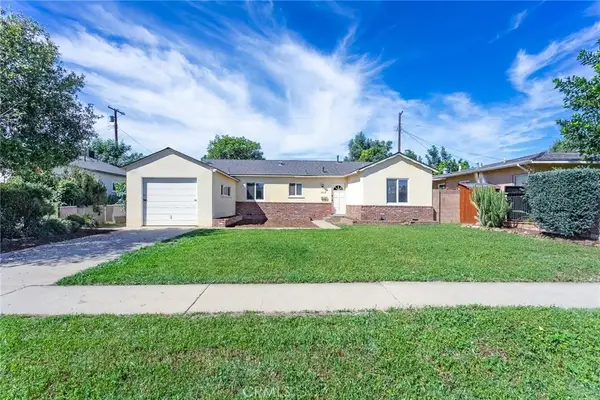 $799,900Active3 beds 1 baths1,134 sq. ft.
7513 Oak Park, Lake Balboa, CA 91406
MLS# SR26050326Listed by: EQUITY UNION- $799,900Active3 beds 1 baths1,134 sq. ft.
7513 Oak Park, Los Angeles, CA 91406
MLS# CRSR26050326Listed by: EQUITY UNION  $1,000,000Active4 beds 2 baths1,576 sq. ft.
6467 Woodley, Van Nuys, CA 91406
MLS# SR26055918Listed by: EQUITY UNION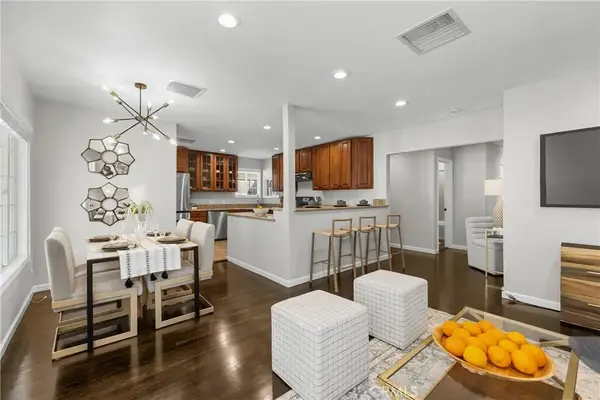 $849,950Pending3 beds 2 baths1,583 sq. ft.
6737 Jellico, Lake Balboa, CA 91406
MLS# SR26053653Listed by: EDDIE BERNARD REALTY $289,000Pending1 beds 2 baths930 sq. ft.
16715 Vanowen, Van Nuys (los Angeles), CA 91406
MLS# CRSR26050525Listed by: RODEO REALTY $1,150,000Active4 beds 3 baths1,820 sq. ft.
17527 Haynes Street, Van Nuys (los Angeles), CA 91406
MLS# CL26663413Listed by: EQUITY UNION $1,398,000Active4 beds 2 baths2,932 sq. ft.
7911 Paso Robles Avenue, Lake Balboa, CA 91406
MLS# 26661361Listed by: ENRG REALTY, INC $899,000Active3 beds 2 baths1,504 sq. ft.
16620 Hamlin Street, Lake Balboa, CA 91406
MLS# 26663241Listed by: SOTHEBY'S INTERNATIONAL REALTY $1,398,000Active4 beds 2 baths2,932 sq. ft.
7911 Paso Robles Avenue, Los Angeles, CA 91406
MLS# CL26661361Listed by: ENRG REALTY, INC $2,895,000Active1 beds 1 baths
7437 Haskell Avenue, Van Nuys, CA 91406
MLS# SR26052166Listed by: EQUITY UNION $6,700,000Active48 beds 48 baths24,952 sq. ft.
15329 Vose Street, Van Nuys, CA 91406
MLS# 26662427Listed by: NORTHMARQ REALTY SERVICES, INC. $1,180,000Active3 beds 2 baths1,649 sq. ft.
17643 Haynes Street, Los Angeles, CA 91406
MLS# CL26662017Listed by: KASE REAL ESTATE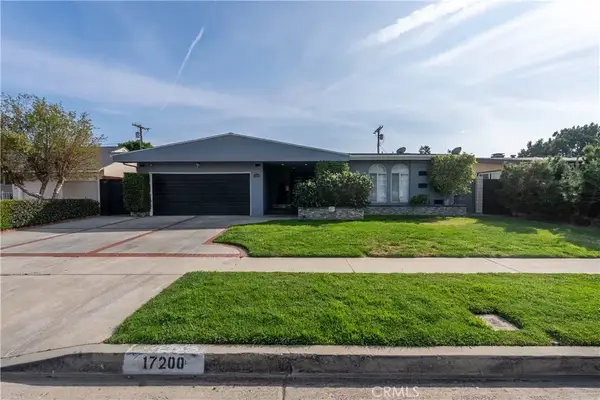 $1,119,000Active3 beds 3 baths2,016 sq. ft.
17200 Willard, Lake Balboa, CA 91406
MLS# SR26049608Listed by: AVANT GARDE REALTY INC.- New
 $1,849,999Active0.14 Acres
6403 Whitman Avenue, Los Angeles, CA 91406
MLS# CL26667291Listed by: KELLER WILLIAMS HOLLYWOOD HILLS  $899,000Active3 beds 2 baths1,299 sq. ft.
15513 Cohasset Street, Van Nuys, CA 91406
MLS# 26661595Listed by: NOURMAND & ASSOCIATES-HW $289,000Pending1 beds 2 baths930 sq. ft.
16715 Vanowen, Van Nuys, CA 91406
MLS# SR26050525Listed by: RODEO REALTY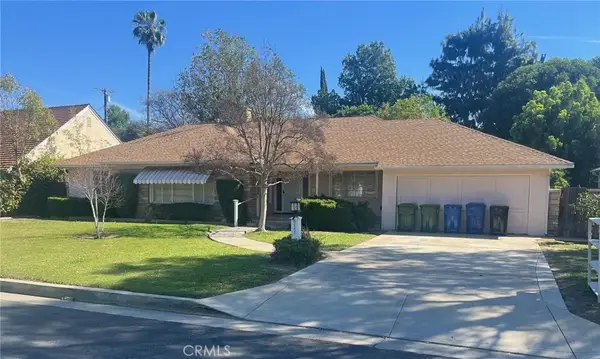 $810,000Pending2 beds 2 baths1,838 sq. ft.
6842 Chisholm, Van Nuys, CA 91406
MLS# SR26045353Listed by: SOTHEBY'S INTERNATIONAL REALTY $1,075,000Active3 beds 2 baths1,409 sq. ft.
6820 Jellico Avenue, Lake Balboa, CA 91406
MLS# SR26045789Listed by: JOHNHART REAL ESTATE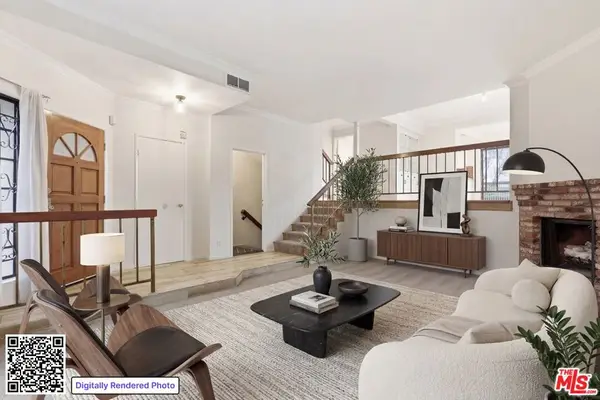 $649,990Active3 beds 3 baths1,641 sq. ft.
7100 Balboa Boulevard #101, Van Nuys, CA 91406
MLS# 26660075Listed by: COMPASS- New
 $1,849,999Active37 beds 37 baths15,111 sq. ft.
6403 Whitman Avenue, Lake Balboa, CA 91406
MLS# 26667303Listed by: KELLER WILLIAMS HOLLYWOOD HILLS  $599,999Active3 beds 4 baths1,349 sq. ft.
7304 Balboa #C, Lake Balboa, CA 91406
MLS# SR26046755Listed by: LANDON REALTY GROUP- Open Sat, 12 to 3pm
 $799,000Active3 beds 2 baths1,558 sq. ft.
15401 Covello Street, Van Nuys, CA 91406
MLS# 26659825Listed by: KELLER WILLIAMS BEVERLY HILLS  $1,400,000Active7 beds 5 baths2,900 sq. ft.
15944 Valerio Street, Van Nuys, CA 91406
MLS# SR26040691Listed by: JOHNHART REAL ESTATE- Open Sun, 2 to 5pm
 $749,900Active3 beds 4 baths1,821 sq. ft.
6840 De Celis #31, Lake Balboa, CA 91406
MLS# SR26046146Listed by: COMPASS  $1,125,000Active4 beds 2 baths1,721 sq. ft.
17007 Bassett Street, Van Nuys (los Angeles), CA 91406
MLS# CRSR26042712Listed by: JOHNHART REAL ESTATE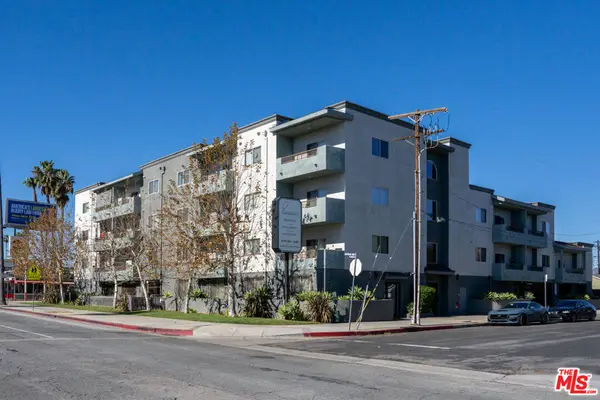 $10,500,000Active59 beds 49 baths32,777 sq. ft.
7203 Rubio Avenue, Van Nuys, CA 91406
MLS# 26658831Listed by: MARCUS & MILLICHAP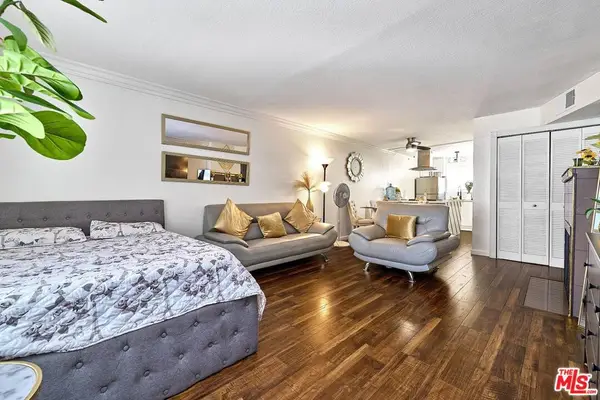 $395,000Active2 beds 2 baths813 sq. ft.
7045 Woodley Avenue #110, Van Nuys, CA 91406
MLS# 26658161Listed by: KELLER WILLIAMS BEVERLY HILLS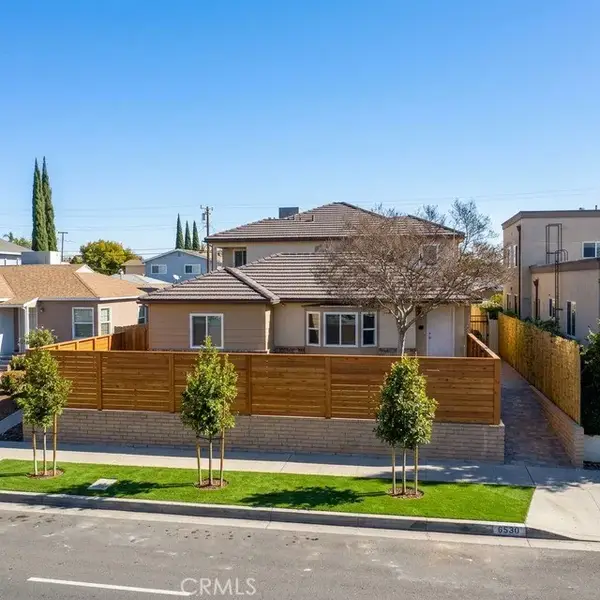 $1,595,000Active8 beds 7 baths4,063 sq. ft.
6550 Balboa, Van Nuys, CA 91406
MLS# SR26044187Listed by: CUSTOM MTG INC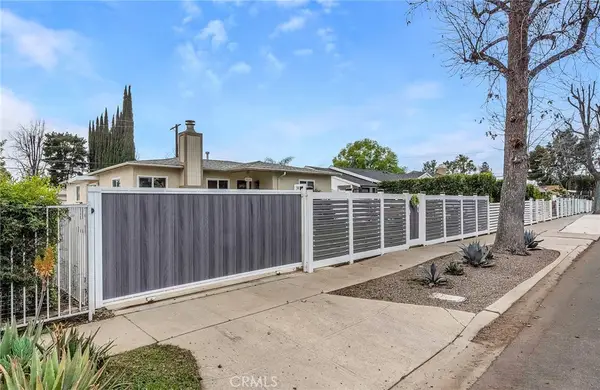 $1,079,999Active3 beds 2 baths1,483 sq. ft.
16142 Haynes, Lake Balboa, CA 91406
MLS# SR26034994Listed by: COLDWELL BANKER QUALITY PROPERTIES $699,999Pending3 beds 1 baths999 sq. ft.
17250 Archwood, Van Nuys, CA 91406
MLS# CV26040124Listed by: SO CAL REALTY & LOANS $1,299,000Active4 beds 3 baths2,051 sq. ft.
15753 Cohasset Street, Van Nuys, CA 91406
MLS# GD26041752Listed by: JOHNHART REAL ESTATE $1,099,000Active4 beds 2 baths1,582 sq. ft.
7667 Chisholm Avenue, Van Nuys (los Angeles), CA 91406
MLS# CL26654113Listed by: COMPASS- Open Sat, 1 to 4pm
 $1,049,000Active4 beds 3 baths1,677 sq. ft.
6714 Jellico, Lake Balboa, CA 91406
MLS# SR26040386Listed by: RODEO REALTY 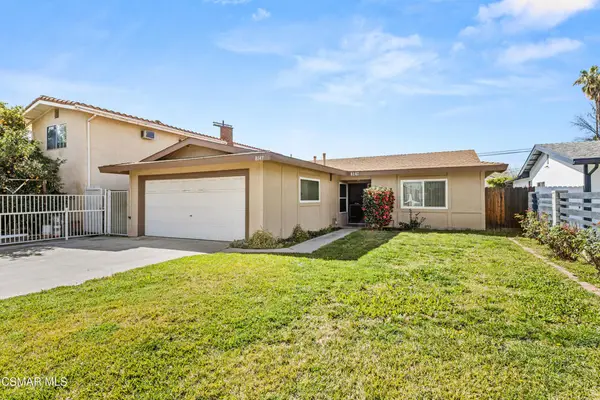 $799,000Pending3 beds 2 baths1,536 sq. ft.
8147 Aldea Avenue, Van Nuys, CA 91406
MLS# 226000822Listed by: KELLER WILLIAMS VIP PROPERTIES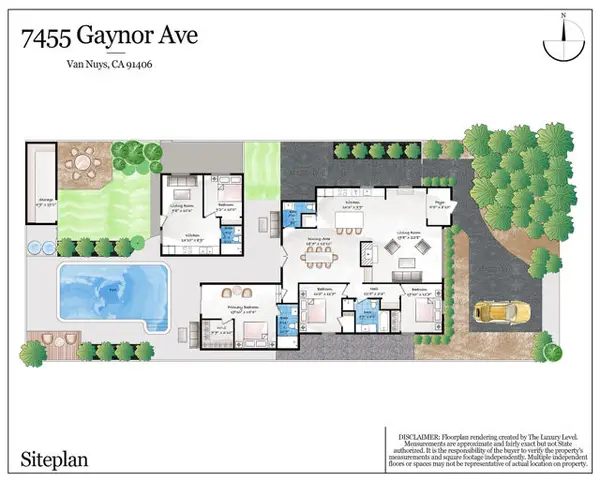 $1,299,900Pending4 beds 4 baths1,909 sq. ft.
7455 Gaynor Avenue, Los Angeles, CA 91406
MLS# CL26653283Listed by: THE ONE LUXURY PROPERTIES $1,299,000Active2 beds 3 baths1,800 sq. ft.
6615 Orion Avenue, Van Nuys (los Angeles), CA 91406
MLS# CL26654377Listed by: SOTHEBY'S INTERNATIONAL REALTY $1,195,000Active3 beds 3 baths1,860 sq. ft.
15556 Valerio, Van Nuys, CA 91406
MLS# GD26037554Listed by: COLDWELL BANKER HALLMARK $884,999Active3 beds 2 baths1,790 sq. ft.
8009 Aldea, Lake Balboa, CA 91406
MLS# SR26037576Listed by: COLDWELL BANKER ENVISION $584,000Active2 beds 3 baths1,281 sq. ft.
6540 Hayvenhurst Avenue #3, Lake Balboa, CA 91406
MLS# 26653605Listed by: SOTHEBY'S INTERNATIONAL REALTY $898,888Active4 beds 3 baths2,280 sq. ft.
6646 Petit Avenue, Van Nuys, CA 91406
MLS# SR26036641Listed by: BEVERLY AND COMPANY $1,198,000Active4 beds 3 baths1,857 sq. ft.
7358 Paso Robles Ave, Lake Balboa, CA 91406
MLS# DW26035403Listed by: EXP REALTY OF GREATER L.A $1,129,000Active4 beds 3 baths2,325 sq. ft.
7466 Louise Avenue, Los Angeles, CA 91406
MLS# CL26652181Listed by: COMPASS $1,050,000Active3 beds 2 baths2,531 sq. ft.
15934 Kittridge, Lake Balboa, CA 91406
MLS# SR26033317Listed by: PINNACLE ESTATE PROPERTIES, INC. $1,350,000Active4 beds 3 baths2,832 sq. ft.
17064 Cantlay, Van Nuys, CA 91406
MLS# SR26034388Listed by: WILL WHEATON REAL ESTATE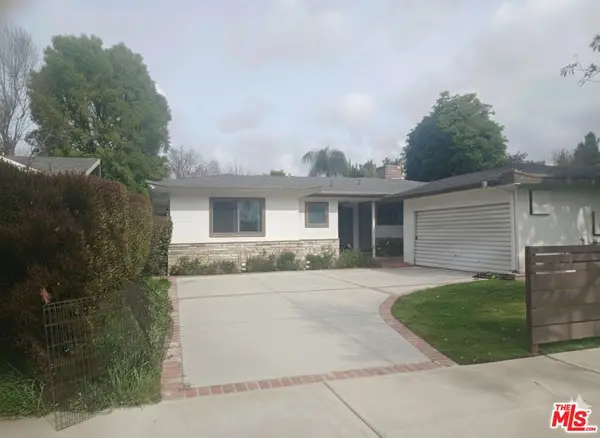 $925,000Active3 beds 2 baths1,740 sq. ft.
15735 Bassett Street, Lake Balboa, CA 91406
MLS# 26646617Listed by: REDFIN $699,000Pending3 beds 1 baths1,184 sq. ft.
7001 Bianca Avenue, Van Nuys, CA 91406
MLS# 26651779Listed by: BERKSHIRE HATHAWAY HOMESERVICES CALIFORNIA PROPERTIES $1,440,000Active4 beds 3 baths3,044 sq. ft.
6448 Peach Avenue, Van Nuys (los Angeles), CA 91406
MLS# CL26651407Listed by: RESIDENT GROUP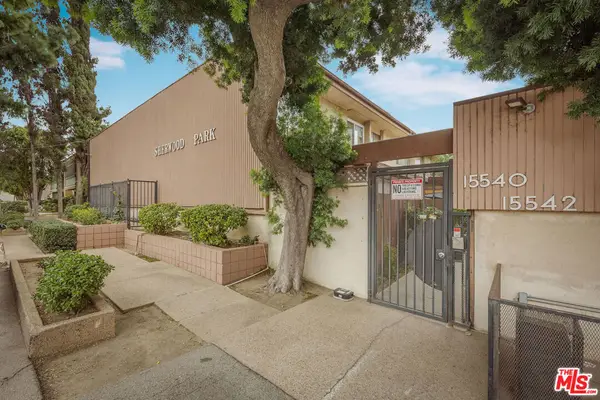 $449,000Active2 beds 2 baths1,054 sq. ft.
15540 Sherman Way #14, Van Nuys, CA 91406
MLS# 26647629Listed by: KELLER WILLIAMS LARCHMONT $745,000Pending2 beds 1 baths988 sq. ft.
6631 Densmore Avenue, Lake Balboa, CA 91406
MLS# SR26031634Listed by: PINNACLE ESTATE PROPERTIES, INC. $1,199,000Active4 beds 4 baths2,659 sq. ft.
6648 Gaviota Avenue, Lake Balboa, CA 91406
MLS# GD26029047Listed by: COLDWELL BANKER HALLMARK $2,995,000Active3 beds 2 baths
17007 Vanowen, Van Nuys, CA 91406
MLS# SR26029690Listed by: KELLER WILLIAMS REALTY-STUDIO CITY $399,995Pending2 beds 2 baths1,087 sq. ft.
15542 Sherman Way #11, Van Nuys, CA 91406
MLS# BB26026632Listed by: CONTEMPO REALTORS $860,000Pending4 beds 2 baths1,492 sq. ft.
6909 Peach Avenue, Van Nuys, CA 91406
MLS# SR26027424Listed by: PARK REGENCY REALTY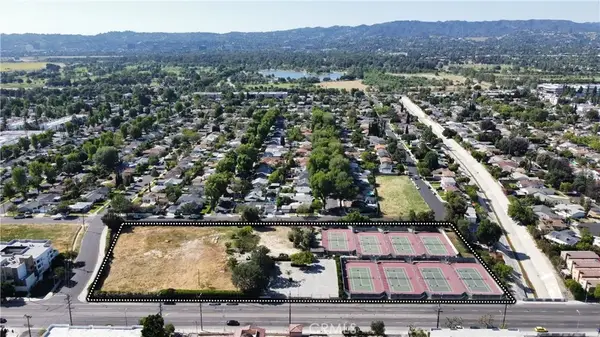 $15,950,000Active0 Acres
16600 Vanowen, Van Nuys, CA 91406
MLS# SR26026886Listed by: EVANISKO REALTY & INVESTMENT $998,000Pending4 beds 2 baths1,348 sq. ft.
15933 Haynes Street, Van Nuys, CA 91406
MLS# SR26026104Listed by: EHOMES $975,000Active3 beds 3 baths1,283 sq. ft.
6435 Aldea Avenue, Van Nuys, CA 91406
MLS# TR26021624Listed by: GKR INVESTMENTS $499,000Active2 beds 3 baths1,028 sq. ft.
7045 Woodley Avenue #124, Lake Balboa, CA 91406
MLS# SR26016889Listed by: KELLER WILLIAMS LUXURY $499,000Active2 beds 3 baths1,028 sq. ft.
7045 Woodley Avenue #124, Lake Balboa, CA 91406
MLS# SR26016889Listed by: KELLER WILLIAMS LUXURY $410,000Active1 beds 1 baths772 sq. ft.
8221 Langdon Avenue #201, Van Nuys, CA 91406
MLS# 26643347Listed by: KELLER WILLIAMS BEVERLY HILLS $919,900Active3 beds 2 baths1,329 sq. ft.
6539 Blucher Avenue, Van Nuys, CA 91406
MLS# SR26016364Listed by: MCRES PROPERTIES $1,775,000Active5 beds 5 baths2,901 sq. ft.
15358 Cohasset, Van Nuys, CA 91406
MLS# SR26012204Listed by: GLOBAL PREMIER PROPERTIES, INC. $935,000Active3 beds 3 baths1,964 sq. ft.
6552 Aqueduct Avenue, Van Nuys (los Angeles), CA 91406
MLS# CRSR26008261Listed by: RE/MAX OF SANTA CLARITA $897,000Active4 beds 3 baths1,960 sq. ft.
6551 Whitman, Van Nuys, CA 91406
MLS# BB26008142Listed by: HOMESMART PV AND ASSOCIATES $1,360,000Active8 beds 4 baths
16037 Gault, Van Nuys, CA 91406
MLS# SR26008377Listed by: RE/MAX LUXE $376,000Pending1 beds 1 baths709 sq. ft.
8221 Langdon #204, Van Nuys, CA 91406
MLS# PI26004574Listed by: MIRAMAR INTERNATIONAL INC. $376,000Pending1 beds 1 baths709 sq. ft.
8221 Langdon #204, Van Nuys, CA 91406
MLS# PI26004574Listed by: MIRAMAR INTERNATIONAL INC. $795,000Active0 Acres
7315 Woodley, Van Nuys, CA 91406
MLS# V1-33967Listed by: RE/MAX GOLD COAST-BEACH MARINA OFFICE $460,000Pending2 beds 2 baths959 sq. ft.
15511 Sherman Way #1, Van Nuys, CA 91406
MLS# SR26002373Listed by: CITIWIDE REALTY GROUP $2,975Active2 beds 2 baths18,616 sq. ft.
7013 Haskell, Van Nuys, CA 91406
MLS# DW25278924Listed by: CENTURY 21 ALLSTARS $790,000Active2 beds 1 baths805 sq. ft.
17431 Valerio, Van Nuys, CA 91406
MLS# SR25275058Listed by: ANGELS789 REALTY $925,000Active4 beds 4 baths1,908 sq. ft.
6707 N Sepulveda Boulevard, Van Nuys, CA 91411
MLS# 25624905Listed by: KELLER WILLIAMS HOLLYWOOD HILLS $393,000Active2 beds 2 baths878 sq. ft.
7035 Woodley #116, Van Nuys, CA 91406
MLS# SR25268568Listed by: HOMESMART EVERGREEN REALTY $393,000Active2 beds 2 baths878 sq. ft.
7035 Woodley #116, Van Nuys, CA 91406
MLS# SR25268568Listed by: HOMESMART EVERGREEN REALTY $460,000Pending2 beds 2 baths959 sq. ft.
15511 Sherman Way #1, Van Nuys, CA 91406
MLS# SR26002373Listed by: CITIWIDE REALTY GROUP- Open Fri, 4 to 6:30pm
 $950,000Active3 beds 2 baths1,124 sq. ft.
7001 Lasaine Avenue, Van Nuys, CA 91406
MLS# WS25263839Listed by: WEDGEWOOD HOMES REALTY  $305,995Active1 beds 1 baths608 sq. ft.
7045 Woodley Avenue #218, Van Nuys, CA 91406
MLS# SR25260462Listed by: KELLER WILLIAMS BEVERLY HILLS $869,000Pending3 beds 1 baths1,121 sq. ft.
17649 Lemay Street, Lake Balboa, CA 91406
MLS# 225005620Listed by: BENESCH HOME & ESTATES $405,000Active2 beds 2 baths907 sq. ft.
7035 Woodley #205, Van Nuys, CA 91406
MLS# RS25257099Listed by: AMBERWOOD REAL ESTATE $405,000Active2 beds 2 baths907 sq. ft.
7035 Woodley #205, Van Nuys, CA 91406
MLS# RS25257099Listed by: AMBERWOOD REAL ESTATE $799,000Active3 beds -- baths
7402 Haskell, Van Nuys, CA 91406
MLS# SR25258589Listed by: BERKSHIRE HATHAWAY HOMESERVICES CALIFORNIA PROPERTIES $1,599,000Active7 beds 9 baths3,654 sq. ft.
15743 Covello Street, Lake Balboa, CA 91406
MLS# P1-24850Listed by: BERKSHIRE HATHAWAY HOME SERVIC $850,000Active3 beds 2 baths1,693 sq. ft.
7503 Aqueduct Ave, Van Nuys, CA 91406
MLS# CV25254598Listed by: FIRST TEAM REAL ESTATE $474,000Pending2 beds 2 baths961 sq. ft.
7135 Firmament #25, Van Nuys, CA 91406
MLS# SR25254261Listed by: FIRST TEAM REAL ESTATE $839,950Pending3 beds 2 baths1,609 sq. ft.
6446 Mclennan, Lake Balboa, CA 91406
MLS# SR25254210Listed by: DUGGAN PROPERTY MANAGEMENT, INC. $799,000Active3 beds -- baths1,221 sq. ft.
7406 Haskell, Van Nuys, CA 91406
MLS# SR25248018Listed by: BERKSHIRE HATHAWAY HOMESERVICES CALIFORNIA PROPERTIES $549,900Active3 beds 3 baths1,566 sq. ft.
7550 Zombar #11, Van Nuys, CA 91406
MLS# GD26008118Listed by: AMERICANA REAL ESTATE SERVICES- Open Sun, 12 to 4pm
 $849,900Active3 beds 2 baths1,507 sq. ft.
15358 Gault Street, Van Nuys, CA 91406
MLS# 25608623Listed by: THE CORE AGENCY  $789,999Pending3 beds 1 baths1,109 sq. ft.
17650 Welby Way, Lake Balboa, CA 91406
MLS# SR25238811Listed by: REAL BROKERAGE TECHNOLOGIES, INC. $375,000Active2 beds 1 baths750 sq. ft.
15425 Sherman #107A, Van Nuys, CA 91406
MLS# GD26009158Listed by: THE ART IN REAL ESTATE $375,000Active2 beds 1 baths750 sq. ft.
15425 Sherman #107A, Van Nuys (los Angeles), CA 91406
MLS# CRGD26009158Listed by: THE ART IN REAL ESTATE $375,000Active2 beds 2 baths878 sq. ft.
7035 Woodley Avenue #203, Van Nuys, CA 91406
MLS# SR25230319Listed by: KELLER WILLIAMS LUXURY $375,000Active2 beds 2 baths878 sq. ft.
7035 Woodley Avenue #203, Van Nuys, CA 91406
MLS# SR25230319Listed by: KELLER WILLIAMS LUXURY $1,075,000Pending5 beds 4 baths
6628 Gaviota, Lake Balboa, CA 91406
MLS# SR25223077Listed by: EQUITY UNION $1,249,990Pending2 beds 1 baths615 sq. ft.
6747 Gaviota Avenue, Van Nuys, CA 91406
MLS# BB25201273Listed by: REALTY EXECUTIVES POWER GROUP $1,069,000Active5 beds 4 baths2,096 sq. ft.
6402 GRAVES AVENUE, Van Nuys, CA 91406
MLS# 202509192Listed by: MISSION REAL ESTATE $2,695,000Active12 beds 13 baths
6845 Haskell Avenue, Lake Balboa, CA 91406
MLS# SR23163447Listed by: BIJAN TEAM REALTY $2,695,000Active12 beds -- baths5,858 sq. ft.
6845 Haskell Avenue, Los Angeles, CA 91406
MLS# CRSR23163447Listed by: BIJAN TEAM REALTY $5,500,000Active32 beds 24 baths
15445 Vanowen Street, Van Nuys, CA 91406
MLS# GD25196124Listed by: KELLER WILLIAMS R. E. SERVICES $950,000Active2 beds 1 baths1,242 sq. ft.
7927 Paso Robles Avenue, Lake Balboa, CA 91406
MLS# 226001090Listed by: PINNACLE ESTATE PROPERTIES, INC. $1,069,000Active-- beds -- baths
6402 Graves Avenue, Van Nuys, CA 91406
MLS# 25006792Listed by: AMERICAN REAL ESTATE EXPERTS $864,500Active2 beds 2 baths1,134 sq. ft.
15841 Marlin Place, Van Nuys, CA 91406
MLS# WS25188482Listed by: KELLER WILLIAMS REALTY/TEMECULA $149,950Active2 beds 1 baths
7800 Balboa Blvd # 11, Van Nuys, CA 91407
MLS# SR25172951Listed by: PACIFIC PROPERTIES $599,000Pending2 beds 3 baths1,170 sq. ft.
16723 Vanowen Street, Van Nuys, CA 91406
MLS# SR26043063Listed by: PAK HOME REALTY $2,100,000Active11 beds 8 baths
6512 Balboa Boulevard, Van Nuys, CA 91406
MLS# SR25157729Listed by: RODEO REALTY $1,299,000Pending5 beds 4 baths2,533 sq. ft.
17443 Valerio Street, Van Nuys, CA 91406
MLS# 25615393Listed by: DOUGLAS ELLIMAN $2,100,000Active-- beds -- baths4,800 sq. ft.
6512 Balboa Boulevard, Van Nuys, CA 91406
MLS# SR25157729Listed by: RODEO REALTY $1,190,000Active4 beds 3 baths2,525 sq. ft.
7129 Forbes Avenue, Van Nuys, CA 91406
MLS# SR25121239Listed by: COLDWELL BANKER HALLMARK REALTY $949,950Pending5 beds 4 baths1,805 sq. ft.
15330 Hart Street, Van Nuys (los Angeles), CA 91406
MLS# CRSR25179743Listed by: PARK REGENCY REALTY $1,650,000Pending5 beds 3 baths1,956 sq. ft.
16654 Kelsloan Street, Van Nuys, CA 91406
MLS# SR25067584Listed by: REALTY EXECUTIVES $975,000Active4 beds 3 baths1,595 sq. ft.
17209 Stagg Street, Van Nuys, CA 91406
MLS# 26644309Listed by: COLDWELL BANKER REALTY $3,795,000Active21 beds 16 baths7,701 sq. ft.
6461 Woodley Avenue, Van Nuys, CA 91406
MLS# 26661771Listed by: RISE REALTY $2,250,000Active4 beds 5 baths3,885 sq. ft.
6849 Firmament Avenue, Van Nuys, CA 91406
MLS# SR26031935Listed by: JOHNHART REAL ESTATE $820,000Pending4 beds 2 baths1,605 sq. ft.
6627 Whitman Avenue, Van Nuys (los Angeles), CA 91406
MLS# CRBB24014091Listed by: HOMESMART PV AND ASSOCIATES
Local realty services provided by:CENTURY 21 Century Real Estate, CENTURY 21 Affiliated, CENTURY 21 Sierra Properties, CENTURY 21 Jordan-Link, CENTURY 21 Doug Anderson
The information being provided by California Regional MLS (Southern California) is for the consumer's personal, non-commercial use and may not be used for any purpose other than to identify prospective properties consumer may be interested in purchasing. Any information relating to real estate for sale referenced on this web site comes from the Internet Data Exchange (IDX) program of the California Regional MLS (Southern California). CENTURY 21 Century Real Estate is not a Multiple Listing Service (MLS), nor does it offer MLS access. This website is a service of CENTURY 21 Century Real Estate, a broker participant of California Regional MLS (Southern California). This web site may reference real estate listing(s) held by a brokerage firm other than the broker and/or agent who owns this web site.
The accuracy of all information, regardless of source, including but not limited to open house information, square footages and lot sizes, is deemed reliable but not guaranteed and should be personally verified through personal inspection by and/or with the appropriate professionals. The data contained herein is copyrighted by California Regional MLS (Southern California) and is protected by all applicable copyright laws. Any unauthorized dissemination of this information is in violation of copyright laws and is strictly prohibited.
Copyright 2021 California Regional MLS (Southern California). All rights reserved.
This information is deemed reliable but not guaranteed. You should rely on this information only to decide whether or not to further investigate a particular property. BEFORE MAKING ANY OTHER DECISION, YOU SHOULD PERSONALLY INVESTIGATE THE FACTS (e.g. square footage and lot size) with the assistance of an appropriate professional. You may use this information only to identify properties you may be interested in investigating further. All uses except for personal, non-commercial use in accordance with the foregoing purpose are prohibited. Redistribution or copying of this information, any photographs or video tours is strictly prohibited. This information is derived from the Internet Data Exchange (IDX) service provided by San Diego MLS®. Displayed property listings may be held by a brokerage firm other than the broker and/or agent responsible for this display. The information and any photographs and video tours and the compilation from which they are derived is protected by copyright. Compilation © 2020 San Diego MLS®, Inc.
Popular searches near 91406
Popular neighborhoods near 91406
- Arleta, Pacoima homes for sale
- Encino, Encino homes for sale
- Lake Balboa, Van Nuys homes for sale
- Mission Hills, Mission Hills homes for sale
- North Hills, North Hills homes for sale
- Northridge, Northridge homes for sale
- Panorama City, Panorama City homes for sale
- Reseda, Reseda homes for sale
- Sherman Oaks, Sherman Oaks homes for sale
- Sherman Village, Sherman Oaks homes for sale
- Sherwood Forest, Northridge homes for sale
- Sun Valley, Sun Valley homes for sale
- Tarzana, Tarzana homes for sale
- The San Fernando Valley, Panorama City homes for sale
- Valley Glen, Van Nuys homes for sale
- Valley Village, Valley Village homes for sale
- Valleyheart Glen, Sherman Oaks homes for sale
- Van Nuys, Van Nuys homes for sale
- Warner Center, Woodland Hills homes for sale
- Winnetka, Winnetka homes for sale
Protect your home and budget from life's surprises with an Assurant Home Warranty, backed by a partner that supports you through every step of homeownership. Explore Plans.
©2026 Century 21 Real Estate LLC. All rights reserved. CENTURY 21®, the CENTURY 21 Logo and C21® are service marks owned by Century 21 Real Estate LLC. Century 21 Real Estate LLC fully supports the principles of the Fair Housing Act and the Equal Opportunity Act. Each office is independently owned and operated. Listing information is deemed reliable but not guaranteed accurate.