- Bayshore Beautiful, Tampa homes for sale
- Bayshore Gardens, Tampa homes for sale
- Bayside West, Tampa homes for sale
- Beach Park, Tampa homes for sale
- Bon Air, Tampa homes for sale
- Culbreath Heights, Tampa homes for sale
- Fair Oaks, Tampa homes for sale
- Golfview, Tampa homes for sale
- Hanan Estates, Tampa homes for sale
- Henderson Beach, Tampa homes for sale
- Historic Hyde Park, Tampa homes for sale
- New Suburb Beautiful, Tampa homes for sale
- North New Suburb Beautiful, Tampa homes for sale
- Palma Ceia, Tampa homes for sale
- Palma Ceia Pines, Tampa homes for sale
- Palma Ceia West, Tampa homes for sale
- Parkland Estates, Tampa homes for sale
- South Tampa, Tampa homes for sale
- Sunset Park, Tampa homes for sale
- Swann Estates, Tampa homes for sale
Virginia Park, Tampa, FL - homes for sale
48 of 48 results displayed
- Open Sat, 11am to 2pmNew
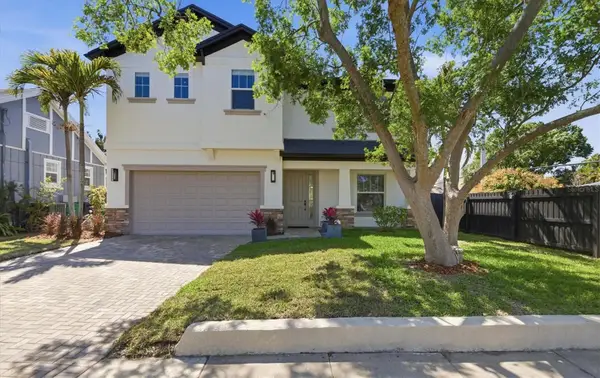 $1,450,000Active4 beds 4 baths3,518 sq. ft.
3824 W Santiago Street, TAMPA, FL 33629
MLS# TB8490917Listed by: COMPASS FLORIDA LLC - New
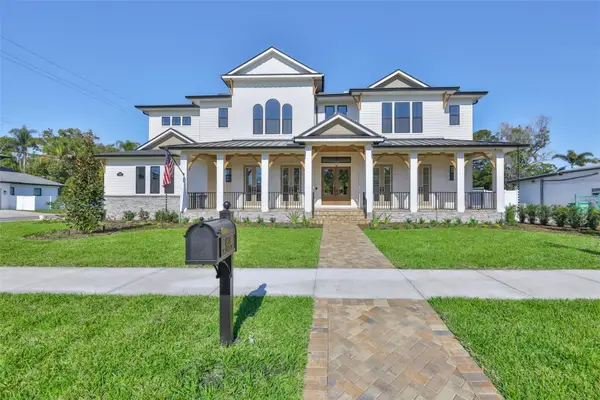
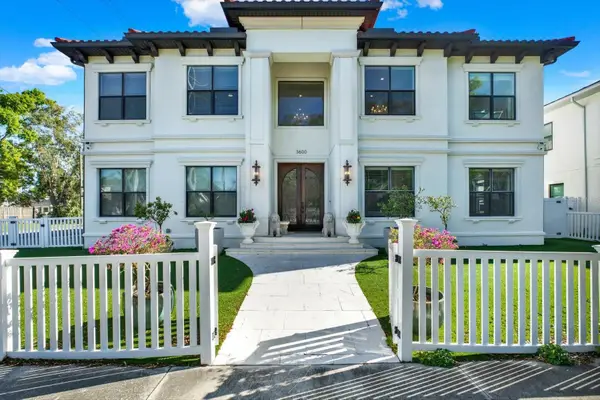 $2,695,000Active5 beds 5 baths4,955 sq. ft.
3600 W San Luis Street, TAMPA, FL 33629
MLS# TB8488493Listed by: DALTON WADE INC 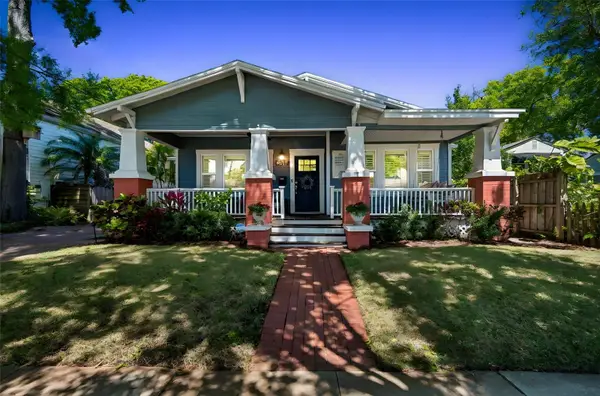 $925,000Pending3 beds 2 baths1,700 sq. ft.
3617 W Santiago Street, TAMPA, FL 33629
MLS# TB8486471Listed by: GULF SHORES REALTY ERA POWERED LLC- New
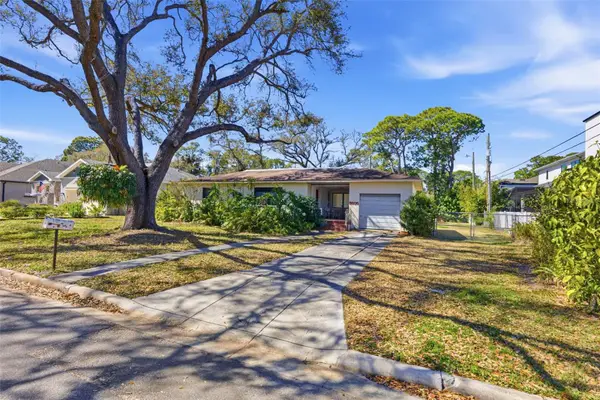 $789,000Active2 beds 1 baths980 sq. ft.
3605 S Thatcher Avenue, TAMPA, FL 33629
MLS# TB8487878Listed by: SMITH & ASSOCIATES REAL ESTATE  $1,500,000Pending4 beds 4 baths3,364 sq. ft.
4216 W Leona Street, TAMPA, FL 33629
MLS# TB8487840Listed by: PALERMO REAL ESTATE PROF. INC.- New
 $575,000Active0.22 Acres
4104 W El Prado Boulevard, TAMPA, FL 33629
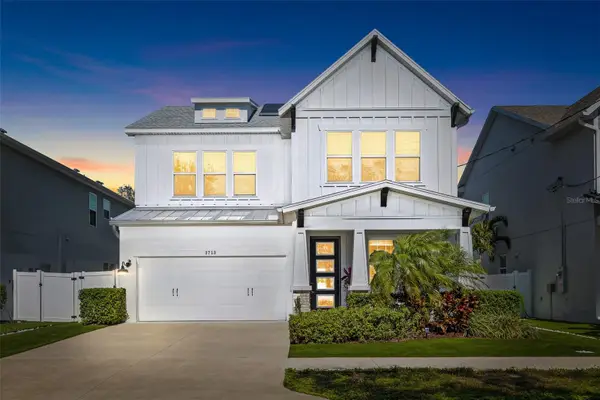
MLS# TB8486029Listed by: SMITH & ASSOCIATES REAL ESTATE  $2,390,000Active5 beds 6 baths4,314 sq. ft.
3901 W Granada Street, TAMPA, FL 33629
MLS# TB8486219Listed by: COASTAL PROPERTIES GROUP INTERNATIONAL $2,399,000Active5 beds 5 baths4,582 sq. ft.
4316 W Corona Street, TAMPA, FL 33629
MLS# TB8483049Listed by: HOMES BY WESTBAY REALTY- Open Sat, 1 to 3pm

 $1,115,000Active3 beds 3 baths1,992 sq. ft.
3925 W Vasconia Street, TAMPA, FL 33629
MLS# TB8485938Listed by: CENTURY 21 LIST WITH BEGGINS  $1,749,000Active5 beds 5 baths3,637 sq. ft.
3604 W Tampa Circle, TAMPA, FL 33629
MLS# TB8485189Listed by: STAR BAY REALTY CORP. $1,924,990Active5 beds 5 baths3,831 sq. ft.
3601 E Tampa Circle, TAMPA, FL 33629
MLS# TB8484464Listed by: WEEKLEY HOMES REALTY COMPANY $965,000Pending4 beds 3 baths2,572 sq. ft.
4306 Leona Street W, TAMPA, FL 33629
MLS# TB8484474Listed by: SMITH & ASSOCIATES REAL ESTATE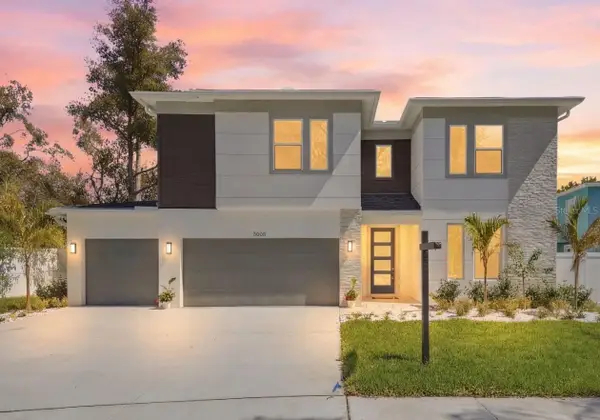 $1,750,000Pending5 beds 4 baths3,784 sq. ft.
3608 E Tampa Circle, TAMPA, FL 33629
MLS# TB8483702Listed by: IMPACT REALTY TAMPA BAY $1,620,000Active5 beds 5 baths3,646 sq. ft.
3610 E Clark Circle, TAMPA, FL 33629
MLS# TB8481658Listed by: TAMPA BAY KEY REALTY- Open Sat, 1 to 3pm
 $799,000Active3 beds 2 baths1,740 sq. ft.
3906 W Vasconia Street, TAMPA, FL 33629
MLS# TB8483098Listed by: BELL HENDERSON REAL ESTATE 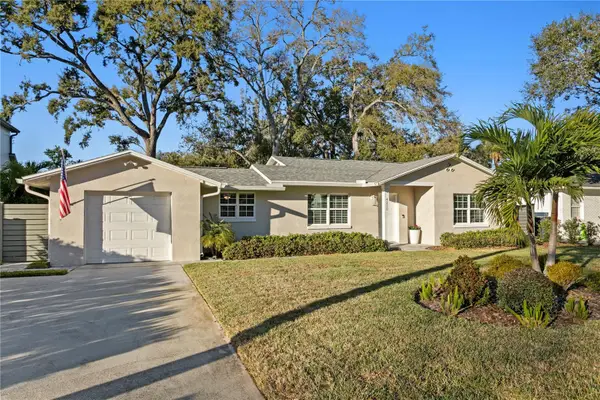 $975,000Pending3 beds 2 baths1,615 sq. ft.
4215 W Palmira Avenue, TAMPA, FL 33629
MLS# TB8474053Listed by: COMPASS FLORIDA LLC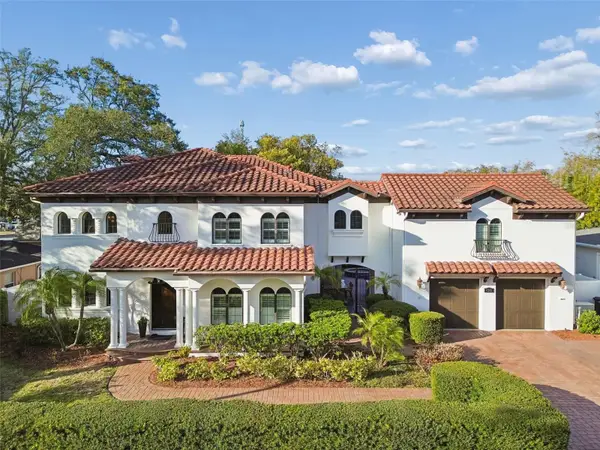 $2,200,000Active6 beds 5 baths4,241 sq. ft.
4311 W Barcelona Street, TAMPA, FL 33629
MLS# TB8448096Listed by: COMPASS FLORIDA LLC- Open Sat, 1 to 3pm
 $1,550,000Active5 beds 5 baths3,560 sq. ft.
3713 W Leona Street, TAMPA, FL 33629
MLS# TB8476611Listed by: MCBRIDE KELLY & ASSOCIATES  $1,275,000Active5 beds 4 baths3,314 sq. ft.
3814 W Sevilla Street, TAMPA, FL 33629
MLS# TB8480475Listed by: COMPASS FLORIDA LLC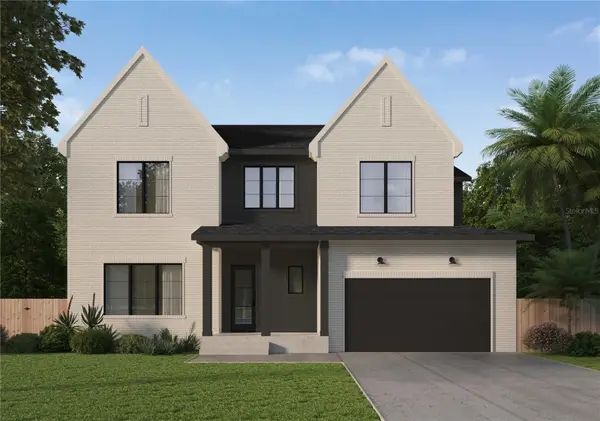 $1,775,000Active5 beds 5 baths3,637 sq. ft.
3709 W San Pedro Street, TAMPA, FL 33629
MLS# TB8477628Listed by: STAR BAY REALTY CORP.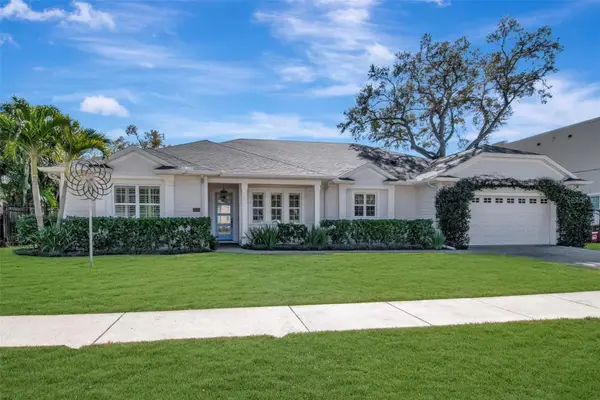 $2,100,000Pending4 beds 4 baths3,122 sq. ft.
3808 W Barcelona Street, TAMPA, FL 33629
MLS# TB8478551Listed by: SMITH & ASSOCIATES REAL ESTATE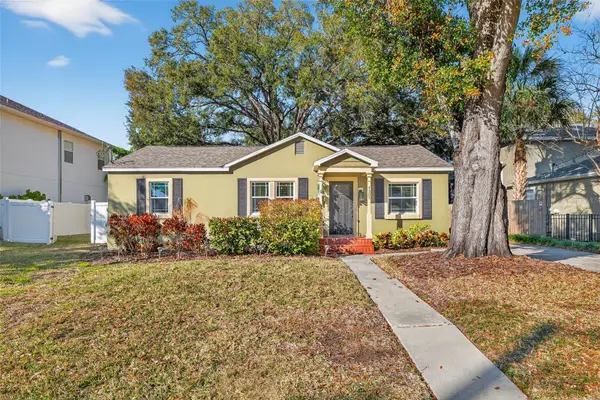 $755,000Pending4 beds 2 baths1,860 sq. ft.
4305 W Leona Street, TAMPA, FL 33629
MLS# TB8477887Listed by: SMITH & ASSOCIATES REAL ESTATE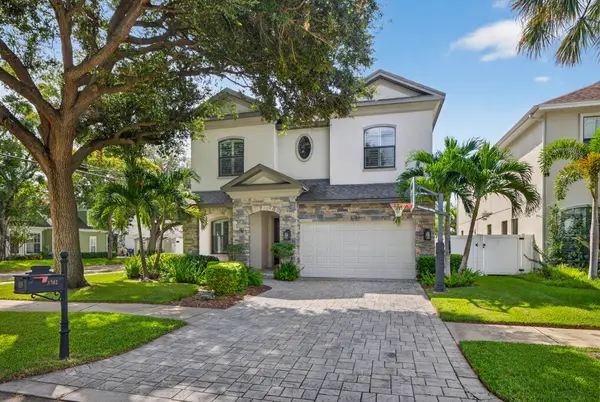 $1,599,000Active4 beds 4 baths3,487 sq. ft.
3702 W San Luis Street, TAMPA, FL 33629
MLS# TB8477807Listed by: CENTURY 21 BILL NYE REALTY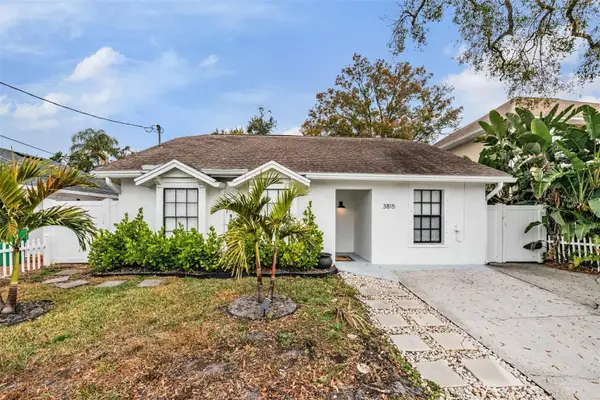 $825,000Pending3 beds 2 baths1,502 sq. ft.
3815 W San Juan Street, TAMPA, FL 33629
MLS# TB8427762Listed by: COMPASS FLORIDA LLC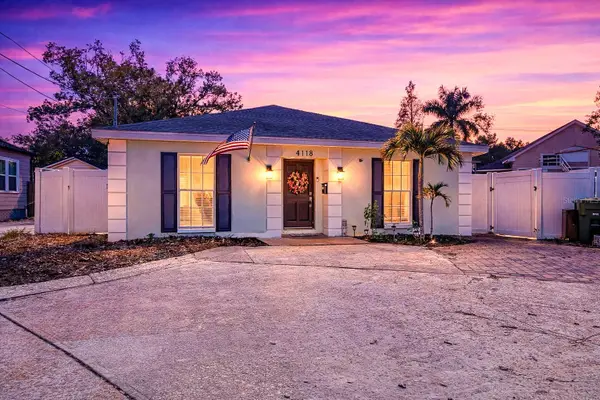 $670,000Active3 beds 2 baths1,475 sq. ft.
4118 W Obispo Street, TAMPA, FL 33629
MLS# TB8475643Listed by: DOUGLAS ELLIMAN- Open Sat, 1 to 3pm
 $769,995Active3 beds 2 baths1,596 sq. ft.
3604 W Bay To Bay Boulevard, TAMPA, FL 33629
MLS# TB8470760Listed by: SIGNATURE REALTY ASSOCIATES  $1,260,000Pending4 beds 3 baths2,799 sq. ft.
3821 W Santiago Street, TAMPA, FL 33629
MLS# TB8460579Listed by: KELLER WILLIAMS TAMPA CENTRAL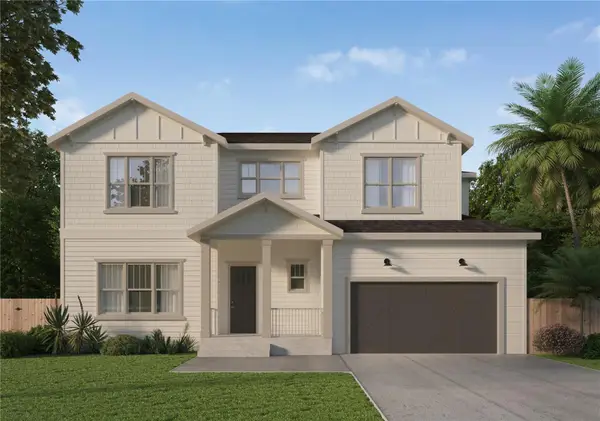 $1,749,000Pending5 beds 5 baths3,637 sq. ft.
3612 W Tampa Circle, TAMPA, FL 33629
MLS# TB8465151Listed by: STAR BAY REALTY CORP.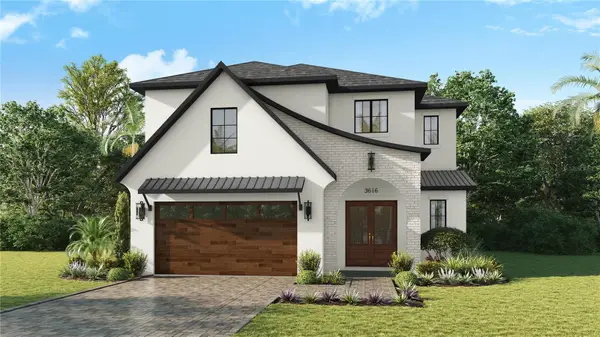 $1,949,000Pending5 beds 5 baths3,696 sq. ft.
3616 S Grady Avenue, TAMPA, FL 33629
MLS# TB8467536Listed by: PALERMO REAL ESTATE PROF. INC.- Open Sun, 2 to 4pm
 $3,149,000Active5 beds 7 baths5,165 sq. ft.
4123 W Corona Street, TAMPA, FL 33629
MLS# TB8461416Listed by: CENTURY 21 LIST WITH BEGGINS  $1,725,000Active4 beds 5 baths3,718 sq. ft.
4313 W Vasconia Street, TAMPA, FL 33629
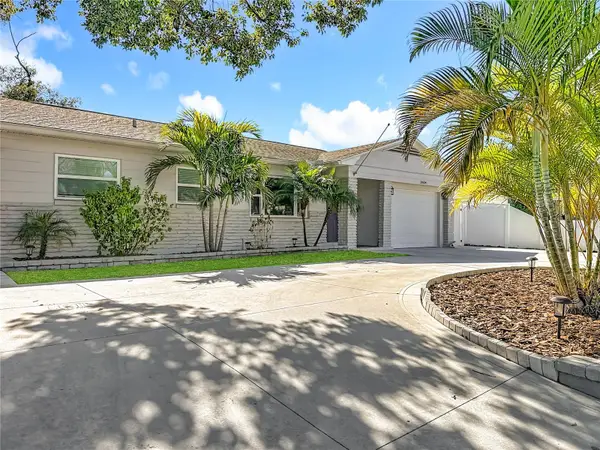
MLS# TB8454631Listed by: COMPASS FLORIDA LLC $849,950Active3 beds 3 baths1,663 sq. ft.
4309 W Obispo Street, TAMPA, FL 33629
MLS# TB8454690Listed by: PINEYWOODS REALTY LLC $1,125,000Pending4 beds 3 baths2,688 sq. ft.
4001 W Leona Street, TAMPA, FL 33629
MLS# TB8447356Listed by: ACROPOLIS REALTY GROUP LLC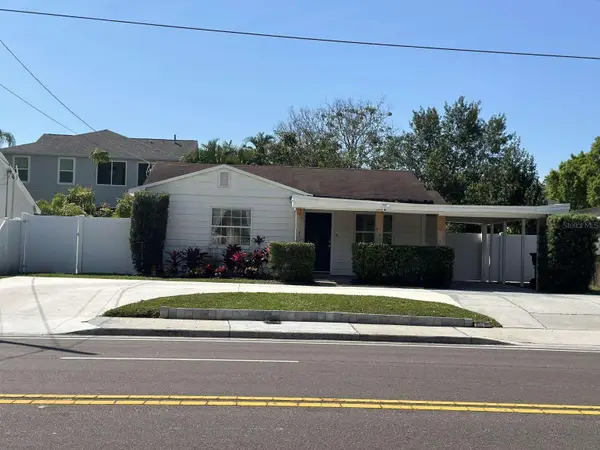 $602,500Pending3 beds 2 baths1,184 sq. ft.
3606 W Bay To Bay Boulevard, TAMPA, FL 33629
MLS# TB8430738Listed by: HOME SOLD REALTY LLC $1,295,000Active5 beds 4 baths3,248 sq. ft.
3706 W Vasconia Street, TAMPA, FL 33629
MLS# TB8425664Listed by: EXIT BAYSHORE REALTY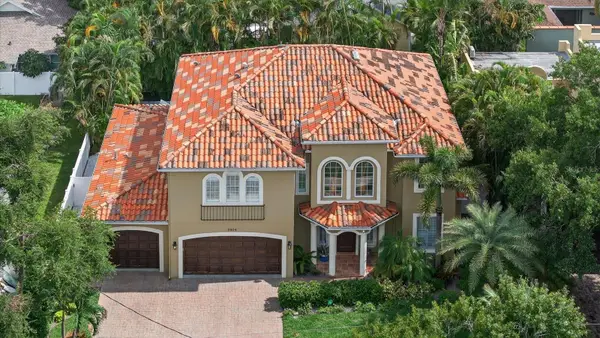 $1,699,000Active6 beds 5 baths3,400 sq. ft.
3904 W Santiago Street, TAMPA, FL 33629
MLS# TB8412720Listed by: IMPACT REALTY TAMPA BAY $1,895,356Pending5 beds 5 baths4,263 sq. ft.
3701 W Sevilla Street, TAMPA, FL 33629
MLS# A4660242Listed by: BERKSHIRE HATHAWAY HOMESERVICE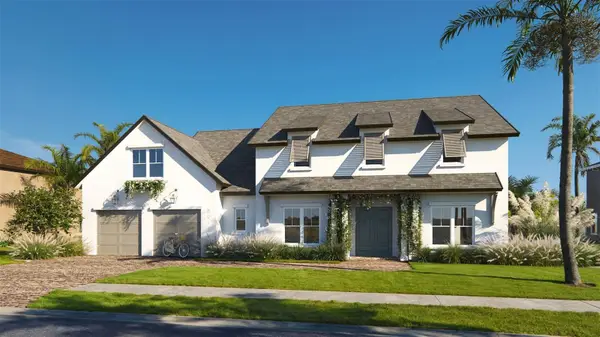 $1,797,900Pending5 beds 5 baths4,289 sq. ft.
3708 W Sevilla Street, TAMPA, FL 33629
MLS# A4657935Listed by: BERKSHIRE HATHAWAY HOMESERVICE $2,099,000Pending4 beds 5 baths3,584 sq. ft.
3919 W Leona Street, TAMPA, FL 33629
MLS# TB8389860Listed by: LPT REALTY LLC- Open Sun, 2 to 4pm
 $2,899,000Active6 beds 6 baths5,034 sq. ft.
4208 W Vasconia Street, TAMPA, FL 33629
MLS# TB8391380Listed by: KELLER WILLIAMS SOUTH TAMPA - Open Sun, 1:30 to 3:30pm
 $2,385,000Active5 beds 6 baths4,988 sq. ft.
4311 W Sevilla Street, TAMPA, FL 33629
MLS# TB8389324Listed by: KELLER WILLIAMS SOUTH TAMPA 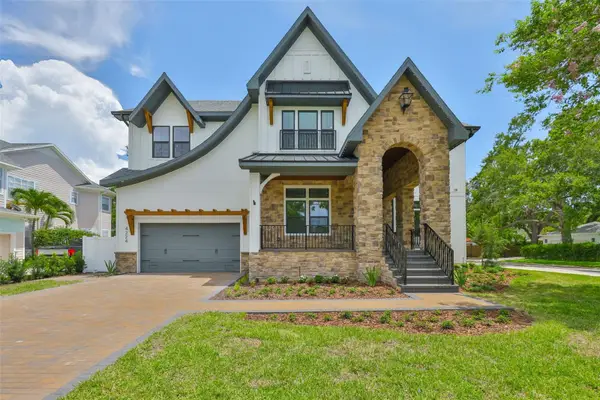 $2,849,000Pending5 beds 6 baths4,672 sq. ft.
4224 W Corona Street, TAMPA, FL 33629
MLS# TB8378803Listed by: CENTURY 21 LIST WITH BEGGINS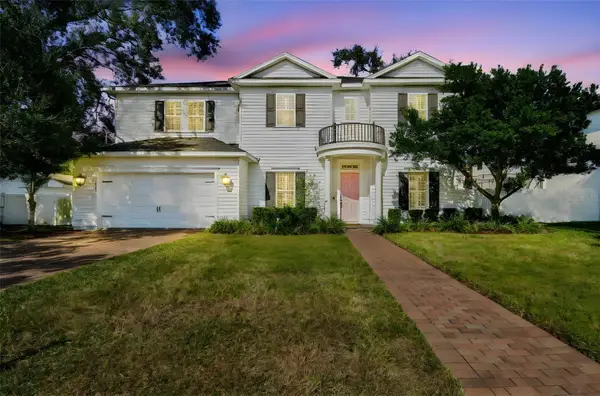 $2,229,000Active6 beds 5 baths4,148 sq. ft.
4105 W Corona Street, TAMPA, FL 33629
MLS# TB8451121Listed by: COASTAL PROPERTIES GROUP INTER $535,000Pending3 beds 2 baths1,419 sq. ft.
3710 W Griflow Street, TAMPA, FL 33629
MLS# TB8361939Listed by: MIRANDA LANDA REALTY GROUP LLC $1,425,000Active4 beds 4 baths3,241 sq. ft.
4302 W San Pedro Street, TAMPA, FL 33629
MLS# TB8353204Listed by: SMITH & ASSOCIATES REAL ESTATE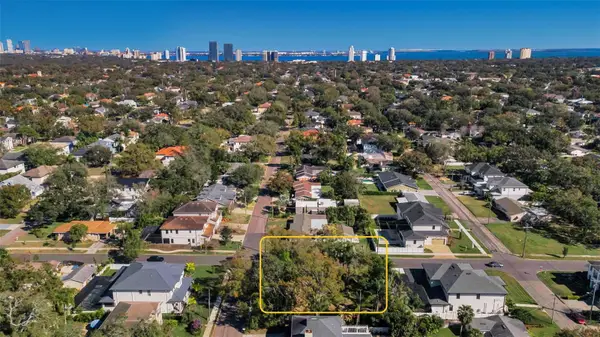 $1,100,000Active0.28 Acres
4202 W Leona Street, TAMPA, FL 33629
MLS# TB8345595Listed by: REALTY CONCEPTS OF PINELLAS $2,150,000Active5 beds 5 baths4,094 sq. ft.
4009 W Euclid Avenue, TAMPA, FL 33629
MLS# TB8339506Listed by: KNOWN REAL ESTATE LLC $2,275,000Active6 beds 5 baths4,248 sq. ft.
3814 W Tacon Street, TAMPA, FL 33629
MLS# TB8315795Listed by: CENTURY 21 LIST WITH BEGGINS
Local realty services provided by:CENTURY 21 Results
The information being provided by Stellar Mls is for the consumer's personal, non-commercial use and may not be used for any purpose other than to identify prospective properties consumer may be interested in purchasing. Any information relating to real estate for sale referenced on this web site comes from the Internet Data Exchange (IDX) program of the Stellar Mls. CENTURY 21 Results is not a Multiple Listing Service (MLS), nor does it offer MLS access. This website is a service of CENTURY 21 Results, a broker participant of Stellar Mls. This web site may reference real estate listing(s) held by a brokerage firm other than the broker and/or agent who owns this web site.
The accuracy of all information, regardless of source, including but not limited to open house information, square footages and lot sizes, is deemed reliable but not guaranteed and should be personally verified through personal inspection by and/or with the appropriate professionals. The data contained herein is copyrighted by Stellar Mls and is protected by all applicable copyright laws. Any unauthorized dissemination of this information is in violation of copyright laws and is strictly prohibited.
Properties in listings may have been sold or may no longer be available.
Copyright 2026 Stellar Mls. All rights reserved.
Popular neighborhoods near Virginia Park, Tampa, FL
Zip codes near Virginia Park, Tampa, FL
- 33602 homes for sale
- 33603 homes for sale
- 33604 homes for sale
- 33605 homes for sale
- 33606 homes for sale
- 33607 homes for sale
- 33609 homes for sale
- 33610 homes for sale
- 33611 homes for sale
- 33612 homes for sale
- 33614 homes for sale
- 33615 homes for sale
- 33616 homes for sale
- 33619 homes for sale
- 33629 homes for sale
- 33634 homes for sale
- 33702 homes for sale
- 33703 homes for sale
- 33716 homes for sale
- 33762 homes for sale
Counties near Virginia Park, Tampa, FL
- Charlotte County homes for sale
- Citrus County homes for sale
- DeSoto County homes for sale
- Hardee County homes for sale
- Hernando County homes for sale
- Highlands County homes for sale
- Hillsborough County homes for sale
- Lake County homes for sale
- Lee County homes for sale
- Levy County homes for sale
- Manatee County homes for sale
- Marion County homes for sale
- Orange County homes for sale
- Osceola County homes for sale
- Pasco County homes for sale
- Pinellas County homes for sale
- Polk County homes for sale
- Sarasota County homes for sale
- Seminole County homes for sale
- Sumter County homes for sale
Protect your home and budget from life's surprises with an Assurant Home Warranty, backed by a partner that supports you through every step of homeownership. Explore Plans.
©2026 Century 21 Real Estate LLC. All rights reserved. CENTURY 21®, the CENTURY 21 Logo and C21® are service marks owned by Century 21 Real Estate LLC. Century 21 Real Estate LLC fully supports the principles of the Fair Housing Act and the Equal Opportunity Act. Each office is independently owned and operated. Listing information is deemed reliable but not guaranteed accurate.