- Amerige Heights, Fullerton homes for sale
- Anaheim Hills, Anaheim homes for sale
- Atwood, Placentia homes for sale
- Avocado Heights, La Puente homes for sale
- Blackstone, Brea homes for sale
- Bryant Ranch, Yorba Linda homes for sale
- Chino, Chino homes for sale
- Harvest at Upland, Upland homes for sale
- Hidden Hills, Yorba Linda homes for sale
- Michigan Park, Whittier homes for sale
- North Central Industrial Area, Anaheim homes for sale
- North Whittier, Whittier homes for sale
- Norumbega, Monrovia homes for sale
- Rancho Santa Ana del Chino, Ontario homes for sale
- Riverbend, Orange homes for sale
- The San Gabriel Valley, La Puente homes for sale
- Tonner Hills, Brea homes for sale
- Village Oaks, Chino Hills homes for sale
- Vista del Verde, Yorba Linda homes for sale
- Windmill Creek, Chino Hills homes for sale
Walnut, CA - homes for sale
78 of 78 results displayed
- New
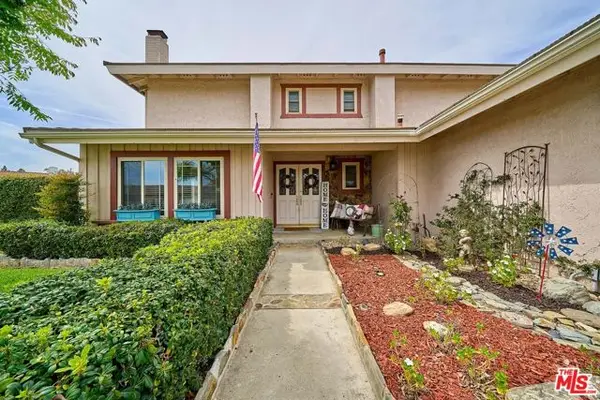 $1,158,000Active4 beds 3 baths1,859 sq. ft.
19819 Camino Arroyo, Walnut, CA 91789
MLS# CL26669557Listed by: NET PROPERTIES - New
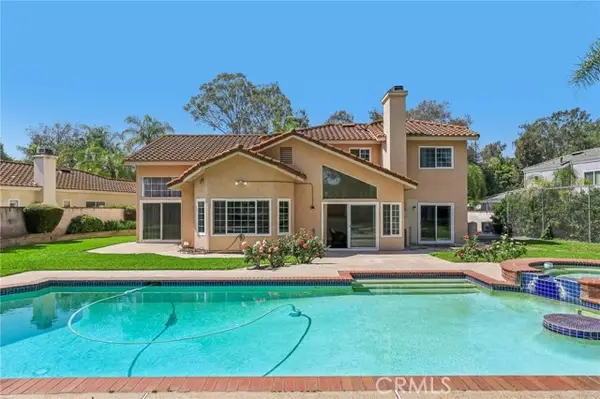 $1,950,000Active4 beds 4 baths2,789 sq. ft.
970 Estate Court, Walnut, CA 91789
MLS# CROC26062014Listed by: HARVEST REALTY DEVELOPMENT - New
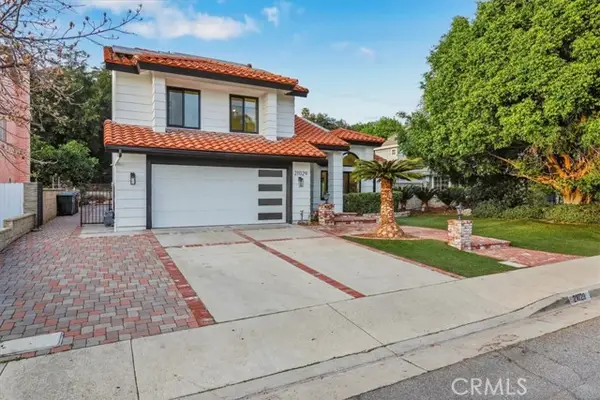 $1,688,888Active5 beds 3 baths2,500 sq. ft.
21029 Stoddard Wells, Walnut, CA 91789
MLS# CROC26063523Listed by: KELLER WILLIAMS REALTY IRVINE - New
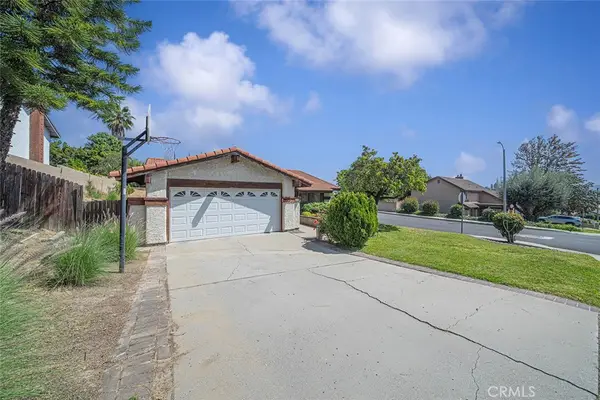
 $899,888Active3 beds 2 baths1,487 sq. ft.
540 Citadel Drive, Walnut, CA 91789
MLS# CV26062843Listed by: CENTURY 21 MASTERS - New
 $502,888Active2 beds 1 baths878 sq. ft.
826 Silver Fir Road, Walnut, CA 91789
MLS# CRTR26059982Listed by: RE/MAX TOP PRODUCERS - New
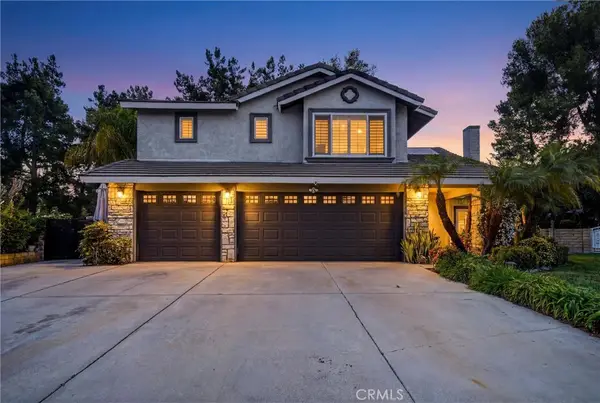
 $2,790,000Active4 beds 5 baths4,562 sq. ft.
19678 Three Oaks, Walnut, CA 91789
MLS# CV26062143Listed by: CENTURY 21 MASTERS - New
 $1,000,000Active0.48 Acres
0 Gartel, Walnut, CA 91789
MLS# CRTR26063738Listed by: 168 REALTY INC.  $1,125,424Pending3 beds 3 baths1,570 sq. ft.
242 Solaro Court, Walnut, CA 91789
MLS# CRTR26063068Listed by: CBC SALES CORPORATION- New
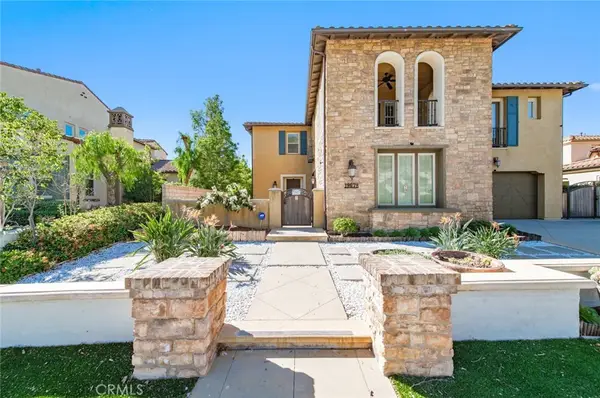
 $1,788,000Active4 beds 4 baths2,579 sq. ft.
673 Castlehill Drive, Walnut, CA 91789
MLS# CRAR26056234Listed by: EXP REALTY OF CALIFORNIA INC - New
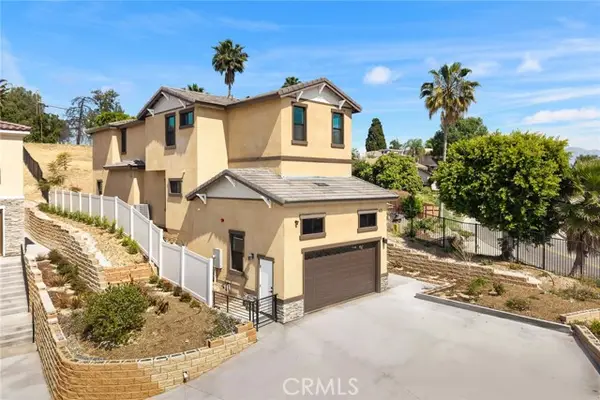
 $1,359,683Active4 beds 3 baths1,927 sq. ft.
22025 Florence Circle, Walnut, CA 91789
MLS# CRTR26063093Listed by: CBC SALES CORPORATION  $1,209,900Pending3 beds 3 baths1,570 sq. ft.
261 Vemero Court, Walnut, CA 91789
MLS# CRTR26063025Listed by: CBC SALES CORPORATION- New
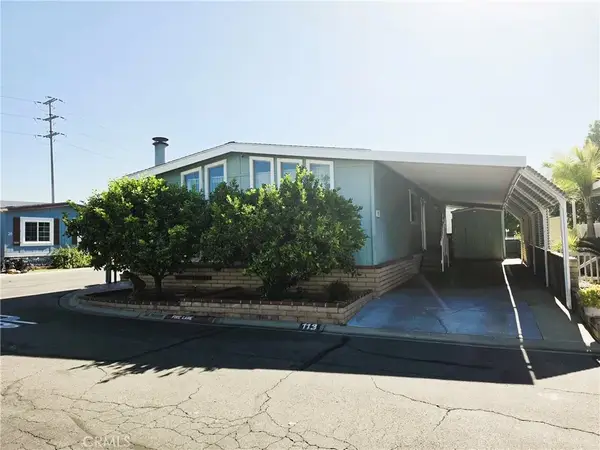 $240,000Active3 beds 2 baths1,344 sq. ft.
21217 E Washington #113, Walnut, CA 91789
MLS# TR26061106Listed by: PINNACLE REAL ESTATE GROUP - New
 $538,354Active2 beds 2 baths1,100 sq. ft.
835 Francesca #201, Walnut, CA 91789
MLS# TR26061578Listed by: RE/MAX CHAMPIONS 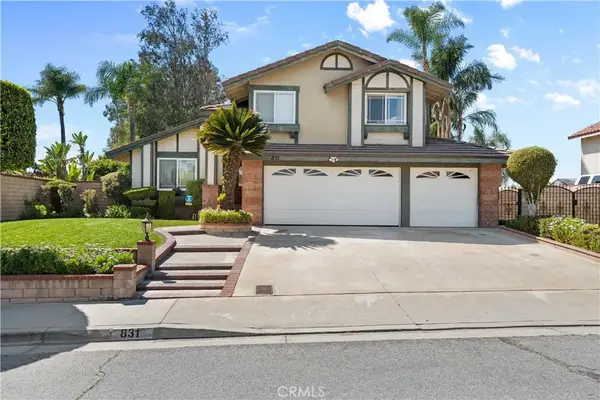 $1,145,888Active4 beds 3 baths1,785 sq. ft.
831 Colusa Drive, Walnut, CA 91789
MLS# CV26060027Listed by: KELLER WILLIAMS COVINA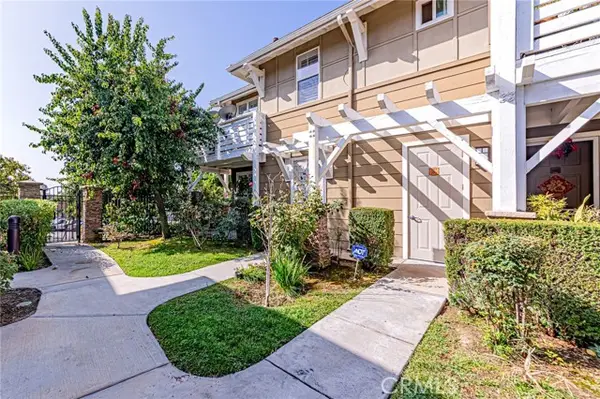 $449,000Active2 beds 2 baths1,030 sq. ft.
735 Francesca #202, Walnut, CA 91789
MLS# CRRS26059591Listed by: PARADISE REALTY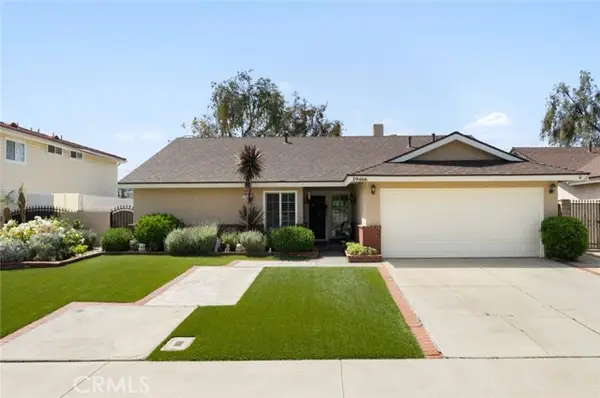 $899,888Pending3 beds 2 baths1,453 sq. ft.
19466 Avenida Del Campo, Walnut, CA 91789
MLS# CRCV26053429Listed by: NEST REAL ESTATE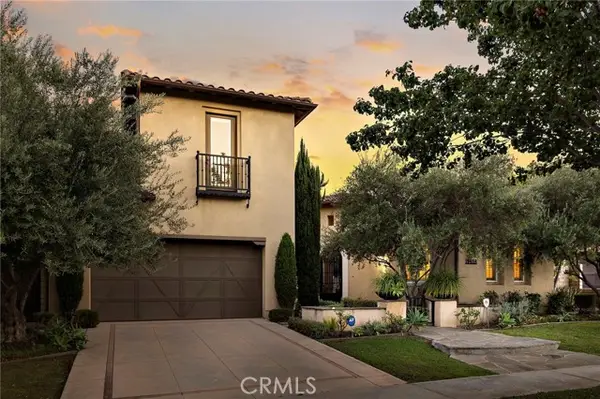 $2,550,000Active4 beds 5 baths4,404 sq. ft.
19458 Raptor Court, Walnut, CA 91789
MLS# CROC26053445Listed by: LATITUDE 33 REAL ESTATE $1,049,800Active4 beds 2 baths1,582 sq. ft.
20672 Buckland Dr, Walnut, CA 91789
MLS# CRTR26052985Listed by: LPT REALTY, INC $1,258,000Active2 beds 3 baths2,212 sq. ft.
21530 Magnolia, Walnut, CA 91789
MLS# TR26048893Listed by: 168 REALTY INC. $1,025,000Active4 beds 2 baths1,786 sq. ft.
602 Lone Eagle, Walnut, CA 91789
MLS# CRCV26051968Listed by: RE/MAX MASTERS REALTY $1,950,000Active5 beds 3 baths2,755 sq. ft.
931 Sky Meadow, Walnut, CA 91789
MLS# CRTR26050399Listed by: GARY TAM- Open Sat, 2 to 4pm
 $1,650,000Active5 beds 3 baths2,937 sq. ft.
19201 Lydle Creek Place, Walnut, CA 91789
MLS# WS26046731Listed by: MANREALTY.COM  $1,328,000Active4 beds 4 baths2,435 sq. ft.
309 Camino De Gloria, Walnut, CA 91789
MLS# AR26046358Listed by: IRN REALTY- Open Sat, 2 to 4pm
 $1,999,999Active4 beds 4 baths2,897 sq. ft.
973 Ichabod Way, Walnut, CA 91789
MLS# PW26048097Listed by: LATITUDE 33 REAL ESTATE  $1,880,000Active4 beds 5 baths2,900 sq. ft.
677 Castlehill Drive, Walnut, CA 91789
MLS# WS26048221Listed by: REAL BROKERAGE TECHNOLOGIES $1,820,000Active5 beds 3 baths3,028 sq. ft.
21111 Stockton Pass Rd, Walnut, CA 91789
MLS# TR26045856Listed by: EXP REALTY OF CALIFORNIA INC $1,598,000Active5 beds 3 baths2,919 sq. ft.
330 Amberwood Drive, Walnut, CA 91789
MLS# WS26046066Listed by: IRN REALTY $1,699,999Active5 beds 3 baths2,867 sq. ft.
19933 Hidden Springs, Walnut, CA 91789
MLS# WS26043224Listed by: PINNACLE REAL ESTATE GROUP $1,100,000Pending3 beds 2 baths2,073 sq. ft.
1668 Chestnut Hill, Walnut, CA 91789
MLS# AR26042384Listed by: UNIVERSAL ELITE REALTY- Open Sat, 1 to 4pm
 $3,480,000Active5 beds 4 baths4,981 sq. ft.
1025 N Horseshoe Bend, Walnut, CA 91789
MLS# TR26040330Listed by: REMAX 2000 REALTY  $988,888Pending3 beds 2 baths1,585 sq. ft.
925 Heaton Moor Drive, Walnut, CA 91789
MLS# CV26039084Listed by: COLDWELL BANKER REALTY $959,000Pending4 beds 3 baths1,800 sq. ft.
21002 Cornerstone Drive, Walnut, CA 91789
MLS# CV26038033Listed by: HOMESMART, EVERGREEN REALTY $1,190,000Active4 beds 2 baths1,941 sq. ft.
21203 Fibre Ct, Walnut, CA 91789
MLS# CRWS26026728Listed by: RE/MAX ELITE REALTY $1,680,000Active4 beds 5 baths2,467 sq. ft.
685 Castlehill Drive, Walnut, CA 91789
MLS# CRWS26034993Listed by: REAL BROKERAGE TECHNOLOGIES $1,190,000Active3 beds 2 baths1,724 sq. ft.
596 Vista Rambla, Walnut, CA 91789
MLS# CRTR26034484Listed by: GOGO REALTORS R.H CORP. $1,988,800Active5 beds 5 baths3,736 sq. ft.
805 Silver Valley, Walnut, CA 91789
MLS# CV26027863Listed by: RE/MAX MASTERS REALTY $998,000Active4 beds 3 baths1,629 sq. ft.
779 Summerwood, Walnut, CA 91789
MLS# PW26033401Listed by: T.N.G. REAL ESTATE CONSULTANTS $1,998,000Pending5 beds 5 baths3,563 sq. ft.
19735 Arbor Ridge Drive, Walnut, CA 91789
MLS# TR26030023Listed by: LPT REALTY, INC $3,462,000Active7 beds 9 baths5,293 sq. ft.
19519 Mulberry Drive, Walnut, CA 91789
MLS# CRTR26028662Listed by: COLDWELL BANKER ENVISION $1,200,000Pending2 beds 3 baths1,913 sq. ft.
351 Spur Trail Avenue, Walnut, CA 91789
MLS# CRSR25241825Listed by: MONTELEONE REAL ESTATE,INC $75,000Active2 beds 2 baths
20739 Lycoming, Walnut, CA 91789
MLS# CV26018410Listed by: SABRINA LYNN MILLER, BROKER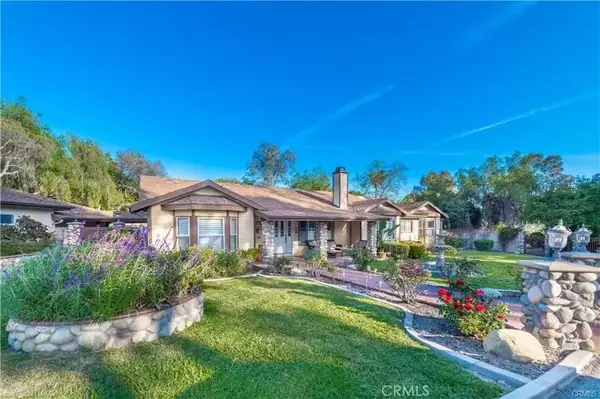 $3,690,000Active3 beds 3 baths2,643 sq. ft.
792 El Vallencito, Walnut, CA 91789
MLS# TR26008962Listed by: REAL BROKER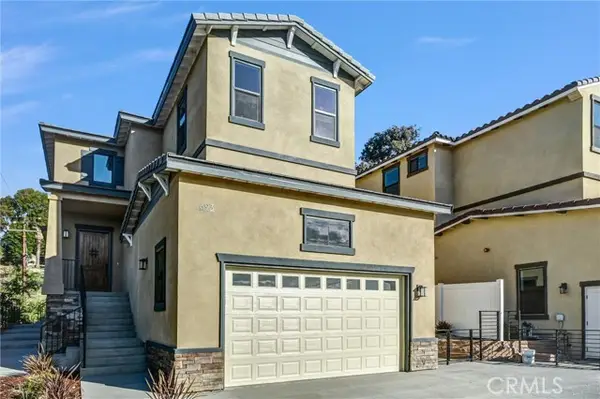 $1,680,000Active4 beds 5 baths2,432 sq. ft.
693 Castlehill Drive, Walnut, CA 91789
MLS# CRWS26007513Listed by: REAL BROKERAGE TECHNOLOGIES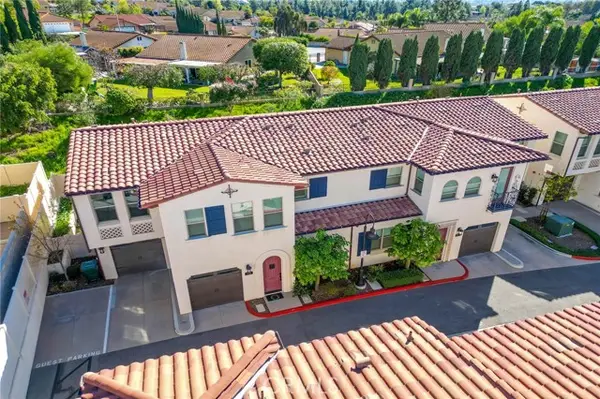 $1,108,888Active3 beds 4 baths2,249 sq. ft.
786 Francesca, Walnut, CA 91789
MLS# CRTR26006754Listed by: IRN REALTY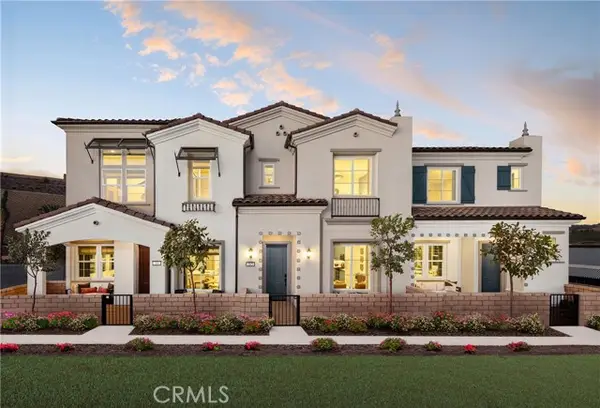 $1,172,122Active3 beds 3 baths1,725 sq. ft.
22060 Florencce Circle, Walnut, CA 91789
MLS# CRTR26003810Listed by: CBC SALES CORPORATION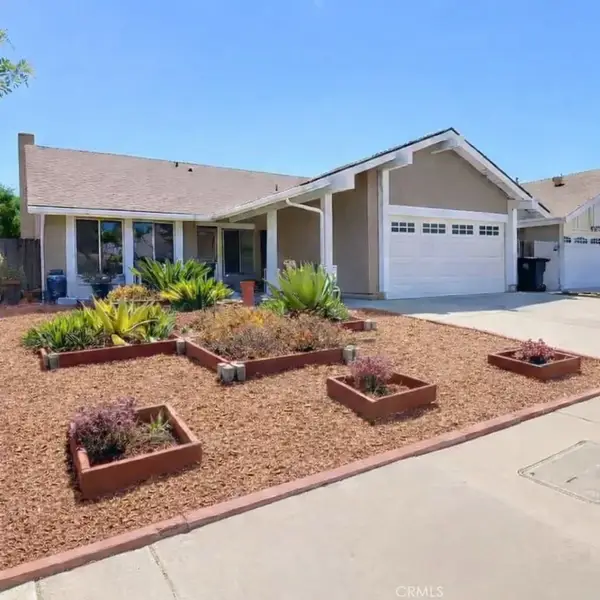 $1,088,000Pending4 beds 2 baths1,812 sq. ft.
21284 Lycoming Street, Walnut, CA 91789
MLS# WS26003483Listed by: PINNACLE REAL ESTATE GROUP- Open Sat, 1 to 4pm
 $2,848,000Active4 beds 5 baths4,298 sq. ft.
19679 Highland Terrace, Walnut, CA 91789
MLS# WS25278431Listed by: PINNACLE REAL ESTATE GROUP 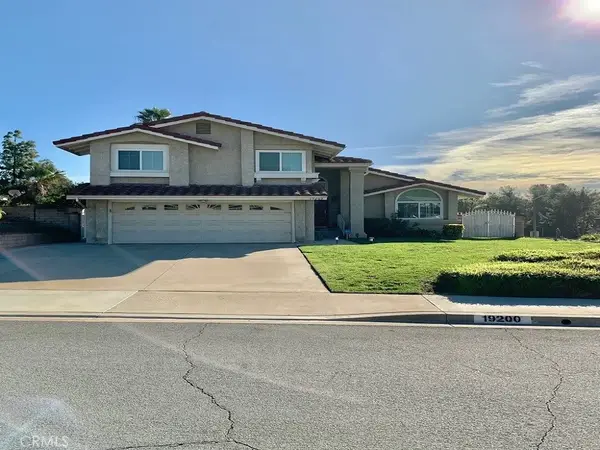 $1,150,000Active4 beds 3 baths1,752 sq. ft.
19200 Kamlyn Lane, Walnut, CA 91789
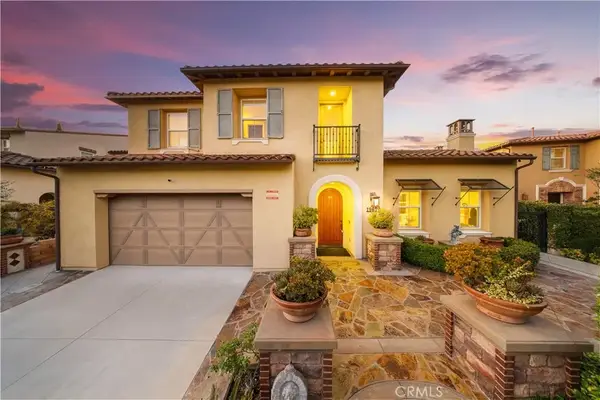
MLS# RS25280072Listed by: AMBERWOOD REAL ESTATE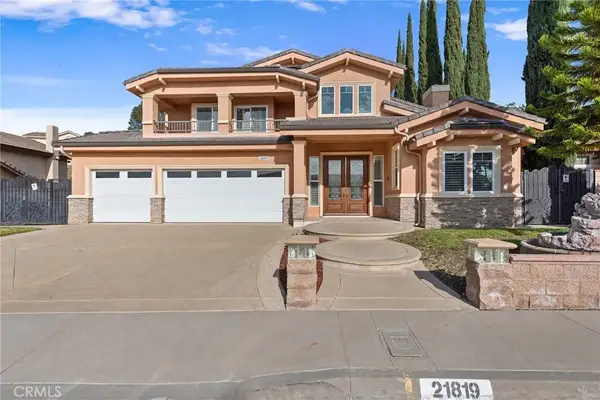 $2,999,999Active5 beds 5 baths4,846 sq. ft.
21819 E Chestnut Court, Walnut, CA 91789
MLS# CV25274398Listed by: KELLER WILLIAMS PREMIER PROPER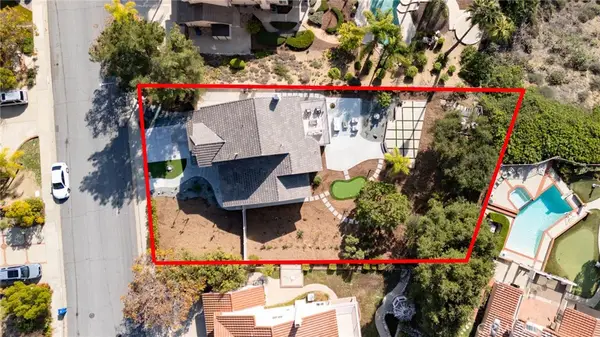 $1,730,000Active4 beds 3 baths2,440 sq. ft.
1941 N Onyx, Walnut, CA 91789
MLS# TR26001462Listed by: RICKY&JESSIE REALTY $179,000Active2 beds 2 baths1,152 sq. ft.
21217 Washington Street #32, Walnut, CA 91789
MLS# TR25266467Listed by: PINNACLE REAL ESTATE GROUP $179,000Active2 beds 2 baths1,152 sq. ft.
21217 Washington #32, Walnut, CA 91789
MLS# TR25266467Listed by: PINNACLE REAL ESTATE GROUP $1,680,000Active4 beds 4 baths2,627 sq. ft.
1359 Point Loma, Walnut, CA 91789
MLS# AR25255093Listed by: REAL BROKERAGE TECHNOLOGIES, INC $5,480,000Active8 beds 9 baths9,094 sq. ft.
19910 Tennessee Tri, Walnut, CA 91789
MLS# TR25252476Listed by: REMAX ELITE REALTY $1,860,000Active4 beds 4 baths3,202 sq. ft.
513 Camino De Gloria, Walnut, CA 91789
MLS# WS25254166Listed by: FIRST TEAM REAL ESTATE $489,000Active2 beds 2 baths1,102 sq. ft.
755 Francesca Drive #201, Walnut, CA 91789
MLS# RS25234411Listed by: THE REAL ESTATE GROUP $1,880,000Active4 beds 5 baths2,858 sq. ft.
681 Castlehill Drive, Walnut, CA 91789
MLS# CRWS25232975Listed by: REAL BROKERAGE TECHNOLOGIES $2,100,000Active6 beds 7 baths3,650 sq. ft.
451 Avenida Esplendor, Walnut, CA 91789
MLS# CRWS25223727Listed by: PINNACLE REAL ESTATE GROUP $2,680,000Active5 beds 5 baths3,665 sq. ft.
20033 E Skyline Dr, Walnut, CA 91789
MLS# CV25226778Listed by: RE/MAX CHAMPIONS $865,000Active0.92 Acres
16 Camelback Drive, Walnut, CA 91789
MLS# CRTR25225222Listed by: REMAX 2000 REALTY $865,000Active0.95 Acres
15 Camelback Drive, Walnut, CA 91789
MLS# CRTR25225104Listed by: REMAX 2000 REALTY $990,000Active3 beds 3 baths1,736 sq. ft.
578 Vista Rambla, Walnut, CA 91789
MLS# TR25199814Listed by: REAL BROKER $1,299,900Pending3 beds 2 baths1,999 sq. ft.
20206 E Walnut Canyon Road, Walnut, CA 91789
MLS# CRCV25178859Listed by: RE/MAX 2000 REALTY $3,280,000Active0.4 Acres
370 Camino De Teodoro, Walnut, CA 91789
MLS# CRTR25165788Listed by: WALTON REALTY INC. $2,880,000Active0.43 Acres
366 Camino De Teodoro, Walnut, CA 91789
MLS# CRTR25165773Listed by: WALTON REALTY INC. $2,280,000Active0.4 Acres
376 Camino De Teodoro, Walnut, CA 91789
MLS# CRTR25165794Listed by: WALTON REALTY INC. $2,280,000Active0.4 Acres
376 Camino De Teodoro, Walnut, CA 91789
MLS# TR25165794Listed by: WALTON REALTY INC. $1,363,112Active4 beds 3 baths1,927 sq. ft.
221 Roma Court, Walnut, CA 91789
MLS# CRTR25170239Listed by: CBC SALES CORPORATION $1,121,720Active3 beds 3 baths1,570 sq. ft.
226 Roma Court, Walnut, CA 91789
MLS# CRTR25170292Listed by: CBC SALES CORPORATION $2,791,161Active5 beds 5 baths3,728 sq. ft.
22085 Manarola Way, Walnut, CA 91789
MLS# CRTR25141096Listed by: CBC SALES CORPORATION $1,995,930Active5 beds 4 baths2,979 sq. ft.
22058 Manarola, Walnut, CA 91789
MLS# CRTR25141152Listed by: CBC SALES CORPORATION $2,410,189Active4 beds 6 baths3,530 sq. ft.
22060 Manarola Way, Walnut, CA 91789
MLS# CRTR25141142Listed by: CBC SALES CORPORATION $850,000Active0.35 Acres
455 Avenida Esplendor, Walnut, CA 91789
MLS# CRWS25106459Listed by: RE/MAX PREMIER/ARCADIA $1,970,000Active5 beds 6 baths3,203 sq. ft.
20824 Fuero Drive, Walnut, CA 91789
MLS# CRWS25008822Listed by: MASTERS REALTY $979,888Active4 beds 2 baths1,592 sq. ft.
180 Ricci Avenue, Walnut, CA 91789
MLS# PW24249232Listed by: WALSH REALTY SERVICES $1,398,000Active4 beds 3 baths2,335 sq. ft.
1371 Point Loma Place, Walnut, CA 91789
MLS# CROC26045666Listed by: KELLER WILLIAMS REALTY IRVINE $3,780,000Active6 beds 7 baths6,282 sq. ft.
20487 Gartel Drive, Walnut, CA 91789
MLS# CRWS26055209Listed by: PACIFIC STERLING REALTY/IRVINE $699,000Active0.33 Acres
387 Bourdet Street, Walnut, CA 91789
MLS# CRAR23186650Listed by: HARVEST REALTY DEVELOPMENT
Local realty services provided by:CENTURY 21 Wildwood Properties, Inc., CENTURY 21 Jordan-Link, CENTURY 21 Affiliated
The information being provided by California Regional MLS (Southern California) is for the consumer's personal, non-commercial use and may not be used for any purpose other than to identify prospective properties consumer may be interested in purchasing. Any information relating to real estate for sale referenced on this web site comes from the Internet Data Exchange (IDX) program of the California Regional MLS (Southern California). CENTURY 21 Jordan-Link is not a Multiple Listing Service (MLS), nor does it offer MLS access. This website is a service of CENTURY 21 Jordan-Link, a broker participant of California Regional MLS (Southern California). This web site may reference real estate listing(s) held by a brokerage firm other than the broker and/or agent who owns this web site.
The accuracy of all information, regardless of source, including but not limited to open house information, square footages and lot sizes, is deemed reliable but not guaranteed and should be personally verified through personal inspection by and/or with the appropriate professionals. The data contained herein is copyrighted by California Regional MLS (Southern California) and is protected by all applicable copyright laws. Any unauthorized dissemination of this information is in violation of copyright laws and is strictly prohibited.
Copyright 2021 California Regional MLS (Southern California). All rights reserved.
This information is deemed reliable but not guaranteed. You should rely on this information only to decide whether or not to further investigate a particular property. BEFORE MAKING ANY OTHER DECISION, YOU SHOULD PERSONALLY INVESTIGATE THE FACTS (e.g. square footage and lot size) with the assistance of an appropriate professional. You may use this information only to identify properties you may be interested in investigating further. All uses except for personal, non-commercial use in accordance with the foregoing purpose are prohibited. Redistribution or copying of this information, any photographs or video tours is strictly prohibited. This information is derived from the Internet Data Exchange (IDX) service provided by San Diego MLS®. Displayed property listings may be held by a brokerage firm other than the broker and/or agent responsible for this display. The information and any photographs and video tours and the compilation from which they are derived is protected by copyright. Compilation © 2020 San Diego MLS®, Inc.
Neighborhoods near Walnut, CA
Zip codes near Walnut, CA
- 90631 homes for sale
- 91706 homes for sale
- 91722 homes for sale
- 91723 homes for sale
- 91724 homes for sale
- 91740 homes for sale
- 91744 homes for sale
- 91745 homes for sale
- 91746 homes for sale
- 91748 homes for sale
- 91765 homes for sale
- 91766 homes for sale
- 91767 homes for sale
- 91768 homes for sale
- 91773 homes for sale
- 91789 homes for sale
- 91790 homes for sale
- 91791 homes for sale
- 91792 homes for sale
- 92821 homes for sale
Popular searches near Walnut, CA
- Baldwin Park homes for sale
- Brea homes for sale
- Charter Oak homes for sale
- Citrus homes for sale
- Covina homes for sale
- Diamond Bar homes for sale
- East San Gabriel Valley homes for sale
- Hacienda Heights homes for sale
- Industry homes for sale
- La Habra Heights homes for sale
- La Puente homes for sale
- Phillips Ranch homes for sale
- Pomona homes for sale
- Rowland Heights homes for sale
- San Dimas homes for sale
- South San Jose Hills homes for sale
- Valinda homes for sale
- Vincent homes for sale
- West Covina homes for sale
- West Puente Valley homes for sale
Protect your home and budget from life's surprises with an Assurant Home Warranty, backed by a partner that supports you through every step of homeownership. Explore Plans.
©2026 Century 21 Real Estate LLC. All rights reserved. CENTURY 21®, the CENTURY 21 Logo and C21® are service marks owned by Century 21 Real Estate LLC. Century 21 Real Estate LLC fully supports the principles of the Fair Housing Act and the Equal Opportunity Act. Each office is independently owned and operated. Listing information is deemed reliable but not guaranteed accurate.