- Alexander Road, Alexander homes for sale
- Alexander Road, Alexander homes for sale
- Chicot, Little Rock homes for sale
- Cloverdale, Little Rock homes for sale
- Governor's Mansion, Little Rock homes for sale
- Martin Luther King, Little Rock homes for sale
- Meadowbrook, Little Rock homes for sale
- Otter Creek, Little Rock homes for sale
- OUR, Little Rock homes for sale
- Pettaway, Little Rock homes for sale
- Quapaw Quarter, Little Rock homes for sale
- South End, Little Rock homes for sale
- Stagecoach, Little Rock homes for sale
- Town and Country, Little Rock homes for sale
- Upper Baseline, Little Rock homes for sale
- Wakefield, Little Rock homes for sale
- West Baseline, Little Rock homes for sale
- Westwood, Little Rock homes for sale
- Windamere, Little Rock homes for sale
- Wright Avenue, Little Rock homes for sale
Warren, AR - homes for sale
23 of 23 results displayed
 $159,000Active3 beds 2 baths1,651 sq. ft.
11 Cardinal, Warren, AR 71671
MLS# 26022283Listed by: KEY REALTY $95,000Active3 beds 1 baths1,059 sq. ft.
1702 W Pine, Warren, AR 71671
MLS# 26019634Listed by: KEY REALTY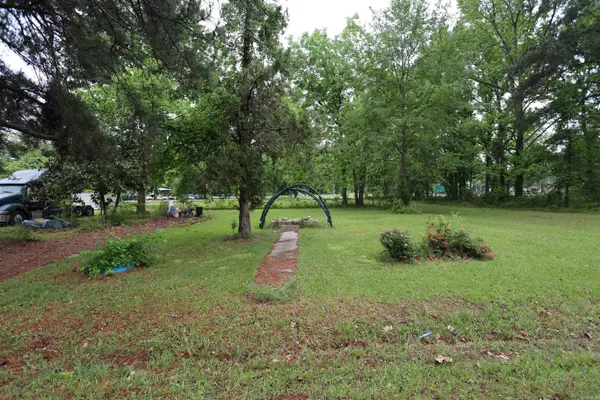 $10,000Active0.5 Acres
1203 Hampton St., Warren, AR 71671
MLS# 26018191Listed by: KEY REALTY $175,000Active3 beds 2 baths1,832 sq. ft.
107 Wheeler, Warren, AR 71671
MLS# 26016069Listed by: KEY REALTY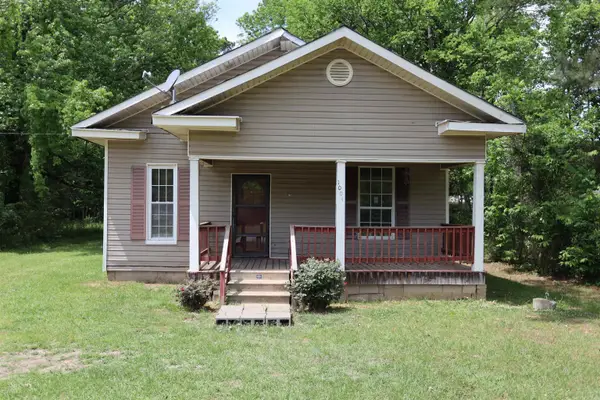 $29,000Active3 beds 1 baths1,218 sq. ft.
1004 S Bradley, Warren City, AR 71671
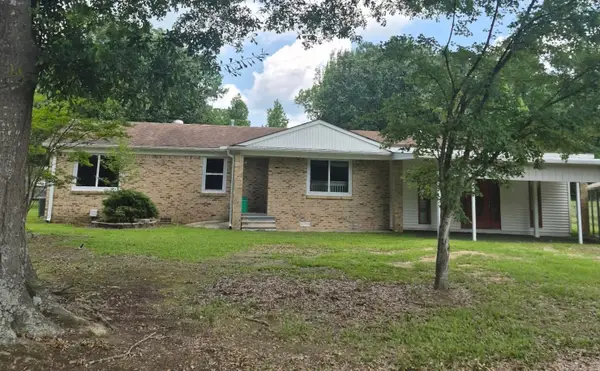
MLS# 26015707Listed by: KEY REALTY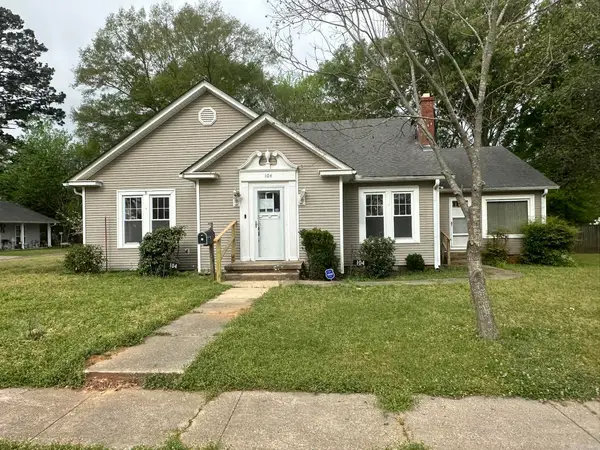 $80,000Active3 beds 2 baths2,444 sq. ft.
104 S Gannaway Street, Warren, AR 71671
MLS# 26015495Listed by: CRYE-LEIKE REALTORS FINANCIAL CENTRE BRANCH $82,000Active3 beds 2 baths2,652 sq. ft.
207 W Central Street, Warren, AR 71671
MLS# 26013430Listed by: ACCORD REALTY $180,000Active3 beds 2 baths1,707 sq. ft.
110 N Munn, Warren, AR 71671
MLS# 26008645Listed by: KEY REALTY $128,000Active4 beds 2 baths2,244 sq. ft.
404 Turner Street, Warren, AR 71671
MLS# 26005853Listed by: CASS MARTIN REALTY $124,900Active3 beds 2 baths1,686 sq. ft.
1108 E Church, Warren, AR 71671
MLS# 26003882Listed by: KEY REALTY $115,000Active3 beds 1 baths1,542 sq. ft.
306 Arkansas, Warren, AR 71671
MLS# 26002359Listed by: KEY REALTY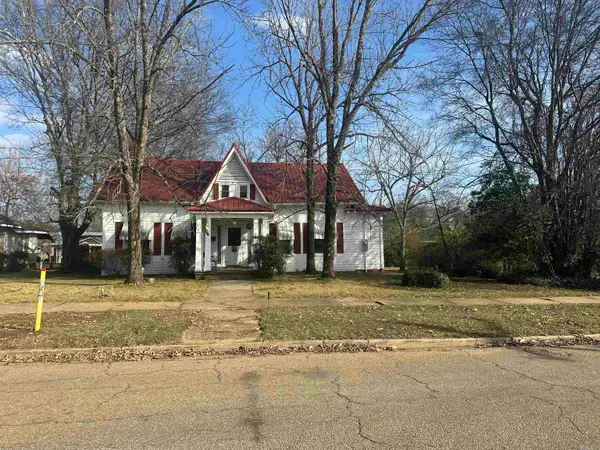 $129,000Active5 beds 2 baths2,626 sq. ft.
301 Chestnut, Warren, AR 71671
MLS# 26000927Listed by: KEY REALTY $15,000Active0.12 Acres
Address Withheld By Seller, Warren, AR 71671
MLS# 25049450Listed by: HOPE & COMPANY REALTY
 $41,000Active3 beds 2 baths1,792 sq. ft.
312 E Cedar Street, Warren, AR 71671
MLS# 25049349Listed by: CENTURY 21 UNITED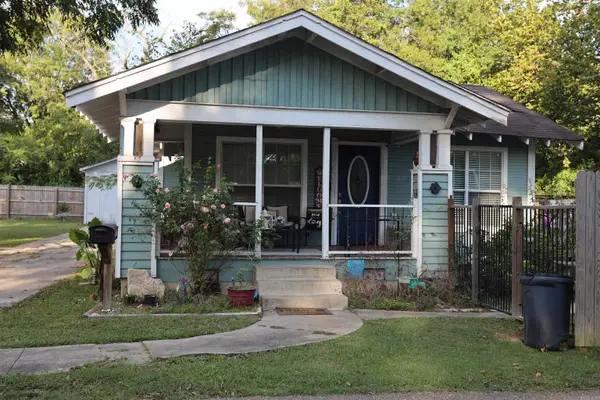 $140,000Active3 beds 2 baths1,128 sq. ft.
407 Oak, Warren, AR 71671
MLS# 25039114Listed by: KEY REALTY $215,000Active5 beds 2 baths3,385 sq. ft.
307 W Pine Street, Warren, AR 71671
MLS# 25035821Listed by: MERCHANTS AND PLANTERS AGENCY $89,500Active3 beds 2 baths1,256 sq. ft.
507 Sturgis St, Warren, AR 71671
MLS# 25030787Listed by: WILKERSON REAL ESTATE COMPANY $129,900Active4 beds 2 baths2,522 sq. ft.
102 N Bradley Street, Warren, AR 71671
MLS# 25009888Listed by: MERCHANTS AND PLANTERS AGENCY $260,000Active-- beds -- baths2,400 sq. ft.
916 S Bradley 7 Road, Warren, AR 71671
MLS# 25006072Listed by: MERCHANTS AND PLANTERS AGENCY $19,750Active1.41 Acres
1.41 acre Berry Street, Other AR, AR 71671
MLS# 1296706Listed by: REMAX REAL ESTATE RESULTS $19,750Active1.41 Acres
1.41 acre Berry Street, Warren, AR 71671
MLS# 25002804Listed by: RE/MAX REAL ESTATE RESULTS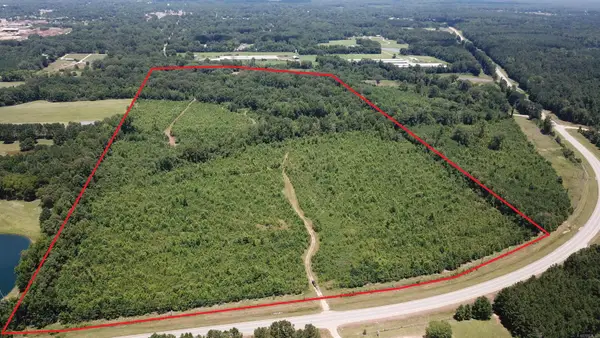 $800,400Active87 Acres
Address Withheld By Seller, Warren, AR 71671
MLS# 24023791Listed by: ARKANSAS LAND COMPANY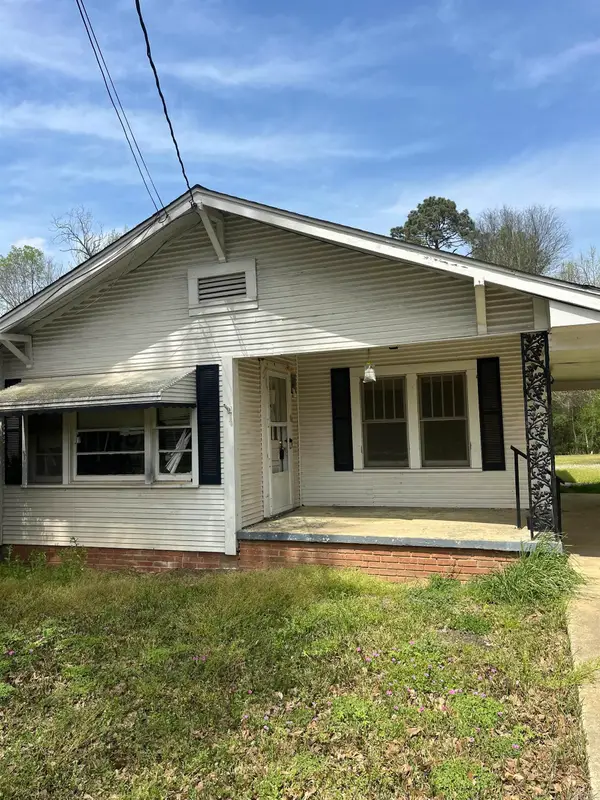 $38,000Active2 beds 1 baths990 sq. ft.
306 Park Lane, Warren, AR 71671
MLS# 25018127Listed by: HOPE & COMPANY REALTY
Local realty services provided by:CENTURY 21 PORTFOLIO, CENTURY 21 Action Realty
Neighborhoods near Warren, AR
Zip codes near Warren, AR
- 71603 homes for sale
- 71631 homes for sale
- 71635 homes for sale
- 71638 homes for sale
- 71639 homes for sale
- 71642 homes for sale
- 71646 homes for sale
- 71647 homes for sale
- 71652 homes for sale
- 71655 homes for sale
- 71660 homes for sale
- 71665 homes for sale
- 71667 homes for sale
- 71671 homes for sale
- 71675 homes for sale
- 71701 homes for sale
- 71720 homes for sale
- 71742 homes for sale
- 71744 homes for sale
- 71765 homes for sale
Popular searches near Warren, AR
- Banks homes for sale
- Clay homes for sale
- Clear Creek homes for sale
- Fordyce homes for sale
- Fountain Hill homes for sale
- Hampton homes for sale
- Hermitage homes for sale
- Kingsland homes for sale
- Kingsland Township homes for sale
- Lee homes for sale
- Marion homes for sale
- Miller homes for sale
- Monticello homes for sale
- New Edinburg homes for sale
- Palestine homes for sale
- Pennington homes for sale
- Rowell homes for sale
- Saline homes for sale
- Smith homes for sale
- Wilmar homes for sale
Protect your home and budget from life's surprises with an Assurant Home Warranty, backed by a partner that supports you through every step of homeownership. Explore Plans.
©2026 Century 21 Real Estate LLC. All rights reserved. CENTURY 21®, the CENTURY 21 Logo and C21® are service marks owned by Century 21 Real Estate LLC. Century 21 Real Estate LLC fully supports the principles of the Fair Housing Act and the Equal Opportunity Act. Each office is independently owned and operated. Listing information is deemed reliable but not guaranteed accurate.