- 82401 homes for sale
- 82410 homes for sale
- 82412 homes for sale
- 82420 homes for sale
- 82421 homes for sale
- 82426 homes for sale
- 82430 homes for sale
- 82431 homes for sale
- 82433 homes for sale
- 82435 homes for sale
- 82441 homes for sale
- 82442 homes for sale
- 82443 homes for sale
- 82501 homes for sale
- 82649 homes for sale
- 82832 homes for sale
- 82833 homes for sale
- 82834 homes for sale
- 82836 homes for sale
- 82842 homes for sale
Worland, WY - homes for sale
38 of 38 results displayed
- New
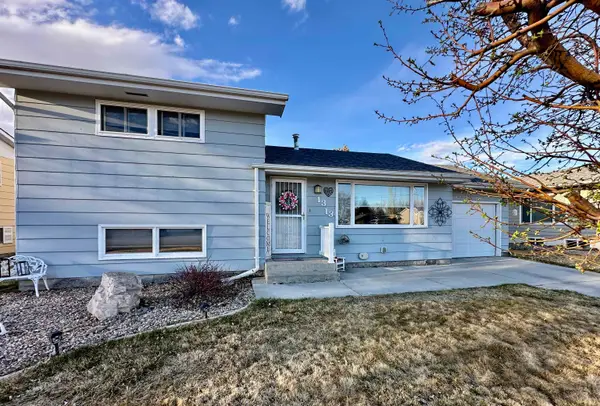 $250,000Active3 beds 1 baths1,312 sq. ft.
1313 Russell Avenue, Worland, WY 82401-2239
MLS# 20261293Listed by: MCGARVIN & TAYLOR REAL ESTATE
- New
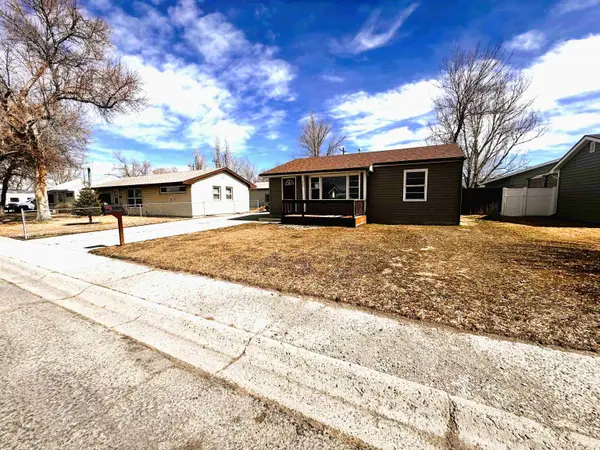 $155,000Active3 beds 2 baths1,632 sq. ft.
817 S 16th Street, Worland, WY 82401
MLS# 20261259Listed by: EXP REALTY, LLC - New
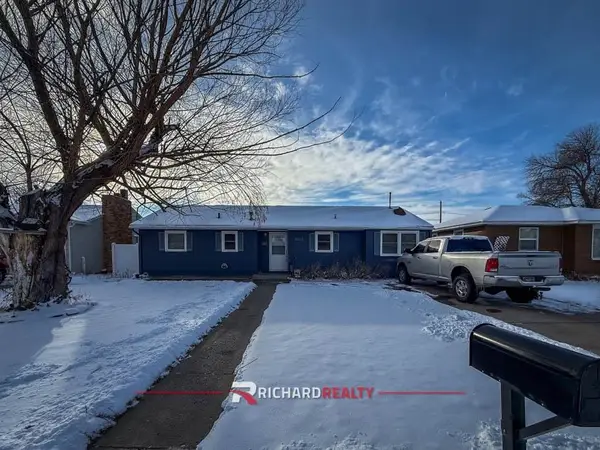 $275,000Active3 beds 2 baths1,212 sq. ft.
800 S 14th Street, Worland, WY 82401
MLS# 20261222Listed by: RICHARD REALTY - New
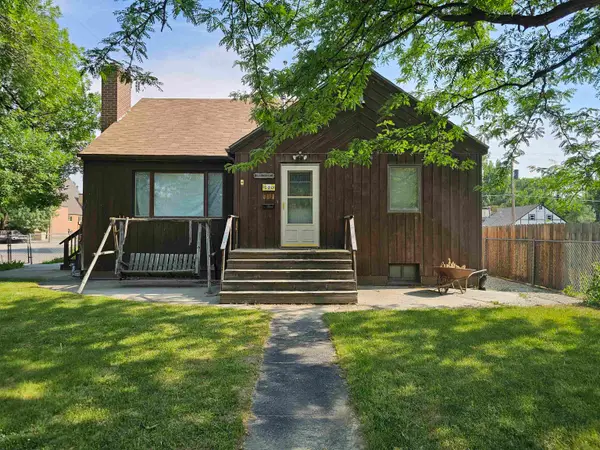 $274,500Active4 beds 2 baths3,484 sq. ft.
520 Obie Sue Avenue, Worland, WY 82401
MLS# 20261153Listed by: MCGARVIN & TAYLOR REAL ESTATE - New
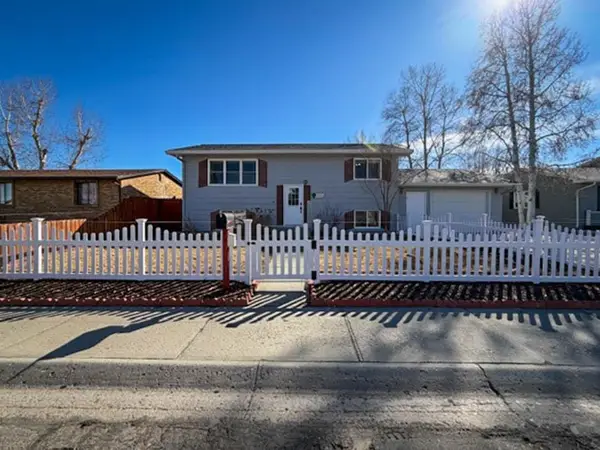 $295,000Active3 beds 1 baths1,800 sq. ft.
1812 Yellowstone Ave, Worland, WY 82401
MLS# 20261135Listed by: RICHARD REALTY  $250,000Active4 beds 2 baths2,904 sq. ft.
1022 Russell Avenue, Worland, WY 82401-4014
MLS# 20260908Listed by: MCGARVIN & TAYLOR REAL ESTATE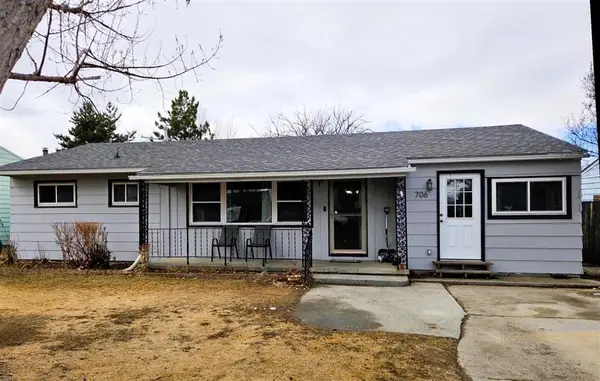 $195,000Pending3 beds 1 baths1,514 sq. ft.
706 S 11th St, Worland, WY 82401
MLS# 10032076Listed by: MCGARVIN & TAYLOR REAL ESTATE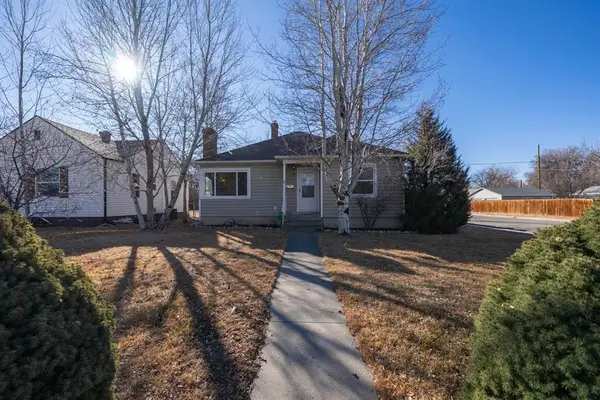 $279,000Active3 beds 2 baths2,016 sq. ft.
1100 Grace Ave, Worland, WY 82401
MLS# 10032047Listed by: RICHARD REALTY $465,000Active-- beds -- baths3,432 sq. ft.
2005 Gregg, Worland, WY 82401-0000
MLS# 20260639Listed by: BERKSHIRE HATHAWAY HOMESERVICES HAKE REALTY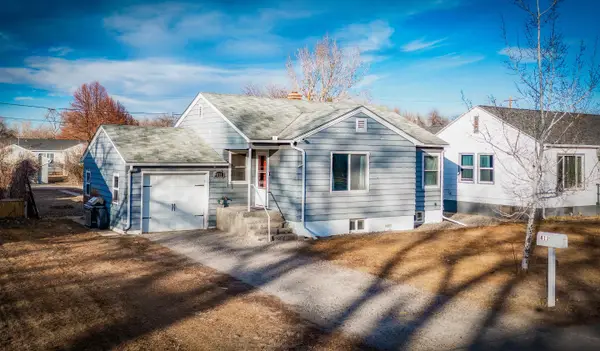 $257,000Active3 beds 1 baths1,824 sq. ft.
811 Howell Ave, Worland, WY 82401
MLS# 20260617Listed by: BERKSHIRE HATHAWAY HOMESERVICES HAKE REALTY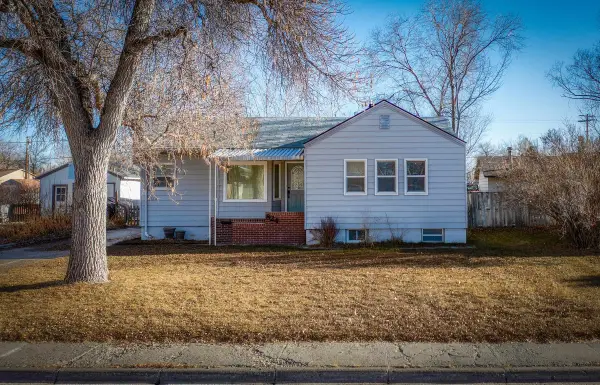 $198,000Active2 beds 1 baths1,808 sq. ft.
824 Park Avenue, Worland, WY 82401
MLS# 20260425Listed by: BERKSHIRE HATHAWAY HOMESERVICES HAKE REALTY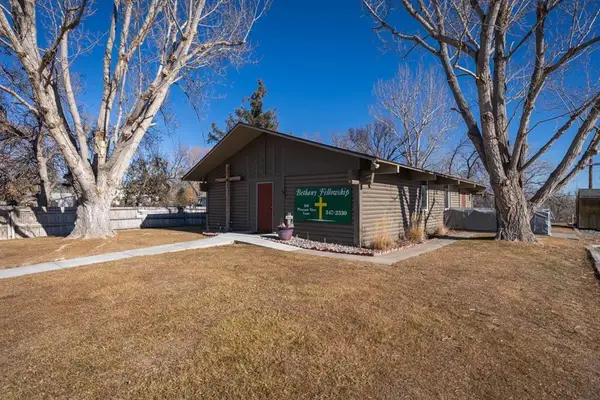 $250,000Active-- beds 1 baths2,374 sq. ft.
160 Pleasant View Dr, Worland, WY 82401
MLS# 10031968Listed by: RICHARD REALTY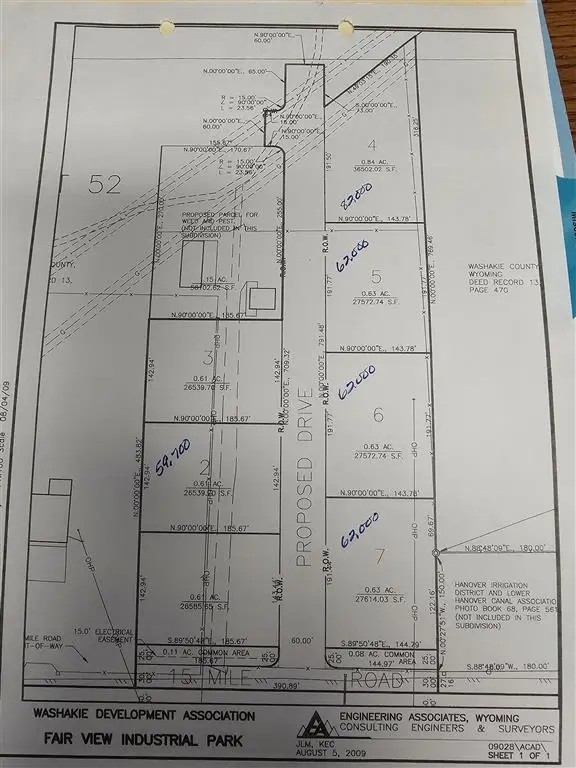 $59,700Active0.61 Acres
121 Rodeo Dr, Worland, WY 82401
MLS# 10031486Listed by: MCGARVIN & TAYLOR REAL ESTATE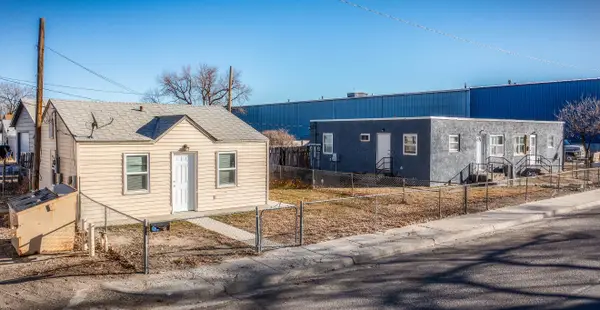 $250,000Active-- beds -- baths2,128 sq. ft.
400, 402, 406 N 8th Street, Worland, WY 82401
MLS# 20260273Listed by: BERKSHIRE HATHAWAY HOMESERVICES HAKE REALTY $325,000Active2 beds 2 baths1,652 sq. ft.
1800 Circle Road, Worland, WY 82401
MLS# 20260226Listed by: BERKSHIRE HATHAWAY HOMESERVICES HAKE REALTY $325,000Active3 beds 1 baths1,758 sq. ft.
1824 Crimson St, Worland, WY 82401
MLS# 20260108Listed by: BERKSHIRE HATHAWAY HOMESERVICES HAKE REALTY $299,500Active3 beds 2 baths1,712 sq. ft.
722 S 13th St, Worland, WY 82401
MLS# 10031932Listed by: MCGARVIN & TAYLOR REAL ESTATE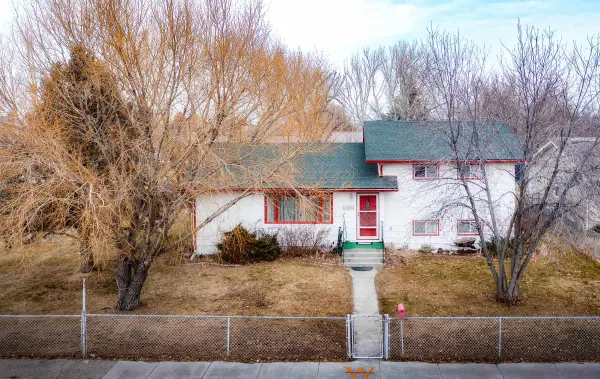 $333,500Active4 beds 2 baths2,096 sq. ft.
1521 Charles Avenue, Worland, WY 82401
MLS# 20260078Listed by: BERKSHIRE HATHAWAY HOMESERVICES HAKE REALTY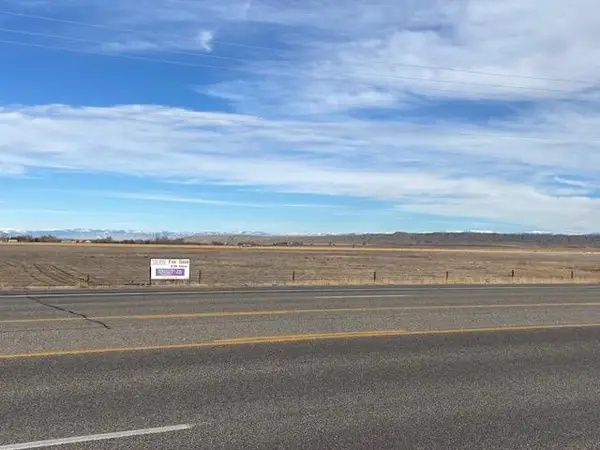 $585,000Active8.56 Acres
E Highway & Paint Brush Lane, Worland, WY 82401-9999
MLS# 20260022Listed by: BERKSHIRE HATHAWAY HOMESERVICES HAKE REALTY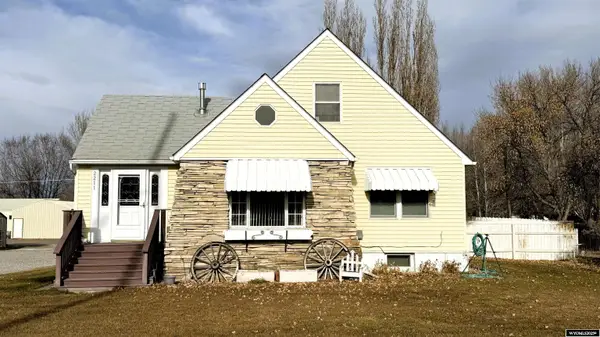 $250,000Active4 beds 1 baths2,646 sq. ft.
2211 Big Horn Avenue, Worland, WY 82401
MLS# 20256401Listed by: MCGARVIN & TAYLOR REAL ESTATE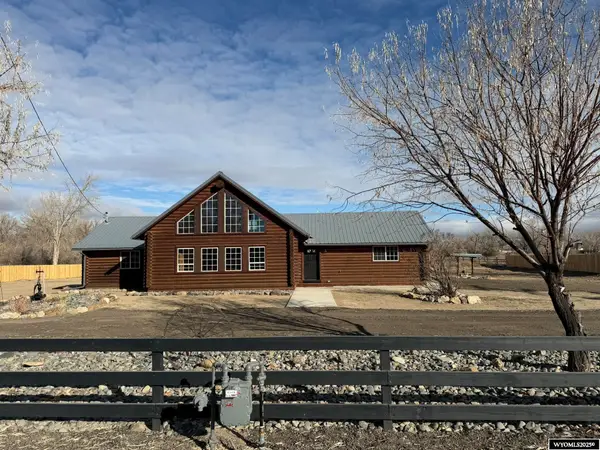 $495,500Active3 beds 2 baths2,162 sq. ft.
311 Bridge Avenue, Worland, WY 82401
MLS# 20256313Listed by: PEAKS TO PRAIRIE REALTY, LLC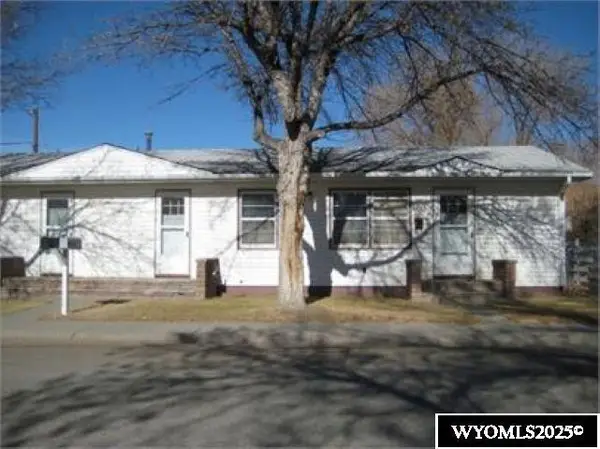 $179,000Active-- beds -- baths1,872 sq. ft.
421 & 423 Rupp Ave, Worland, WY 82401
MLS# 20256226Listed by: BERKSHIRE HATHAWAY HOMESERVICES HAKE REALTY $29,000Active0.16 Acres
129 Grace, Worland, WY 82401
MLS# 20256025Listed by: BERKSHIRE HATHAWAY HOMESERVICES HAKE REALTY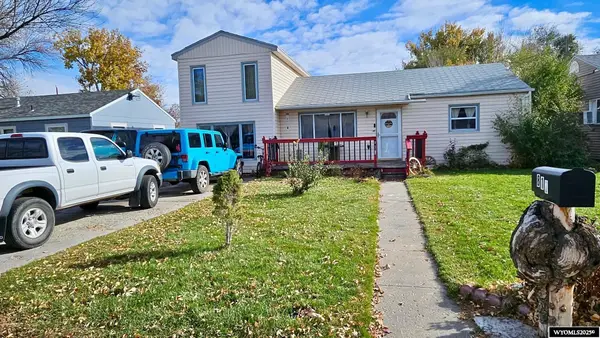 $185,000Active3 beds 1 baths1,543 sq. ft.
817 S 11th Street, Worland, WY 82401
MLS# 20255795Listed by: BERKSHIRE HATHAWAY HOMESERVICES HAKE REALTY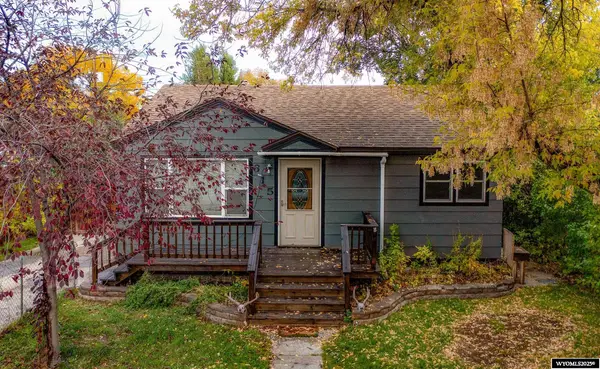 $239,000Active4 beds 2 baths2,064 sq. ft.
615 Holly Avenue, Worland, WY 82401
MLS# 20255522Listed by: BERKSHIRE HATHAWAY HOMESERVICES HAKE REALTY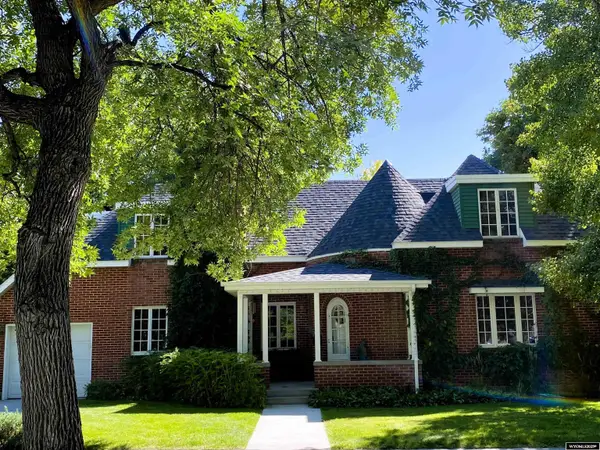 $420,000Active5 beds 2 baths3,140 sq. ft.
1300 Coburn Avenue, Worland, WY 82401
MLS# 20255431Listed by: MCGARVIN & TAYLOR REAL ESTATE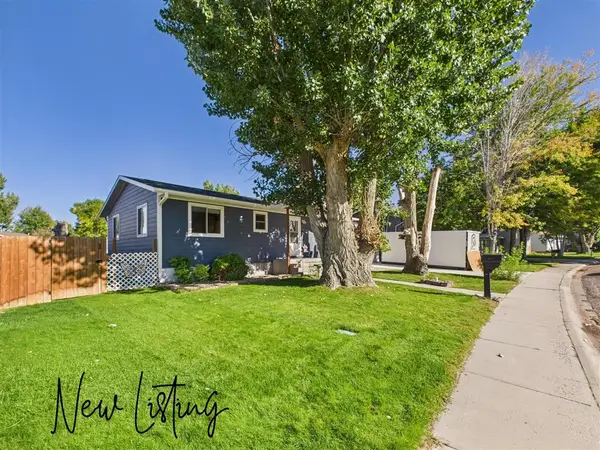 $310,000Active4 beds 2 baths2,080 sq. ft.
225 S 22nd St, Worland, WY 82401
MLS# 10031725Listed by: KESSINGER REAL ESTATE $65,000Active0.15 Acres
2000 Sage Loop, Worland, WY 82401
MLS# 20254978Listed by: BERKSHIRE HATHAWAY HOMESERVICES HAKE REALTY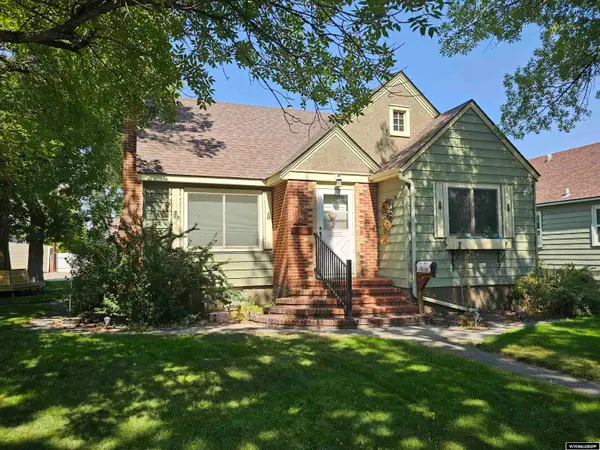 $297,500Active5 beds 1 baths2,766 sq. ft.
1301 Pulliam Avenue, Worland, WY 82401
MLS# 20254782Listed by: MCGARVIN & TAYLOR REAL ESTATE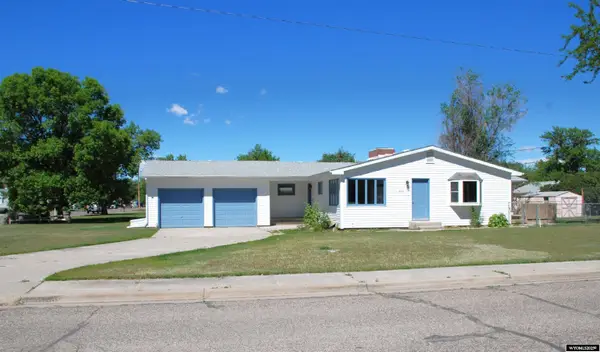 $349,000Active4 beds 1 baths3,072 sq. ft.
821 Obie Sue Avenue, Worland, WY 82401-9999
MLS# 20254252Listed by: BERKSHIRE HATHAWAY HOMESERVICES HAKE REALTY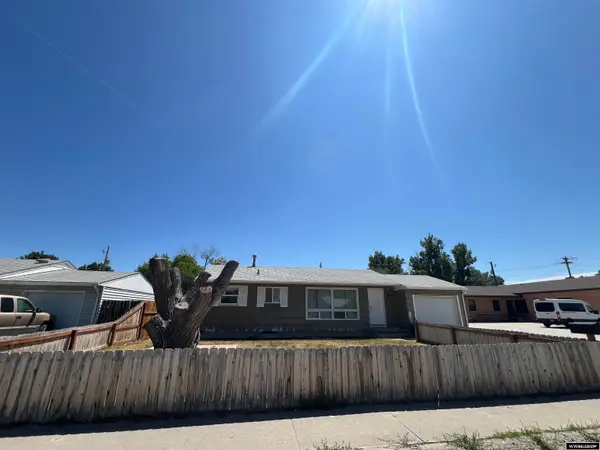 $244,900Active5 beds 1 baths1,824 sq. ft.
813 S 15th Street, Worland, WY 82401
MLS# 20253368Listed by: BERKSHIRE HATHAWAY HOMESERVICES HAKE REALTY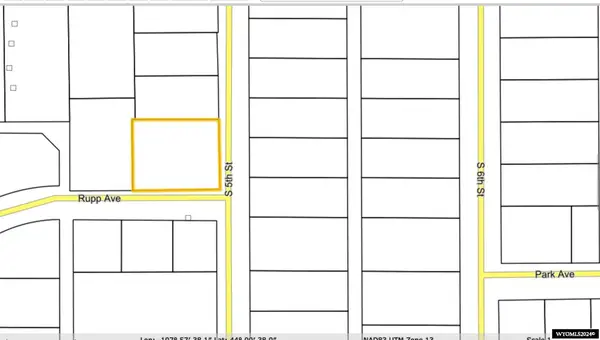 $45,000Active0.28 Acres
624 S 5th Street, Worland, WY 82401
MLS# 20245734Listed by: MCGARVIN & TAYLOR REAL ESTATE $82,000Active0.8 Acres
160 Rodeo Drive, Worland, WY 82401
MLS# 20253640Listed by: MCGARVIN & TAYLOR REAL ESTATE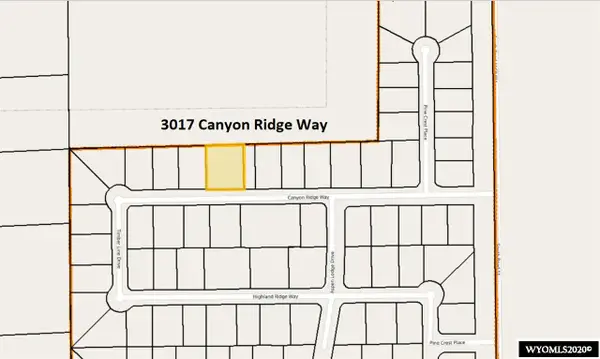 $45,000Active0.41 Acres
3017 Canyon Ridge Way, Worland, WY 82401
MLS# 20205142Listed by: MCGARVIN & TAYLOR REAL ESTATE $54,900Active0.55 Acres
522 N ROAD 11, Worland, WY 82401
MLS# 20205301Listed by: BERKSHIRE HATHAWAY HOMESERVICES HAKE REALTY $62,000Active0.61 Acres
120 Rodeo Drive, Worland, WY 82401
MLS# 20253636Listed by: MCGARVIN & TAYLOR REAL ESTATE $62,000Active0.63 Acres
140 Rodeo Drive, Worland, WY 82401
MLS# 20253637Listed by: MCGARVIN & TAYLOR REAL ESTATE $59,700Active0.61 Acres
141 Rodeo Drive, Worland, WY 82401
MLS# 20253638Listed by: MCGARVIN & TAYLOR REAL ESTATE
Local realty services provided by:CENTURY 21 BHJ Realty, Inc.
Zip codes near Worland, WY
Popular searches near Worland, WY
- Basin homes for sale
- Byron homes for sale
- Central Big Horn homes for sale
- Cody homes for sale
- Greybull homes for sale
- Kirby homes for sale
- Lovell homes for sale
- Lucerne homes for sale
- Meeteetse homes for sale
- North Big Horn homes for sale
- Powell homes for sale
- Shell homes for sale
- Sheridan South homes for sale
- Sheridan West homes for sale
- Shoshoni homes for sale
- South Big Horn homes for sale
- Story homes for sale
- Ten Sleep homes for sale
- Thermopolis homes for sale
- Thermopolis West homes for sale
Protect your home and budget from life's surprises with an Assurant Home Warranty, backed by a partner that supports you through every step of homeownership. Explore Plans.
©2026 Century 21 Real Estate LLC. All rights reserved. CENTURY 21®, the CENTURY 21 Logo and C21® are service marks owned by Century 21 Real Estate LLC. Century 21 Real Estate LLC fully supports the principles of the Fair Housing Act and the Equal Opportunity Act. Each office is independently owned and operated. Listing information is deemed reliable but not guaranteed accurate.