- Aldie homes for sale
- Brentsville homes for sale
- Bristow homes for sale
- Broad Run homes for sale
- Bull Run homes for sale
- Bull Run Mountain Estates homes for sale
- Catlett homes for sale
- Center homes for sale
- Gainesville homes for sale
- Haymarket homes for sale
- Innovation homes for sale
- Linton Hall homes for sale
- Marshall homes for sale
- Middleburg homes for sale
- New Baltimore homes for sale
- Nokesville homes for sale
- Scott homes for sale
- Stone Ridge homes for sale
- The Plains homes for sale
- Warrenton homes for sale
20137, VA - homes for sale
17 of 17 results displayed
 $999,900Active5 beds 4 baths4,279 sq. ft.
7817 Holston Ln, BROAD RUN, VA 20137
MLS# VAFQ2021732Listed by: MARKETPLACE REALTY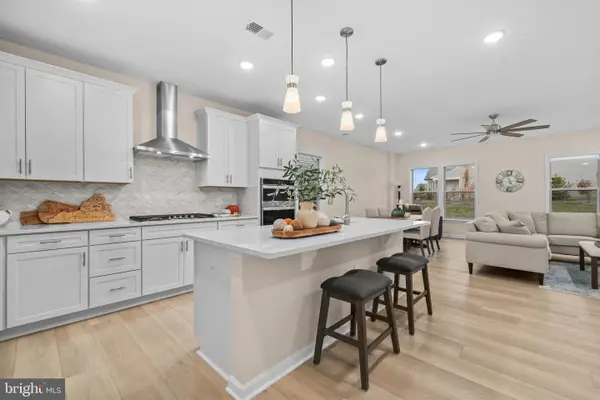 $799,000Active3 beds 3 baths2,236 sq. ft.
6266 Zinnia Ln, HAYMARKET, VA 20169
MLS# VAPW2115894Listed by: REDFIN CORPORATION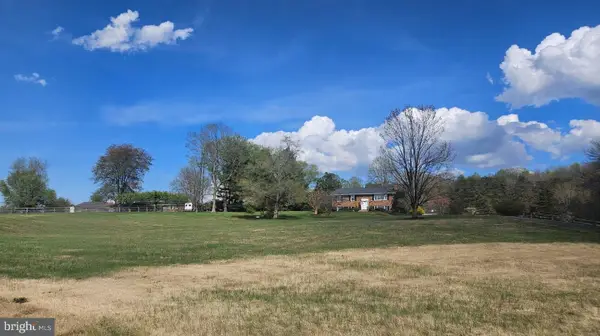 $750,000Pending4 beds 3 baths2,357 sq. ft.
6163 Georgetown Rd, BROAD RUN, VA 20137
MLS# VAFQ2021082Listed by: SAMSON PROPERTIES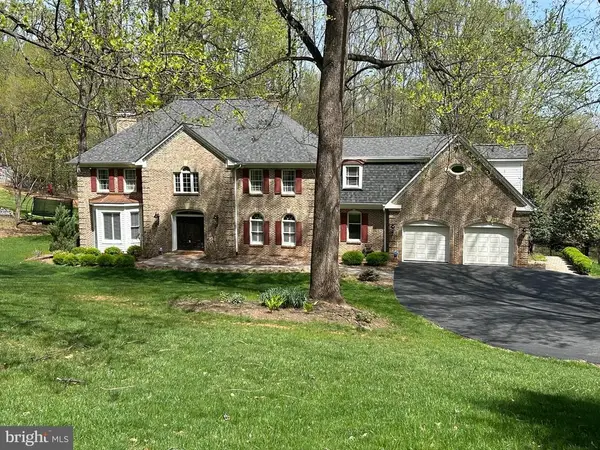 $1,349,000Active4 beds 5 baths6,444 sq. ft.
5828 Hunton Wood Dr, Broad Run, VA 20137
MLS# VAFQ2021454Listed by: SAMSON PROPERTIES $1,349,000Pending4 beds 5 baths5,426 sq. ft.
5828 Hunton Wood Dr, BROAD RUN, VA 20137
MLS# VAFQ2021454Listed by: SAMSON PROPERTIES $795,000Pending4 beds 3 baths2,316 sq. ft.
6248 Zinnia Ln, HAYMARKET, VA 20169
MLS# VAPW2116322Listed by: PEARSON SMITH REALTY LLC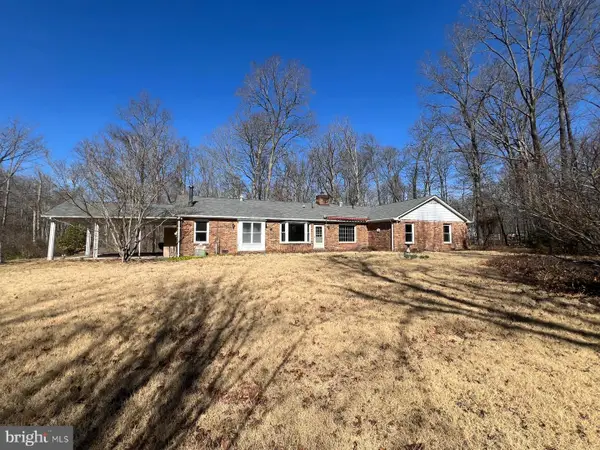 $815,000Pending3 beds 3 baths2,891 sq. ft.
5709 Turner Rd, BROAD RUN, VA 20137
MLS# VAPW2115932Listed by: CASAMERICA REAL ESTATE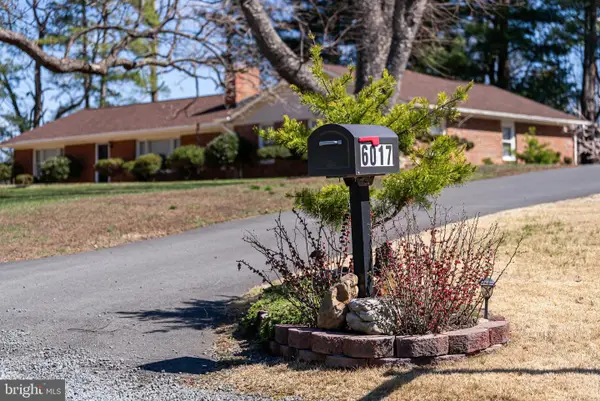 $719,900Pending3 beds 3 baths3,573 sq. ft.
6017 Wheeler Ln, BROAD RUN, VA 20137
MLS# VAPW2114336Listed by: PACIFIC REALTY $679,000Active3 beds 3 baths2,213 sq. ft.
6312 Virginia Bluebell Ln, HAYMARKET, VA 20169
MLS# VAPW2114944Listed by: RE/MAX GATEWAY, LLC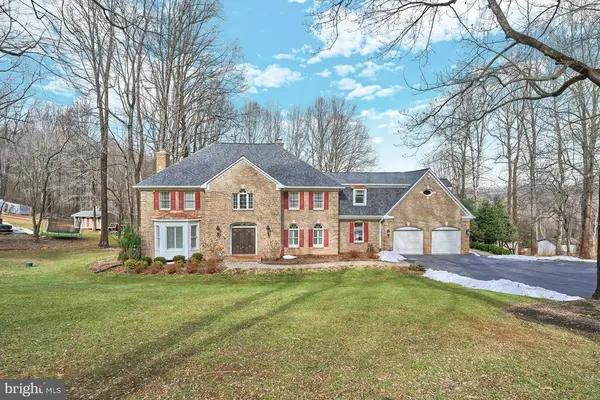 $1,450,000Active4 beds 5 baths6,444 sq. ft.
5828 Hunton Wood Dr, Broad Run, VA
MLS# VAFQ2020112Listed by: SAMSON PROPERTIES $200,000Active12.29 Acres
Snow Mountain Rd, Broad Run, VA
MLS# VAFQ2019986Listed by: WOLFORD AND ASSOCIATES REALTY LLC $200,000Pending12.29 Acres
Lot 7 Snow Mountain Rd, BROAD RUN, VA 20137
MLS# VAFQ2019986Listed by: WOLFORD AND ASSOCIATES REALTY LLC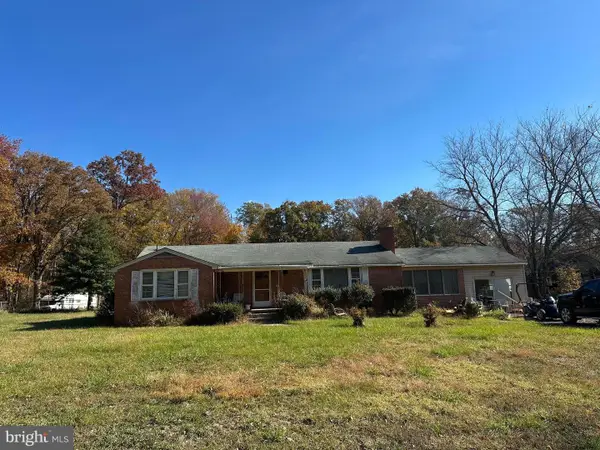
 $895,000Active3 beds 1 baths3,431 sq. ft.
16122 Thoroughfare Rd, BROAD RUN, VA 20137
MLS# VAPW2106976Listed by: CENTURY 21 REDWOOD REALTY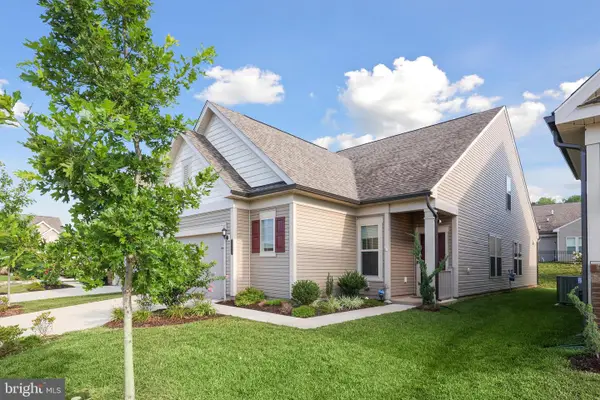 $749,999Active3 beds 2 baths2,316 sq. ft.
15726 Rose Ellene Ln, HAYMARKET, VA 20169
MLS# VAPW2109948Listed by: REDFIN CORPORATION $799,000Active4 beds 2 baths3,628 sq. ft.
5377 Colt Dr, Broad Run, VA
MLS# VAFQ2017238Listed by: RE/MAX GATEWAY $779,000Active3 beds 2 baths
6735 Beverly Rd, BROAD RUN, VA 20137
MLS# VAPW2091792Listed by: COLDWELL BANKER REALTY $892,900Pending4 beds 3 baths2,785 sq. ft.
6508 Beverly Rd, BROAD RUN, VA 20137
MLS# VAPW2077186Listed by: CENTURY 21 NEW MILLENNIUM
Local realty services provided by:CENTURY 21 Harris Hawkins & Co., CENTURY 21 Realty @ Home
Popular searches near 20137
Popular neighborhoods near 20137
- Arcola, Sterling homes for sale
- Brambleton, Ashburn homes for sale
- Bull Run, Centreville homes for sale
- Bull Run, Manassas homes for sale
- Bull Run Mountain Estates, Haymarket homes for sale
- Compton Village, Centreville homes for sale
- Dominion Valley, Haymarket homes for sale
- Gainesville, Gainesville homes for sale
- Haymarket, Haymarket homes for sale
- Heritage Hunt, Gainesville homes for sale
- Linton Hall, Bristow homes for sale
- Loch Lomond, Manassas homes for sale
- Manassas, Manassas homes for sale
- Middleburg, Middleburg homes for sale
- Nokesville, Nokesville homes for sale
- South Riding, Chantilly homes for sale
- Stone Ridge, Aldie homes for sale
- Sudley, Manassas homes for sale
- The Piedmont Club, Haymarket homes for sale
- Yorkshire, Manassas homes for sale
Counties near Broad Run, 20137
- Alexandria city County homes for sale
- Arlington County homes for sale
- Clarke County homes for sale
- Culpeper County homes for sale
- Fairfax County homes for sale
- Fairfax city County homes for sale
- Falls Church city County homes for sale
- Fauquier County homes for sale
- Frederick County homes for sale
- Fredericksburg city County homes for sale
- Jefferson County homes for sale
- Loudoun County homes for sale
- Manassas city County homes for sale
- Manassas Park city County homes for sale
- Montgomery County homes for sale
- Prince William County homes for sale
- Rappahannock County homes for sale
- Stafford County homes for sale
- Warren County homes for sale
- Winchester city County homes for sale
Protect your home and budget from life's surprises with an Assurant Home Warranty, backed by a partner that supports you through every step of homeownership. Explore Plans.
©2026 Century 21 Real Estate LLC. All rights reserved. CENTURY 21®, the CENTURY 21 Logo and C21® are service marks owned by Century 21 Real Estate LLC. Century 21 Real Estate LLC fully supports the principles of the Fair Housing Act and the Equal Opportunity Act. Each office is independently owned and operated. Listing information is deemed reliable but not guaranteed accurate.