- Arrondale, Wilmington homes for sale
- Beau Rivage, Wilmington homes for sale
- Carolina Beach, Carolina Beach homes for sale
- Carriage Hills, Wilmington homes for sale
- Cypress Parke, Wilmington homes for sale
- Intracoastal Waterway, Wilmington homes for sale
- Kure Beach, Kure Beach homes for sale
- Longleaf Park, Wilmington homes for sale
- Lords Creek, Wilmington homes for sale
- Merestone, Wilmington homes for sale
- Monkey Junction, Wilmington homes for sale
- Myrtle Grove, Wilmington homes for sale
- Pine Hollow, Wilmington homes for sale
- River Oaks, Wilmington homes for sale
- River Road, Wilmington homes for sale
- RiverLights, Wilmington homes for sale
- Silver Lake, Wilmington homes for sale
- Tanglewood, Wilmington homes for sale
- The Cape, Wilmington homes for sale
- Woods Edge, Wilmington homes for sale
Caswell Beach, NC - homes for sale
21 of 21 results displayed
- New
 $899,900Active3 beds 2 baths996 sq. ft.
512 Caswell Beach Road, Oak Island, NC 28465
MLS# 100563218Listed by: RE/MAX AT THE BEACH / OAK ISLAND  $289,000Active0.31 Acres
184 Ryder Cup Way, Caswell Beach, NC 28465
MLS# 100559160Listed by: KELLER WILLIAMS INNOVATE-OKI- New
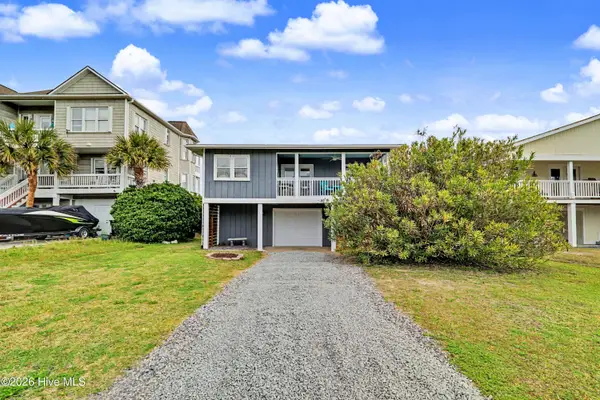
 $799,000Active3 beds 3 baths2,219 sq. ft.
86 Foxfire Trace, Oak Island, NC 28465
MLS# 100561643Listed by: EXP REALTY 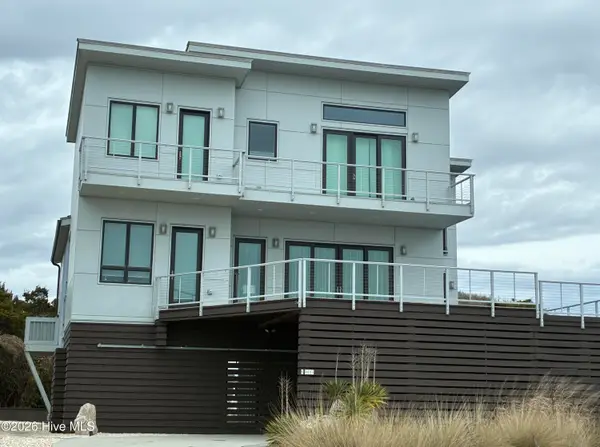 $3,250,000Active4 beds 6 baths3,551 sq. ft.
800 Caswell Beach Road # A, Oak Island, NC 28465
MLS# 100559352Listed by: BERKSHIRE HATHAWAY HOMESERVICES CAROLINA PREMIER PROPERTIES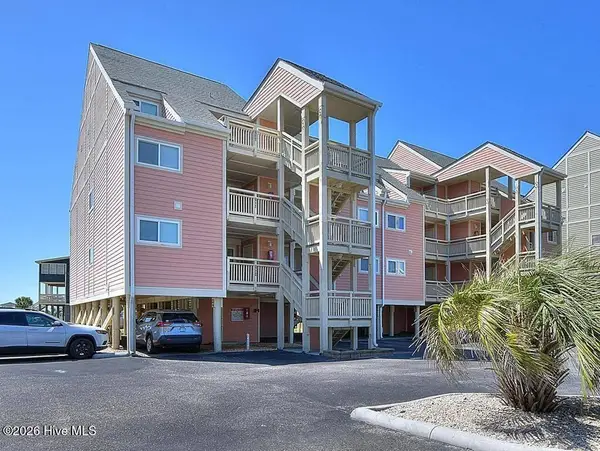 $499,900Active3 beds 2 baths1,001 sq. ft.
1000 Caswell Beach Road #Apt 1501, Oak Island, NC 28465
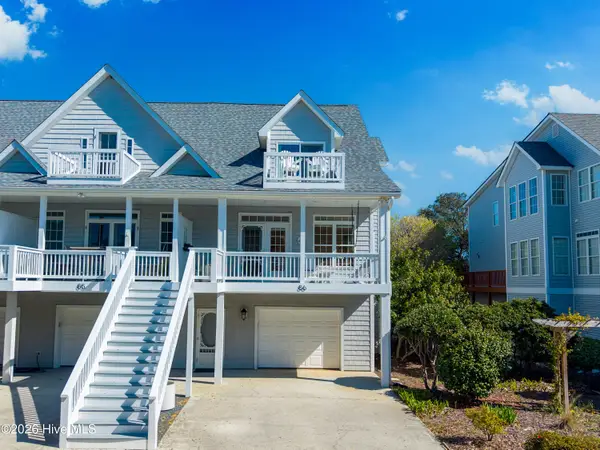
MLS# 100558357Listed by: BETTER BEACH SALES & RENTALS, INC. $550,000Pending3 beds 2 baths1,221 sq. ft.
35 Foxfire Trace, Oak Island, NC 28465
MLS# 100558305Listed by: NORTHROP REALTY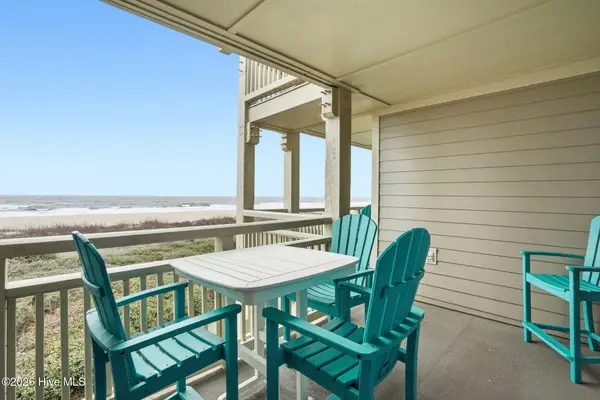 $599,500Pending3 beds 2 baths1,008 sq. ft.
1000 Caswell Beach Road #Apt 1011, Oak Island, NC 28465
MLS# 100557699Listed by: COLDWELL BANKER SEA COAST ADVANTAGE $819,000Active5 beds 3 baths2,202 sq. ft.
99 Oceangreens Lane, Oak Island, NC 28465
MLS# 100551155Listed by: KELLER WILLIAMS INNOVATE-OKI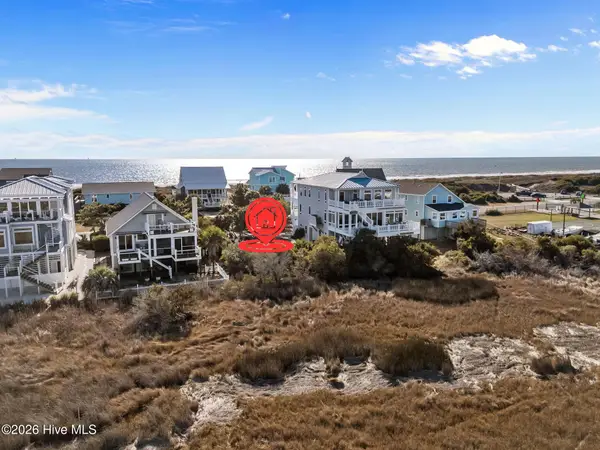 $799,000Active0.23 Acres
218 Caswell Beach Road, Caswell Beach, NC 28465
MLS# 100550406Listed by: NORTHROP REALTY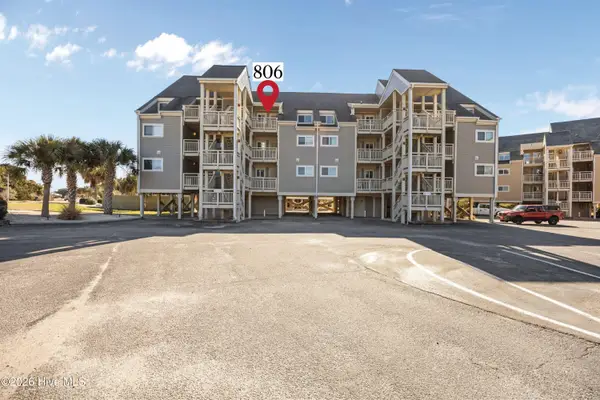 $457,000Active2 beds 1 baths726 sq. ft.
1000 Caswell Beach Road #Apt. 806, Oak Island, NC 28465
MLS# 100550399Listed by: CAROLINA EXCLUSIVES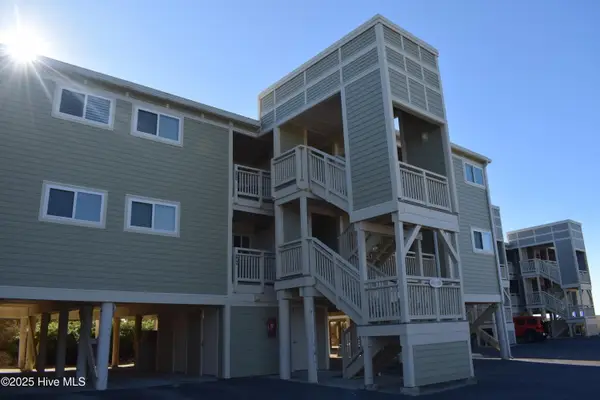 $569,000Active2 beds 2 baths864 sq. ft.
1000 Caswell Beach Road #405, Oak Island, NC 28465
MLS# 100547630Listed by: COASTAL LIGHTS REALTY $1,790,000Active4 beds 3 baths3,652 sq. ft.
220 Caswell Beach Road, Caswell Beach, NC 28465
MLS# 100544368Listed by: PALM REALTY, INC. $669,900Active5 beds 3 baths2,300 sq. ft.
504 Periwinkle Way, Oak Island, NC 28465
MLS# 100542909Listed by: EXP REALTY $515,000Active3 beds 2 baths1,006 sq. ft.
1000 Caswell Beach Road #Apt 801, Oak Island, NC 28465
MLS# 100539847Listed by: DISCOVER NC HOMES $518,000Active2 beds 1 baths711 sq. ft.
1000 Caswell Beach Road #Apt 715, Oak Island, NC 28465
MLS# 100537947Listed by: KELLER WILLIAMS INNOVATE-OKI $499,900Active3 beds 2 baths1,008 sq. ft.
1000 Caswell Beach Road #802, Caswell Beach, NC 28465
MLS# 100537338Listed by: MARGARET RUDD ASSOC/SP $2,149,500Active5 beds 6 baths1,780 sq. ft.
323 Caswell Beach Road, Oak Island, NC 28465
MLS# 100533817Listed by: BETTER BEACH SALES & RENTALS, INC. $486,000Active2 beds 2 baths758 sq. ft.
1000 Caswell Beach Road #1206, Oak Island, NC 28465
MLS# 100533789Listed by: REALTY ONE GROUP DOCKSIDE NORTH $1,820,000Active6 beds 5 baths2,957 sq. ft.
419 Caswell Beach Road, Oak Island, NC 28465
MLS# 100531510Listed by: EXP REALTY $2,295,000Pending5 beds 5 baths3,077 sq. ft.
505 Caswell Beach Road, Caswell Beach, NC 28465
MLS# 100504065Listed by: BETTER BEACH SALES & RENTALS, INC. $1,495,000Active5 beds 6 baths1,966 sq. ft.
108 Caswell Beach Road, Oak Island, NC 28465
MLS# 100494024Listed by: BETTER BEACH SALES & RENTALS, INC.
Local realty services provided by:CENTURY 21 The Realty Group
Neighborhoods near Caswell Beach, NC
Zip codes near Caswell Beach, NC
- 28401 homes for sale
- 28403 homes for sale
- 28405 homes for sale
- 28409 homes for sale
- 28412 homes for sale
- 28420 homes for sale
- 28422 homes for sale
- 28428 homes for sale
- 28449 homes for sale
- 28451 homes for sale
- 28452 homes for sale
- 28461 homes for sale
- 28462 homes for sale
- 28465 homes for sale
- 28467 homes for sale
- 28468 homes for sale
- 28469 homes for sale
- 28470 homes for sale
- 28479 homes for sale
- 28480 homes for sale
Popular searches near Caswell Beach, NC
- Bald Head Island homes for sale
- Boiling Spring Lakes homes for sale
- Bolivia homes for sale
- Carolina Beach homes for sale
- Federal Point homes for sale
- Holden Beach homes for sale
- Kure Beach homes for sale
- Leland homes for sale
- Lockwoods Folly homes for sale
- Myrtle Grove homes for sale
- Oak Island homes for sale
- St James homes for sale
- Sea Breeze homes for sale
- Silver Lake homes for sale
- Smithville homes for sale
- Southport homes for sale
- Supply homes for sale
- Town Creek homes for sale
- Varnamtown homes for sale
- Winnabow homes for sale
Protect your home and budget from life's surprises with an Assurant Home Warranty, backed by a partner that supports you through every step of homeownership. Explore Plans.
©2026 Century 21 Real Estate LLC. All rights reserved. CENTURY 21®, the CENTURY 21 Logo and C21® are service marks owned by Century 21 Real Estate LLC. Century 21 Real Estate LLC fully supports the principles of the Fair Housing Act and the Equal Opportunity Act. Each office is independently owned and operated. Listing information is deemed reliable but not guaranteed accurate.