- Benns Church homes for sale
- Carrollton homes for sale
- Carrsville homes for sale
- Chesapeake homes for sale
- Corapeake homes for sale
- Hampton homes for sale
- Hardy homes for sale
- Holly Grove homes for sale
- Moyock homes for sale
- Newport homes for sale
- Newport News homes for sale
- Norfolk homes for sale
- Poquoson homes for sale
- Portsmouth homes for sale
- Rushmere homes for sale
- Smithfield homes for sale
- Suffolk homes for sale
- Virginia Beach homes for sale
- Windsor homes for sale
- Zuni homes for sale
23321, VA - homes for sale
269 of 269 results displayed
- New
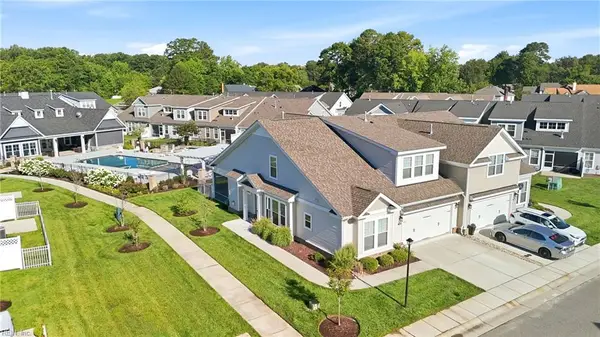
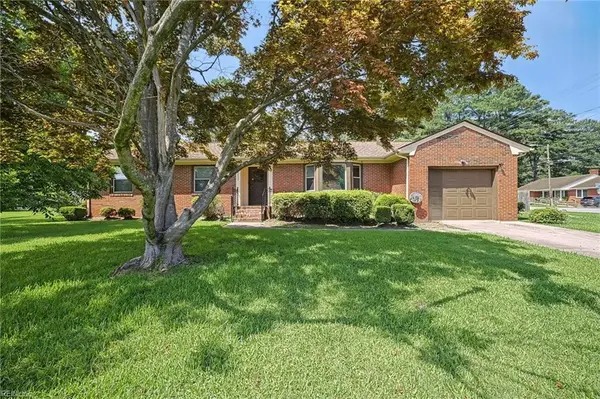
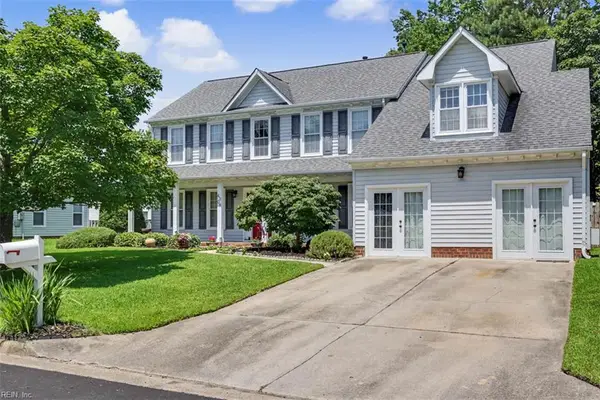
 $539,999Active4 beds 3 baths2,542 sq. ft.
2216 Hampton Roads Parkway, Chesapeake, VA 23321
MLS# 10644558Listed by: Keller Williams Town Center - New
 $310,000Active3 beds 2 baths1,128 sq. ft.
817 Dana Dr Drive, Chesapeake, VA 23321
MLS# 10644587Listed by: COVA Home Realty - New
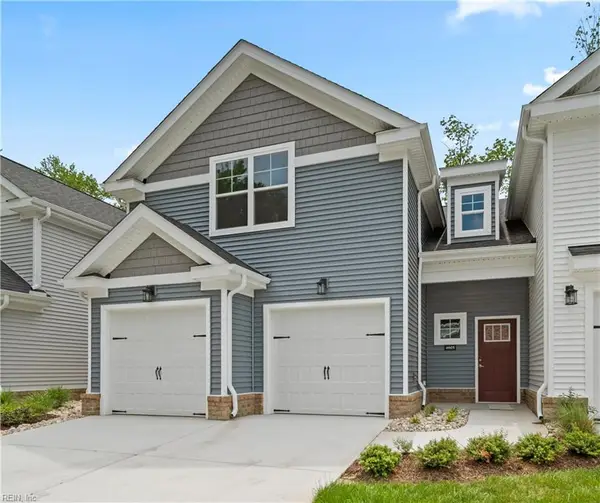
 $345,900Active2 beds 3 baths1,464 sq. ft.
4987 Boone Road, Chesapeake, VA 23321
MLS# 10644649Listed by: Corinth Realty LLC - New
 $650,000Active6 beds 3 baths3,188 sq. ft.
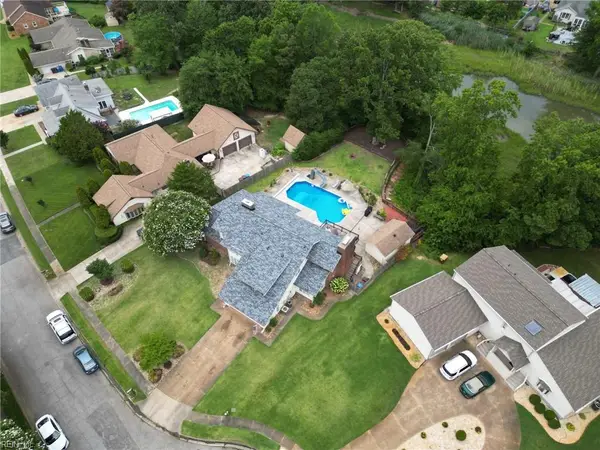
4026 Scotfield Drive, Chesapeake, VA 23321
MLS# 10644555Listed by: BHHS RW Towne Realty - New
 $227,500Active2 beds 2 baths1,326 sq. ft.
4301 Colindale Road #208, Chesapeake, VA 23321
MLS# 10643973Listed by: Atlantic Sothebys Int'l Realty - Open Sat, 10am to 12pmNew
 $449,000Active3 beds 3 baths2,513 sq. ft.
3106 Lantern Place, Chesapeake, VA 23321
MLS# 10644169Listed by: Realty Source - New
 $319,000Active2 beds 3 baths2,790 sq. ft.
2462 Leytonstone Drive, Chesapeake, VA 23321
MLS# 10644448Listed by: Atlantic Coast Realty Corp - New
 $439,900Active4 beds 2 baths1,864 sq. ft.
4117 Hawksley Drive, Chesapeake, VA 23321
MLS# 10644168Listed by: The Real Estate Group - New
 $565,000Active4 beds 3 baths2,300 sq. ft.
1217 Willow Lakes Court, Chesapeake, VA 23321
MLS# 10644284Listed by: The Real Estate Group 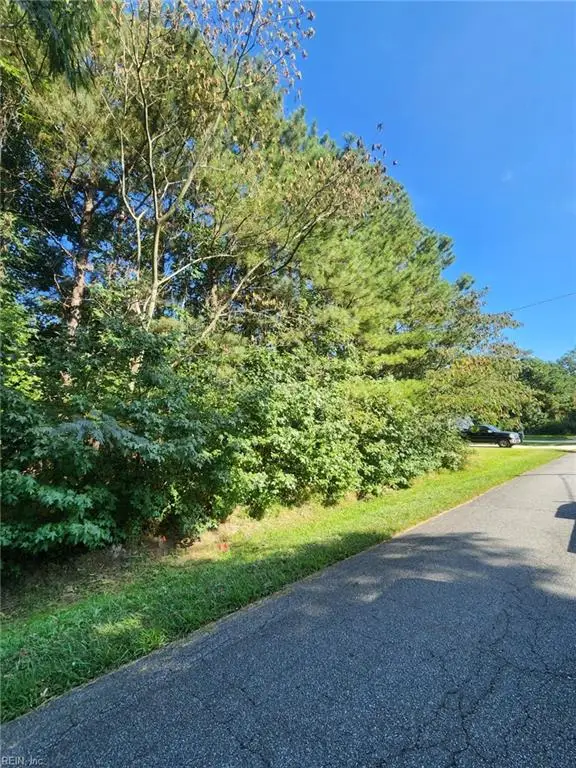
 $69,000Pending0.53 Acres
13 Truitt Road, Chesapeake, VA 23321
MLS# 10643941Listed by: CENTURY 21 Nachman Realty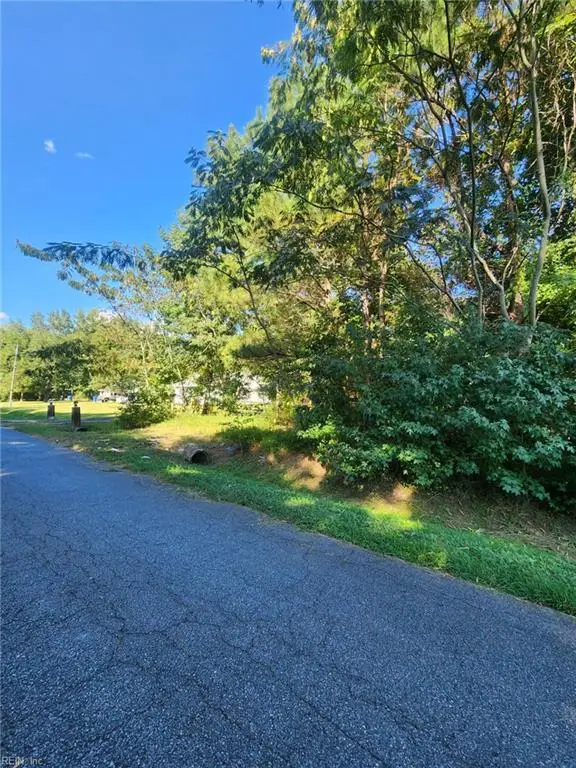 $69,000Pending0.53 Acres
14 Truitt Road, Chesapeake, VA 23321
MLS# 10643945Listed by: CENTURY 21 Nachman Realty- New
 $359,900Active3 beds 2 baths1,544 sq. ft.
4000 Coffman Boulevard, Chesapeake, VA 23321
MLS# 10643791Listed by: Reeds Real Estate LLC - New
 $449,900Active4 beds 3 baths2,880 sq. ft.
4605 Longleaf Place, Chesapeake, VA 23321
MLS# 10644044Listed by: BHHS RW Towne Realty - New
 $440,000Active3 beds 2 baths1,341 sq. ft.
4309 East Road, Chesapeake, VA 23321
MLS# 10644034Listed by: Judy Boone Realty Inc. - New
 $284,000Active2 beds 3 baths1,314 sq. ft.
2806 Baldwin Drive, Chesapeake, VA 23321
MLS# 10643295Listed by: BHHS RW Towne Realty  $290,000Pending3 beds 2 baths1,978 sq. ft.
4116 Emberhill Lane Lane, Chesapeake, VA 23321
MLS# 10643898Listed by: Boyd Realty Partners $499,000Pending4 beds 3 baths2,430 sq. ft.
3309 Mapleton Crescent, Chesapeake, VA 23321
MLS# 10643359Listed by: EXP Realty LLC- New
 $385,000Active3 beds 2 baths1,681 sq. ft.
4017 Belvedere Drive, Chesapeake, VA 23321
MLS# 10642824Listed by: The Real Estate Group - New
 $649,900Active4 beds 3 baths2,913 sq. ft.
2217 Nantucket Avenue, Chesapeake, VA 23321
MLS# 10643711Listed by: Corinth Realty LLC - Open Sun, 12 to 2pmNew
 $560,000Active5 beds 4 baths2,905 sq. ft.
2851 Crossings Drive, Chesapeake, VA 23321
MLS# 10642155Listed by: BHHS RW Towne Realty - New
 $550,000Active4 beds 3 baths2,574 sq. ft.
2720 Deerfield Crescent, Chesapeake, VA 23321
MLS# 10643469Listed by: ONYX Realty Professionals LLC - Open Sun, 12 to 2pmNew
 $565,000Active5 beds 3 baths3,229 sq. ft.
4308 Galston Court, Chesapeake, VA 23321
MLS# 10642758Listed by: The Real Estate Group - New
 $399,999Active4 beds 2 baths2,186 sq. ft.
2600 Janson Drive, Chesapeake, VA 23321
MLS# 10643337Listed by: Swell Real Estate Co - New
 $225,000Active2 beds 2 baths1,362 sq. ft.
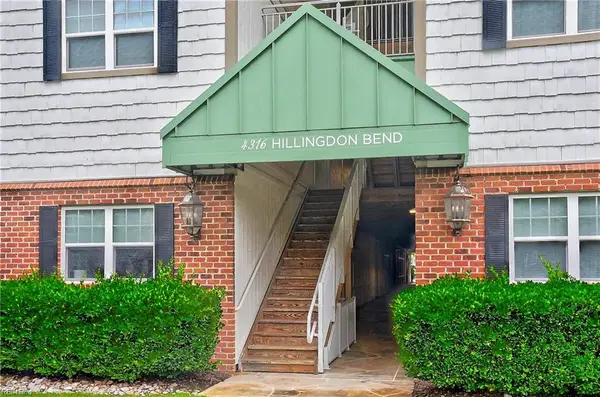
4316 Hillingdon Bend #305, Chesapeake, VA 23321
MLS# 10643135Listed by: The Real Estate Group - New
 $414,900Active4 beds 2 baths1,735 sq. ft.
1920 Ames Circle W, Chesapeake, VA 23321
MLS# 10643474Listed by: RE/MAX Allegiance - New
 $405,000Active3 beds 3 baths1,870 sq. ft.
5247 Lombard Street, Chesapeake, VA 23321
MLS# 10643505Listed by: Iron Valley Real Est. Prestige - New
 $385,000Active4 beds 3 baths1,674 sq. ft.
3403 Bernies Court S, Chesapeake, VA 23321
MLS# 10642590Listed by: Own Real Estate LLC - New
 $975,000Active5 beds 6 baths4,680 sq. ft.
3000 Miars Green, Chesapeake, VA 23321
MLS# 10642217Listed by: VA Realty Professionals - New
 $285,000Active2 beds 3 baths1,329 sq. ft.
2314 Alcott Way, Chesapeake, VA 23321
MLS# 10643393Listed by: Triumph Realty - New
 $775,000Active4 beds 3 baths3,801 sq. ft.
3808 Stonebridge Landing, Chesapeake, VA 23321
MLS# 10643343Listed by: BHHS RW Towne Realty - Open Sat, 11am to 1pmNew
 $239,900Active2 beds 2 baths1,367 sq. ft.
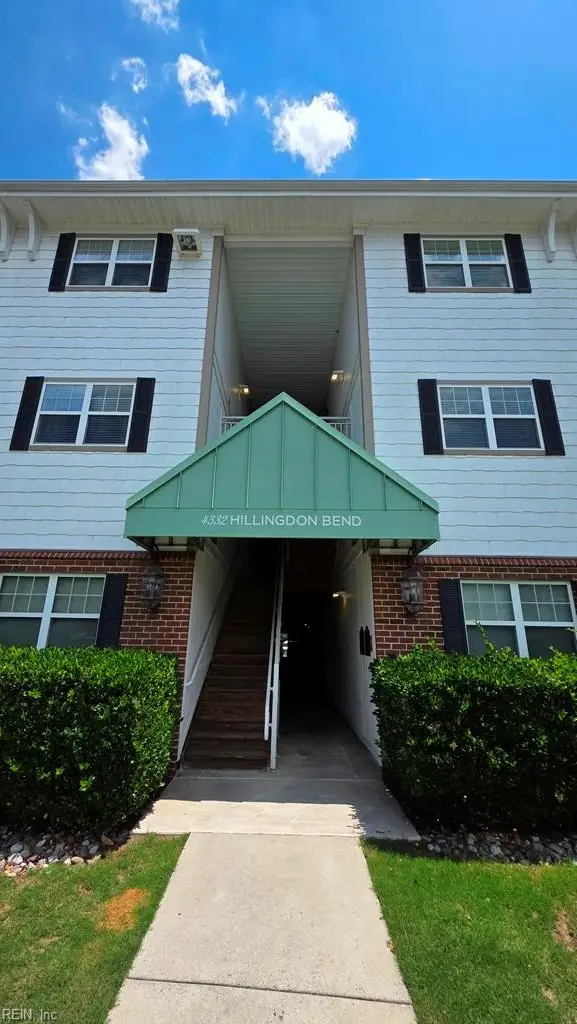
4332 Hillingdon Bend #206, Chesapeake, VA 23321
MLS# 10643303Listed by: Verian Realty - New
 $345,000Active3 beds 2 baths1,462 sq. ft.
3036 Bomar Drive, Chesapeake, VA 23321
MLS# 10643168Listed by: The Real Estate Group - New
 $375,000Active4 beds 3 baths1,456 sq. ft.
4416 Greendell Road, Chesapeake, VA 23321
MLS# 10643180Listed by: Iron Valley Real Est. Prestige - New
 $350,000Active4 beds 3 baths2,272 sq. ft.
4209 Quailshire Court, Chesapeake, VA 23321
MLS# 10643022Listed by: ONYX Realty Professionals LLC  $499,900Pending5 beds 3 baths2,642 sq. ft.
3626 Point Elizabeth Drive, Chesapeake, VA 23321
MLS# 10642167Listed by: Cross Realty- New
 $450,000Active3 beds 2 baths1,386 sq. ft.
4633 Indiana Avenue, Chesapeake, VA 23321
MLS# 10642760Listed by: Howard Hanna Real Estate Svcs. - New
 $260,000Active3 beds 2 baths1,245 sq. ft.
4605 Woodmark Trail, Chesapeake, VA 23321
MLS# 10642754Listed by: ERA Real Estate Professionals 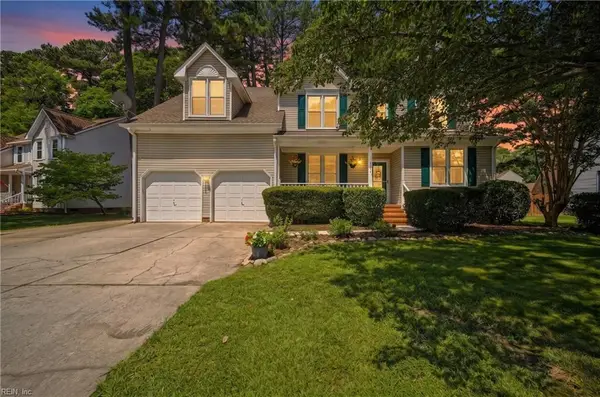 $500,000Active4 beds 3 baths2,329 sq. ft.
3614 Elkton Drive, Chesapeake, VA 23321
MLS# 10641167Listed by: The Real Estate Group $560,000Active4 beds 3 baths2,631 sq. ft.
4704 Wood Stork Drive, Chesapeake, VA 23321
MLS# 10642654Listed by: EXP Realty LLC $554,500Active4 beds 4 baths2,510 sq. ft.
3421 Anita Circle, Chesapeake, VA 23321
MLS# 10642380Listed by: Light Box Realty $452,900Active3 beds 4 baths2,044 sq. ft.
4904 Apricot Way, Chesapeake, VA 23321
MLS# 10642448Listed by: Corinth Realty LLC $229,999Active2 beds 2 baths1,326 sq. ft.
4332 Hillingdon Bend #208, Chesapeake, VA 23321
MLS# 10642575Listed by: EXIT Realty Central $365,000Active3 beds 2 baths1,800 sq. ft.
3916 Port Road, Chesapeake, VA 23321
MLS# 10641627Listed by: The Real Estate Group $380,000Active3 beds 3 baths2,062 sq. ft.
4267 White Cap Crest, Chesapeake, VA 23321
MLS# 10642194Listed by: Creed Realty $285,000Active3 beds 3 baths1,703 sq. ft.
4606 Old Fox Trail, Chesapeake, VA 23321
MLS# 10642346Listed by: Shaffer Real Estate Inc. $650,000Pending4 beds 3 baths3,000 sq. ft.
3618 Point Elizabeth Drive, Chesapeake, VA 23321
MLS# 10642285Listed by: Own Real Estate LLC $299,900Pending3 beds 2 baths1,701 sq. ft.
3906 Peppercorn Way, Chesapeake, VA 23321
MLS# 10641489Listed by: Cherished Destiny Real Estate $457,195Active4 beds 3 baths2,614 sq. ft.
4609 Longleaf Place, Chesapeake, VA 23321
MLS# 10642211Listed by: BHHS RW Towne Realty $349,900Active3 beds 3 baths1,504 sq. ft.
5213 Winery Drive, Chesapeake, VA 23321
MLS# 10642280Listed by: Atlantic Sothebys Int'l Realty $436,900Pending3 beds 4 baths2,044 sq. ft.
4932 Apricot Way, Chesapeake, VA 23321
MLS# 10642269Listed by: Corinth Realty LLC $559,900Active4 beds 3 baths2,700 sq. ft.
3236 Bentham Lane, Chesapeake, VA 23321
MLS# 10641379Listed by: World Class Realty $410,000Pending3 beds 2 baths1,763 sq. ft.
4028 Scotfield Drive, Chesapeake, VA 23321
MLS# 10641095Listed by: The Real Estate Group- Open Sat, 11am to 1:30pm
 $649,900Active3 beds 3 baths3,072 sq. ft.
4500 Mcrae Close, Chesapeake, VA 23321
MLS# 10641913Listed by: CENTURY 21 Nachman Realty 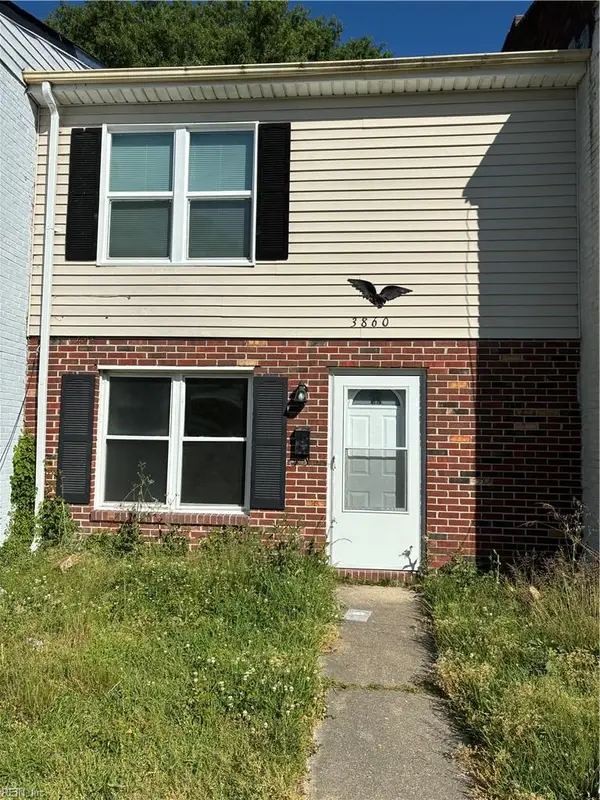 $182,000Active3 beds 2 baths1,120 sq. ft.
3860 Schooner Trail, Chesapeake, VA 23323
MLS# 10641943Listed by: Howard Hanna Real Estate Svcs. $447,900Pending3 beds 4 baths2,044 sq. ft.
4900 Apricot Way, Chesapeake, VA 23321
MLS# 10641947Listed by: Corinth Realty LLC $525,000Active5 beds 4 baths2,302 sq. ft.
5036 Queen Street, Chesapeake, VA 23321
MLS# 10641815Listed by: ONYX Realty Professionals LLC $525,000Active5 beds 4 baths2,302 sq. ft.
5041 Queen Street, Chesapeake, VA 23321
MLS# 10641817Listed by: ONYX Realty Professionals LLC $225,000Pending4 beds 2 baths1,828 sq. ft.
3104 Bangor Drive, Chesapeake, VA 23321
MLS# 10641683Listed by: Real Broker LLC $320,000Active2 beds 3 baths1,870 sq. ft.
2409 Leytonstone Drive, Chesapeake, VA 23321
MLS# 10641664Listed by: Veterans First Realty LLC $574,900Active4 beds 3 baths2,515 sq. ft.
5103 Annapolis Drive, Chesapeake, VA 23321
MLS# 10641728Listed by: Pierre & Associates Realty $439,900Active3 beds 4 baths2,044 sq. ft.
4906 Apricot Way, Chesapeake, VA 23321
MLS# 10641594Listed by: Corinth Realty LLC $299,000Pending3 beds 3 baths1,566 sq. ft.
3615 Whitechapel Arch, Chesapeake, VA 23321
MLS# 10641621Listed by: Swell Realty Co $974,500Active4 beds 4 baths3,000 sq. ft.
4020 Tucker Lane, Chesapeake, VA 23322
MLS# 10641558Listed by: World Class Realty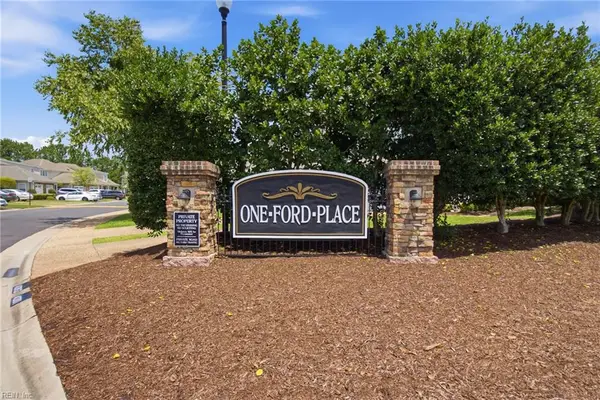 $320,000Active3 beds 3 baths1,952 sq. ft.
4320 Oneford Place, Chesapeake, VA 23321
MLS# 10641389Listed by: BHHS RW Towne Realty $280,000Active3 beds 2 baths1,494 sq. ft.
3920 Peppercorn Way, Chesapeake, VA 23321
MLS# 10641304Listed by: Garrett Realty Partners $445,000Pending3 beds 2 baths1,828 sq. ft.
4220 Duke Of Gloucester Drive, Chesapeake, VA 23321
MLS# 10641409Listed by: BHHS RW Towne Realty $585,000Pending4 beds 4 baths2,941 sq. ft.
4513 Overlook Place, Chesapeake, VA 23321
MLS# 10641448Listed by: The Property Shoppe $515,000Active5 beds 4 baths3,680 sq. ft.
5014 Pearl Street, Chesapeake, VA 23321
MLS# 10641235Listed by: Redfin Corporation $690,000Active5 beds 3 baths3,466 sq. ft.
3932 Colony Pointe Drive, Chesapeake, VA 23321
MLS# 10641305Listed by: Rowland RE $367,000Active4 beds 3 baths2,350 sq. ft.
4163 River Breeze Circle, Chesapeake, VA 23321
MLS# 10641329Listed by: Swell Realty Co $550,900Active4 beds 3 baths2,447 sq. ft.
2206 Wilmington Avenue, Chesapeake, VA 23321
MLS# 10641029Listed by: RHOAD & CO. $609,900Active6 beds 3 baths2,812 sq. ft.
2223 Hampton Roads Parkway, Chesapeake, VA 23321
MLS# 10641027Listed by: RHOAD & CO. $850,000Active4 beds 4 baths3,000 sq. ft.
3315 Tyre Neck Road, Chesapeake, VA 23321
MLS# 10641064Listed by: The Real Estate Group $550,900Active4 beds 3 baths2,447 sq. ft.
2205 Hampton Road, Chesapeake, VA 23321
MLS# 10641022Listed by: RHOAD & CO. $539,900Active4 beds 2 baths2,145 sq. ft.
2204 Wilmington Avenue, Chesapeake, VA 23321
MLS# 10641024Listed by: RHOAD & CO. $456,900Pending3 beds 4 baths2,044 sq. ft.
4910 Apricot Way, Chesapeake, VA 23321
MLS# 10641194Listed by: Corinth Realty LLC $169,000Active2 beds 2 baths960 sq. ft.
3325 Clover Meadows Drive, Chesapeake, VA 23321
MLS# 10640882Listed by: CENTURY 21 Top Producers $1,257,400Active5 beds 4 baths3,600 sq. ft.
2832 Martins Point Way, Chesapeake, VA 23321
MLS# 10640535Listed by: Howard Hanna Real Estate Svcs. $355,500Active3 beds 3 baths1,633 sq. ft.
2949 Big Bend Drive, Chesapeake, VA 23321
MLS# 10640469Listed by: Better Homes & Gdns Ntv Am Grp $575,000Active4 beds 3 baths2,571 sq. ft.
4105 Margaret Ann Court, Chesapeake, VA 23321
MLS# 10640809Listed by: Howard Hanna Real Estate Svcs.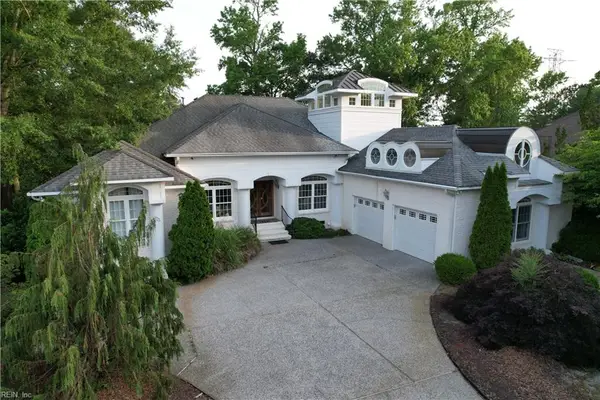 $675,000Pending3 beds 4 baths3,499 sq. ft.
4407 Mccaan Quay, Chesapeake, VA 23321
MLS# 10638995Listed by: Swell Real Estate Co $260,000Pending3 beds 2 baths1,245 sq. ft.
4602 Woodmark Trail, Chesapeake, VA 23321
MLS# 10640608Listed by: Chesapeake Bay Realty $320,000Pending3 beds 2 baths1,176 sq. ft.
3316 Stilworken Drive, Chesapeake, VA 23321
MLS# 10640675Listed by: Live Oak Real Estate $450,000Pending4 beds 3 baths2,201 sq. ft.
3208 Meadowbrook Lane, Chesapeake, VA 23321
MLS# 10640477Listed by: The Bryant Group $202,000Active2 beds 2 baths1,020 sq. ft.
3208 Clover Road E, Chesapeake, VA 23321
MLS# 10636592Listed by: Better Homes & Gdns Ntv Am Grp- Open Fri, 4 to 6pm
 $335,000Active3 beds 2 baths1,352 sq. ft.
3116 Woodbaugh Drive, Chesapeake, VA 23321
MLS# 10640239Listed by: The Agency  $399,900Active3 beds 4 baths1,993 sq. ft.
2101 Belden Avenue, Chesapeake, VA 23321
MLS# 10640347Listed by: Iron Valley Real Estate HR $340,000Active3 beds 2 baths1,092 sq. ft.
4004 Lanae Court, Chesapeake, VA 23321
MLS# 10639839Listed by: Triumph Realty $604,740Pending5 beds 3 baths2,511 sq. ft.
5138 Duxbury Road, Suffolk, VA 23435
MLS# 10639804Listed by: D R Horton Realty of Virginia $675,000Active4 beds 4 baths3,679 sq. ft.
3000 Voyager Court, Chesapeake, VA 23321
MLS# 10639506Listed by: BHHS RW Towne Realty $228,000Active2 beds 2 baths1,254 sq. ft.
3611 Radford Circle, Chesapeake, VA 23321
MLS# 10639739Listed by: CENTURY 21 Nachman Realty $549,900Pending4 beds 3 baths2,238 sq. ft.
5521 White Swallow Way, Chesapeake, VA 23321
MLS# 10638772Listed by: BHHS RW Towne Realty $1,190,000Active6 beds 5 baths6,350 sq. ft.
4200 Quailshire Court, Chesapeake, VA 23321
MLS# 10639205Listed by: Keller Williams Capital Props. $687,500Active5 beds 3 baths3,256 sq. ft.
1432 Pine Grove Lane, Chesapeake, VA 23321
MLS# 10639638Listed by: Long & Foster Real Estate Inc.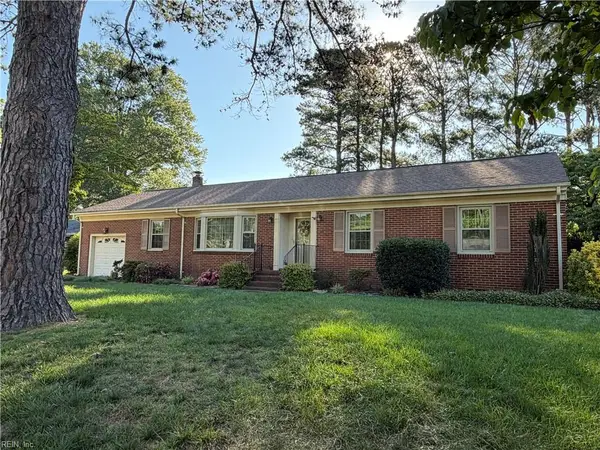 $369,000Active3 beds 2 baths1,540 sq. ft.
3305 Hemlock Drive, Chesapeake, VA 23321
MLS# 10637972Listed by: Howard Hanna Real Estate Svcs. $500,000Active5 beds 4 baths2,528 sq. ft.
3316 Mapleton Crescent, Chesapeake, VA 23321
MLS# 10639341Listed by: The Real Estate Group $450,000Active4 beds 3 baths2,129 sq. ft.
4005 Terry Drive, Chesapeake, VA 23321
MLS# 10639464Listed by: Cross Realty $239,000Active2 beds 2 baths1,186 sq. ft.
4346 Stafford Drive, Chesapeake, VA 23321
MLS# 10639570Listed by: Prodigy Realty $75,000Active0 Acres
4999 Clifton Street, Chesapeake, VA 23321
MLS# 10639494Listed by: Own Real Estate LLC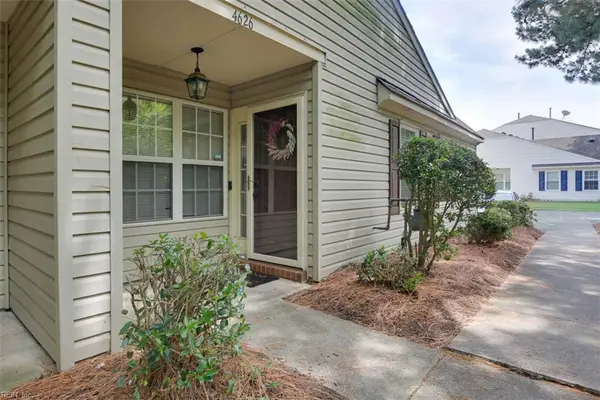 $250,000Active3 beds 2 baths1,245 sq. ft.
4626 Old Fox Trail, Chesapeake, VA 23321
MLS# 10638669Listed by: House Goals $525,000Pending4 beds 4 baths2,170 sq. ft.
1329 Creekview Dr, Chesapeake, VA 23321
MLS# 10638880Listed by: A Better Way Realty Inc. $245,000Active2 beds 2 baths1,020 sq. ft.
3202 Clover Road E, Chesapeake, VA 23321
MLS# 10639194Listed by: KW Coastal Chesapeake Virginia $555,900Pending4 beds 3 baths2,240 sq. ft.
2257 Captiva Lane, Chesapeake, VA 23321
MLS# 10639222Listed by: RHOAD & CO. $269,000Active3 beds 1 baths960 sq. ft.
5001 Clifton Street, Chesapeake, VA 23321
MLS# 10639206Listed by: Own Real Estate LLC $435,000Pending4 beds 3 baths1,684 sq. ft.
2921 Meadow Forest Road, Chesapeake, VA 23321
MLS# 10638429Listed by: RE/MAX Capital $469,000Active4 beds 2 baths1,834 sq. ft.
3727 Hardwick Terrace, Chesapeake, VA 23321
MLS# 10639147Listed by: Own Real Estate LLC $445,000Active4 beds 2 baths1,820 sq. ft.
3004 Tyre Neck Road, Chesapeake, VA 23321
MLS# 10639152Listed by: Own Real Estate LLC- Open Sat, 1 to 3pm
 $443,900Active4 beds 3 baths2,842 sq. ft.
4620 Longleaf Place, Chesapeake, VA 23321
MLS# 10638879Listed by: GreenTree Realty Inc - Open Sun, 12 to 2pm
 $599,900Active4 beds 3 baths3,444 sq. ft.
3120 Deans Court, Chesapeake, VA 23321
MLS# 10638728Listed by: Proactive Real Estate Services  $398,000Active4 beds 2 baths1,640 sq. ft.
4113 Taylor Road, Chesapeake, VA 23321
MLS# 10638898Listed by: Own Real Estate LLC $615,000Active4 beds 3 baths2,452 sq. ft.
4100 Scotfield Drive, Chesapeake, VA 23321
MLS# 10638546Listed by: Creed Realty $449,900Active4 beds 3 baths2,880 sq. ft.
4603 Longleaf Place, Chesapeake, VA 23321
MLS# 10638619Listed by: BHHS RW Towne Realty $378,000Pending3 beds 3 baths1,970 sq. ft.
4125 Taughtline Loop, Chesapeake, VA 23321
MLS# 10638571Listed by: Safe Haven Real Estate Group $509,900Pending4 beds 3 baths2,154 sq. ft.
1204 Elverton Court, Chesapeake, VA 23321
MLS# 10638582Listed by: Iron Valley Real Est Norfolk $315,000Pending3 beds 3 baths1,800 sq. ft.
2526 Leytonstone Drive, Chesapeake, VA 23321
MLS# 10637847Listed by: Redfin Corporation $210,000Pending2 beds 2 baths1,367 sq. ft.
2424 Chancery Lane #303, Chesapeake, VA 23321
MLS# 10638161Listed by: Reeds Real Estate LLC $600,000Active4 beds 3 baths2,350 sq. ft.
4737 Condor Drive, Chesapeake, VA 23321
MLS# 10638405Listed by: Garrett Realty Partners $236,000Pending3 beds 3 baths1,606 sq. ft.
5217 Askew Road, Chesapeake, VA 23321
MLS# 10635906Listed by: Better Homes & Gdns Ntv Am Grp $619,900Pending5 beds 3 baths3,100 sq. ft.
2711 Deerfield Crescent, Chesapeake, VA 23321
MLS# 10638267Listed by: NextHome SLH Real Estate Group $480,000Active4 beds 3 baths2,600 sq. ft.
1805 Blackhawk Place, Chesapeake, VA 23321
MLS# 10636443Listed by: Own Real Estate LLC $379,999Active3 beds 2 baths1,545 sq. ft.
3208 Barksdale Road, Chesapeake, VA 23321
MLS# 10636696Listed by: Real Broker LLC $215,000Pending3 beds 2 baths1,440 sq. ft.
4032 Sloop Trail, Chesapeake, VA 23321
MLS# 10637810Listed by: BHHS RW Towne Realty $648,990Active5 beds 4 baths3,224 sq. ft.
5118 Duxbury Road, Suffolk, VA 23435
MLS# 10637808Listed by: D R Horton Realty of Virginia $355,000Active3 beds 3 baths1,633 sq. ft.
3004 Big Bend Drive, Chesapeake, VA 23321
MLS# 10636341Listed by: Iron Valley Real Est Norfolk $545,900Active4 beds 3 baths2,194 sq. ft.
5025 Duxbury Road, Chesapeake, VA 23321
MLS# 10637350Listed by: Corinth Realty LLC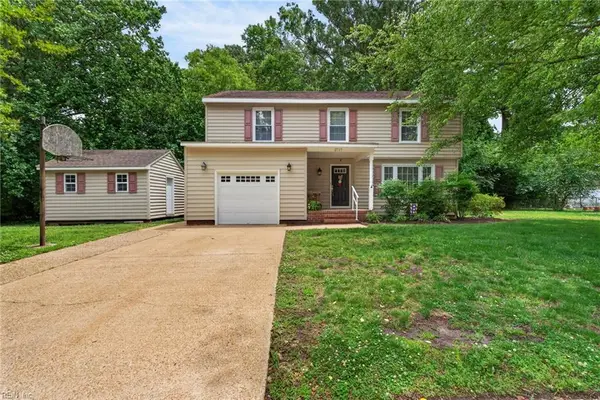 $364,777Pending4 beds 3 baths1,774 sq. ft.
2717 N Elizabeth Harbor Drive, Chesapeake, VA 23321
MLS# 10637080Listed by: BHHS RW Towne Realty $535,000Active4 beds 3 baths2,439 sq. ft.
4528 Davids Mill Drive, Chesapeake, VA 23321
MLS# 10636972Listed by: Long1 & Foster Real Estate Inc. $172,900Pending3 beds 2 baths1,313 sq. ft.
3904 Starboard Rd, CHESAPEAKE, VA 23321
MLS# VACK2000154Listed by: REALHOME SERVICES AND SOLUTIONS, INC. $240,000Active6 Acres
4809 Sondej Avenue, Chesapeake, VA 23321
MLS# 10636984Listed by: BHHS RW Towne Realty $449,900Pending3 beds 3 baths2,557 sq. ft.
4607 Longleaf Place, Chesapeake, VA 23321
MLS# 10637007Listed by: BHHS RW Towne Realty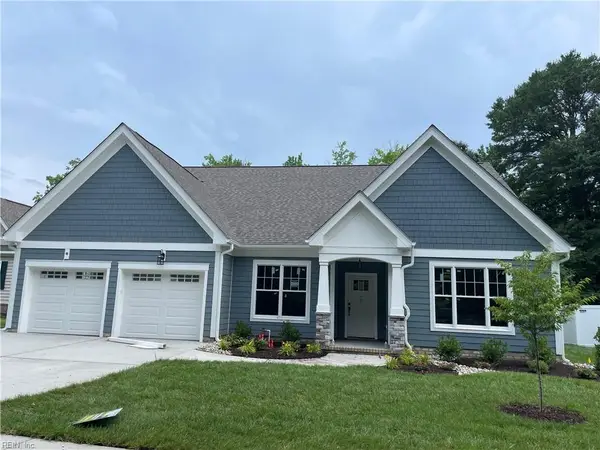 $839,500Active5 beds 3 baths3,125 sq. ft.
3909 Bruce Road, Chesapeake, VA 23321
MLS# 10636739Listed by: Howard Hanna Real Estate Svcs. $310,000Active3 beds 2 baths1,472 sq. ft.
2312 Meadows Landing, Chesapeake, VA 23321
MLS# 10636782Listed by: Keller Williams Realty Twn Ctr $395,900Active3 beds 3 baths1,642 sq. ft.
4902 Apricot Way, Chesapeake, VA 23321
MLS# 10636868Listed by: Corinth Realty LLC $544,534Pending4 beds 3 baths2,194 sq. ft.
2206 Captiva Lane, Chesapeake, VA 23321
MLS# 10636874Listed by: Corinth Realty LLC $618,990Active5 beds 3 baths2,511 sq. ft.
5120 Duxbury Road, Suffolk, VA 23435
MLS# 10636742Listed by: D R Horton Realty of Virginia $600,000Active4 beds 3 baths2,808 sq. ft.
2307 Tybee Loop, Chesapeake, VA 23321
MLS# 10636441Listed by: Swell Real Estate Co $500,000Active4 beds 3 baths2,546 sq. ft.
2852 Greenview Road, Chesapeake, VA 23321
MLS# 10635453Listed by: Atlantic Coast Realty Corp $152,900Pending2 beds 1 baths900 sq. ft.
3440 Clover Road E, Chesapeake, VA 23321
MLS# 10636259Listed by: 1st Class RealEstate Integrity $300,000Pending3 beds 3 baths1,776 sq. ft.
4341 Farringdon Way, Chesapeake, VA 23321
MLS# 10635598Listed by: Better Homes & Gdns Ntv Am Grp $544,900Pending4 beds 2 baths2,145 sq. ft.
2213 Hampton Roads Parkway, Chesapeake, VA 23321
MLS# 10635948Listed by: RHOAD & CO. $525,000Pending6 beds 3 baths2,683 sq. ft.
2900 Tyre Neck Road, Chesapeake, VA 23321
MLS# 10635326Listed by: Next Chapter VA Realty Inc $499,990Active3 beds 2 baths2,356 sq. ft.
2871 Lilley Cove Drive, Chesapeake, VA 23321
MLS# 10635788Listed by: BHHS RW Towne Realty $675,000Active5 beds 3 baths3,304 sq. ft.
3012 Golden Hind Road, Chesapeake, VA 23321
MLS# 10634578Listed by: RE/MAX Country to Coast $350,000Pending3 beds 2 baths2,114 sq. ft.
1875 Ames Circle W, Chesapeake, VA 23321
MLS# 10635626Listed by: LPT Realty LLC $644,740Active5 beds 4 baths3,224 sq. ft.
5108 Duxbury Road, Suffolk, VA 23435
MLS# 10635627Listed by: D R Horton Realty of Virginia $569,740Pending4 beds 4 baths2,312 sq. ft.
5133 Duxbury Road, Suffolk, VA 23435
MLS# 10635601Listed by: D R Horton Realty of Virginia $250,000Active3 beds 3 baths1,703 sq. ft.
4610 Olde Stone Way, Chesapeake, VA 23321
MLS# 10635486Listed by: World Class Realty & Prop Mgmt $1,199,000Active4 beds 4 baths3,656 sq. ft.
2872 E Point Drive, Chesapeake, VA 23321
MLS# 2613166Listed by: NEW MARKET REALTY $585,000Pending4 beds 3 baths2,856 sq. ft.
2718 Gum Road, Chesapeake, VA 23321
MLS# 10635281Listed by: Real Broker LLC $549,000Active5 beds 3 baths3,300 sq. ft.
3025 Crossings Drive, Chesapeake, VA 23321
MLS# 10634550Listed by: Howard Hanna Real Estate Svcs. $659,740Active5 beds 4 baths3,226 sq. ft.
5114 Duxbury Road, Suffolk, VA 23435
MLS# 10635161Listed by: D R Horton Realty of Virginia $355,000Pending3 beds 2 baths1,450 sq. ft.
1328 Keaton Way, Chesapeake, VA 23321
MLS# 10635149Listed by: The Bryant Group $450,000Pending3 beds 2 baths1,668 sq. ft.
4245 Taylor Road, Chesapeake, VA 23321
MLS# 10635156Listed by: CENTURY 21 Nachman Realty $950,000Pending1 beds -- baths2,272 sq. ft.
4249 Taylor Road, Chesapeake, VA 23321
MLS# 10635157Listed by: CENTURY 21 Nachman Realty $300,000Pending3 beds 2 baths2,242 sq. ft.
4261 Taylor Road, Chesapeake, VA 23321
MLS# 10635158Listed by: CENTURY 21 Nachman Realty $400,000Pending3 beds 2 baths1,630 sq. ft.
4925 Vico Drive, Chesapeake, VA 23321
MLS# 10633964Listed by: House Goals $225,000Active2 beds 2 baths1,367 sq. ft.
4332 Hillingdon Bend #205, Chesapeake, VA 23321
MLS# 10633795Listed by: Sand & Sea Realty $539,000Active4 beds 3 baths2,542 sq. ft.
2216 Hampton Roads Parkway, Chesapeake, VA 23321
MLS# 10634892Listed by: Keller Williams Town Center $603,990Active4 beds 3 baths2,618 sq. ft.
5106 Duxbury Road, Suffolk, VA 23435
MLS# 10634691Listed by: D R Horton Realty of Virginia $457,195Pending4 beds 3 baths2,433 sq. ft.
4615 Longleaf Place, Chesapeake, VA 23321
MLS# 10634599Listed by: BHHS RW Towne Realty $2,425,000Active25.84 Acres
25+AC S Military Highway, Chesapeake, VA 23321
MLS# 10634546Listed by: North End Realty Group- Open Sat, 10 to 6pm
 $653,990Active5 beds 4 baths3,226 sq. ft.
5102 Duxbury Road, Suffolk, VA 23435
MLS# 10634492Listed by: D R Horton Realty of Virginia  $434,900Pending3 beds 2 baths2,115 sq. ft.
3369 Morningside Drive, Chesapeake, VA 23321
MLS# 10634423Listed by: Howard Hanna Real Estate Svcs. $589,000Pending4 beds 3 baths2,759 sq. ft.
5020 Corolla Drive, Chesapeake, VA 23321
MLS# 10634239Listed by: Own Real Estate LLC $539,900Pending4 beds 3 baths2,714 sq. ft.
3105 Deans Court, Chesapeake, VA 23321
MLS# 10634175Listed by: BHHS RW Towne Realty $85,000Active0.36 Acres
L38 40 Norfolk Street, Suffolk, VA 23435
MLS# 10631901Listed by: EXP Realty LLC $699,000Pending4 beds 4 baths4,459 sq. ft.
433 Truitt Road, Chesapeake, VA 23321
MLS# 10634002Listed by: BHHS RW Towne Realty $264,900Pending3 beds 2 baths1,245 sq. ft.
3010 Trappers Run, Chesapeake, VA 23321
MLS# 10633653Listed by: KW Coastal Virginia Chesapeake $789,900Active5 beds 5 baths4,723 sq. ft.
4423 Tartan Arch, Chesapeake, VA 23321
MLS# 10633289Listed by: Better Homes & Gdns Ntv Am Grp $574,900Active4 beds 3 baths2,235 sq. ft.
2800 Meadow Wood Drive E, Chesapeake, VA 23321
MLS# 10633505Listed by: Real Broker LLC $444,900Active3 beds 4 baths2,044 sq. ft.
4914 Apricot Way, Chesapeake, VA 23321
MLS# 10633425Listed by: Corinth Realty LLC $604,740Pending5 beds 3 baths2,511 sq. ft.
5104 Duxbury Road, Suffolk, VA 23435
MLS# 10624611Listed by: D R Horton Realty of Virginia- Open Sun, 12 to 2pm
 $450,000Active4 beds 3 baths3,000 sq. ft.
2904 Sir Walter Crescent, Chesapeake, VA 23321
MLS# 10632989Listed by: Metro Brokers of Hampton Roads  $354,900Pending3 beds 2 baths1,108 sq. ft.
3436 Bernies Court S, Chesapeake, VA 23321
MLS# 10633082Listed by: Own Real Estate LLC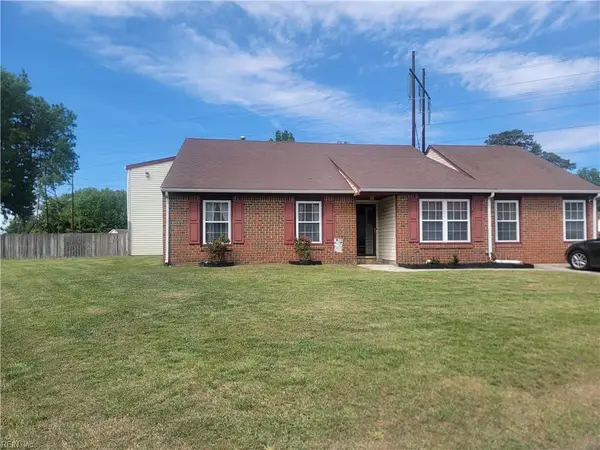 $497,000Active6 beds 4 baths3,789 sq. ft.
4000 Wyant Court, Chesapeake, VA 23321
MLS# 10632780Listed by: BHHS RW Towne Realty $267,000Pending3 beds 1 baths1,100 sq. ft.
100 Columbus Avenue, Chesapeake, VA 23321
MLS# 10632843Listed by: Iron Valley Real Est. Prestige $609,900Active6 beds 3 baths2,812 sq. ft.
2209 Hampton Roads Parkway, Chesapeake, VA 23321
MLS# 10632620Listed by: RHOAD & CO. $550,900Active4 beds 3 baths2,420 sq. ft.
2211 Hampton Roads Parkway, Chesapeake, VA 23321
MLS# 10632324Listed by: RHOAD & CO. $239,900Active2 beds 2 baths1,186 sq. ft.
4336 Stafford Drive, Chesapeake, VA 23321
MLS# 10632694Listed by: BHHS RW Towne Realty $427,900Active3 beds 4 baths2,044 sq. ft.
4918 Apricot Way, Chesapeake, VA 23321
MLS# 10632718Listed by: Corinth Realty LLC $475,000Active3 beds 3 baths2,424 sq. ft.
3212 Mapleton Crescent, Chesapeake, VA 23321
MLS# 10632002Listed by: Howard Hanna Real Estate Svcs.- Open Sat, 10am to 6pm
 $564,740Active5 beds 4 baths2,199 sq. ft.
5125 Duxbury Road, Suffolk, VA 23435
MLS# 10632559Listed by: D R Horton Realty of Virginia  $557,740Pending5 beds 4 baths2,199 sq. ft.
5131 Duxbury Road, Suffolk, VA 23435
MLS# 10632563Listed by: D R Horton Realty of Virginia $249,000Pending4 beds 2 baths1,528 sq. ft.
3604 Bosun Drive, Chesapeake, VA 23321
MLS# 2611383Listed by: EXP REALTY, LLC $149,900Pending2 beds 1 baths851 sq. ft.
3529 Clover Meadows Drive, Chesapeake, VA 23321
MLS# 10632090Listed by: Southside Real Estate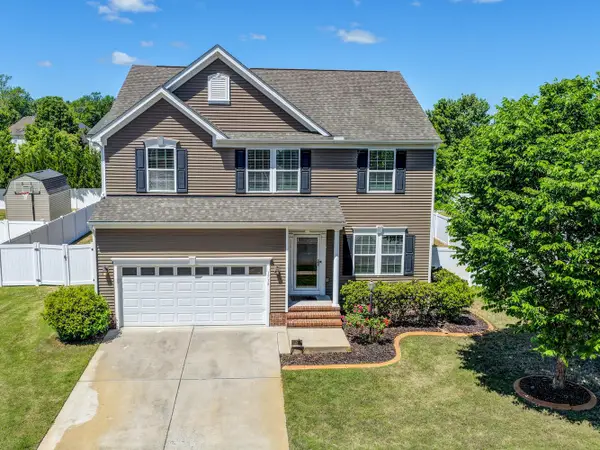 $550,000Pending4 beds 3 baths2,708 sq. ft.
1716 Fishers Cove, Chesapeake, VA 23321
MLS# 10632006Listed by: CENTURY 21 Nachman Realty $540,000Active5 beds 3 baths3,590 sq. ft.
4624 Westborough Drive, Chesapeake, VA 23321
MLS# 10631735Listed by: Investment Realty Corporation $224,999Active2 beds 2 baths1,300 sq. ft.
2424 Chancery Lane #105, Chesapeake, VA 23321
MLS# 10631357Listed by: The Real Estate Group $604,740Pending5 beds 3 baths2,511 sq. ft.
5134 Duxbury Road, Suffolk, VA 23435
MLS# 10631288Listed by: D R Horton Realty of Virginia $399,000Active4 beds 3 baths1,612 sq. ft.
2406 Drum Creek Road, Chesapeake, VA 23321
MLS# 10630642Listed by: World Class Realty $569,900Active5 beds 4 baths2,801 sq. ft.
2250 Captiva Lane, Chesapeake, VA 23321
MLS# 10631069Listed by: Prodigy Realty $539,900Pending4 beds 2 baths2,145 sq. ft.
5108 Annapolis Drive, Chesapeake, VA 23321
MLS# 10630795Listed by: RHOAD & CO.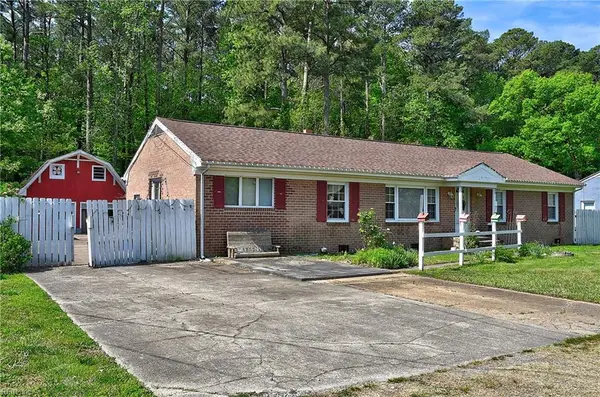 $400,000Pending4 beds 2 baths1,700 sq. ft.
604 Fife St, Chesapeake, VA 23321
MLS# 10630410Listed by: A Better Way Realty Inc. $446,900Pending3 beds 4 baths2,044 sq. ft.
4920 Apricot Way, Chesapeake, VA 23321
MLS# 10630416Listed by: Corinth Realty LLC $614,740Pending5 beds 3 baths2,511 sq. ft.
5130 Duxbury Road, Suffolk, VA 23435
MLS# 10630440Listed by: D R Horton Realty of Virginia $385,900Pending3 beds 3 baths1,642 sq. ft.
4908 Apricot Way, Chesapeake, VA 23321
MLS# 10629886Listed by: Corinth Realty LLC $391,505Pending3 beds 3 baths1,642 sq. ft.
2019 Guava Lane, Chesapeake, VA 23321
MLS# 10629721Listed by: Corinth Realty LLC $578,645Active4 beds 3 baths2,420 sq. ft.
5112 Annapolis Drive, Chesapeake, VA 23321
MLS# 10629470Listed by: RHOAD & CO. $607,240Pending5 beds 3 baths2,511 sq. ft.
5116 Duxbury Road, Suffolk, VA 23435
MLS# 10629555Listed by: D R Horton Realty of Virginia $179,900Active3 beds 2 baths1,280 sq. ft.
4061 Holly Cove Drive, Chesapeake, VA 23321
MLS# 10628151Listed by: 1st Class Real Estate Flagship $489,500Active4 beds 3 baths2,653 sq. ft.
4743 Mahogany Run, Chesapeake, VA 23321
MLS# 10627299Listed by: BHHS RW Towne Realty $599,900Pending6 beds 3 baths2,812 sq. ft.
5104 Annapolis Drive, Chesapeake, VA 23321
MLS# 10628009Listed by: RHOAD & CO. $599,000Active5 beds 3 baths2,400 sq. ft.
4521 Moonlight Way, Chesapeake, VA 23321
MLS# 10627623Listed by: A-Team Realty Group $392,900Pending3 beds 3 baths1,642 sq. ft.
4916 Apricot Way, Chesapeake, VA 23321
MLS# 10627455Listed by: Corinth Realty LLC $571,240Pending4 beds 4 baths2,312 sq. ft.
5121 Duxbury Road, Suffolk, VA 23435
MLS# 10627373Listed by: D R Horton Realty of Virginia $607,315Pending5 beds 4 baths2,623 sq. ft.
5127 Duxbury Road, Suffolk, VA 23435
MLS# 10627374Listed by: D R Horton Realty of Virginia $598,240Pending4 beds 3 baths2,613 sq. ft.
5122 Duxbury Road, Suffolk, VA 23435
MLS# 10627099Listed by: D R Horton Realty of Virginia $369,900Active3 beds 4 baths1,916 sq. ft.
4122 Riverside Drive, Chesapeake, VA 23321
MLS# 10626567Listed by: Better Homes & Gdns Ntv Am Grp $629,990Pending5 beds 4 baths3,226 sq. ft.
5124 Duxbury Road, Suffolk, VA 23435
MLS# 10626703Listed by: D R Horton Realty of Virginia $607,240Pending5 beds 3 baths2,511 sq. ft.
5126 Duxbury Road, Suffolk, VA 23435
MLS# 10626384Listed by: D R Horton Realty of Virginia $449,900Pending3 beds 4 baths2,044 sq. ft.
4924 Apricot Way, Chesapeake, VA 23321
MLS# 10624849Listed by: Corinth Realty LLC $445,000Pending4 beds 3 baths2,653 sq. ft.
3105 Lantern Place, Chesapeake, VA 23321
MLS# 10624808Listed by: BHHS RW Towne Realty $592,900Pending5 beds 3 baths2,661 sq. ft.
5008 Cape May Loop, Chesapeake, VA 23321
MLS# 10625029Listed by: Corinth Realty LLC $434,900Pending3 beds 4 baths2,044 sq. ft.
4932 Apricot Way, Chesapeake, VA 23321
MLS# 10625058Listed by: Corinth Realty LLC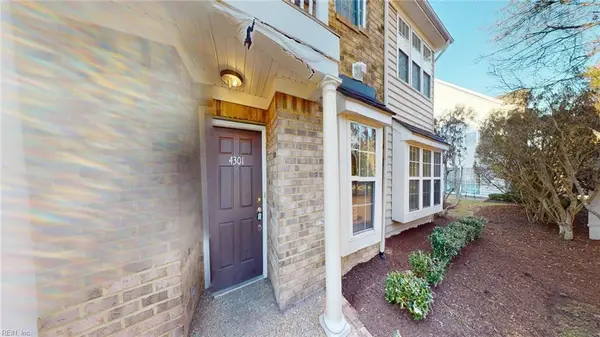 $229,500Pending2 beds 2 baths1,274 sq. ft.
4301 Oneford Place, Chesapeake, VA 23321
MLS# 10623620Listed by: Better Homes & Gdns Ntv Am Grp $454,900Active3 beds 3 baths2,557 sq. ft.
4725 Mahogany Run, Chesapeake, VA 23321
MLS# 10624181Listed by: BHHS RW Towne Realty $1,195,795Pending5 beds 4 baths3,982 sq. ft.
4030 Tucker Lane, Chesapeake, VA 23322
MLS# 10623185Listed by: World Class Realty $383,900Pending3 beds 3 baths1,642 sq. ft.
4922 Apricot Way, Chesapeake, VA 23321
MLS# 10621368Listed by: Corinth Realty LLC $252,000Pending3 beds 2 baths1,114 sq. ft.
3316 Bickford Court, Chesapeake, VA 23321
MLS# 10620276Listed by: Warrior Realty of Virginia LLC $551,900Active4 beds 2 baths2,145 sq. ft.
2207 Hampton Roads Parkway, Chesapeake, VA 23321
MLS# 10619486Listed by: RHOAD & CO. $387,900Pending3 beds 3 baths1,642 sq. ft.
4936 Apricot Way, Chesapeake, VA 23321
MLS# 10619178Listed by: Corinth Realty LLC $585,900Pending5 beds 3 baths2,661 sq. ft.
2210 Captiva Lane, Chesapeake, VA 23321
MLS# 10617406Listed by: Corinth Realty LLC $350,000Pending3 beds 2 baths1,728 sq. ft.
5533 Willow Lake Road, Chesapeake, VA 23321
MLS# 10617112Listed by: Keller Williams Realty Twn Ctr $315,000Pending4 beds 2 baths2,052 sq. ft.
4060 Belvedere Drive, Chesapeake, VA 23321
MLS# 10616695Listed by: LPT Realty LLC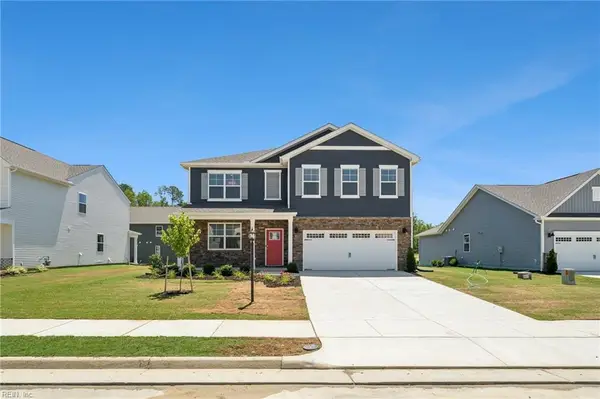 $599,740Pending5 beds 3 baths2,511 sq. ft.
5138 Duxbury Road, Suffolk, VA 23435
MLS# 10615972Listed by: D R Horton Realty of Virginia $400,000Active5 beds 2 baths3,333 sq. ft.
3861 Ahoy Drive, Chesapeake, VA 23321
MLS# 10615520Listed by: Long & Foster Real Estate Inc.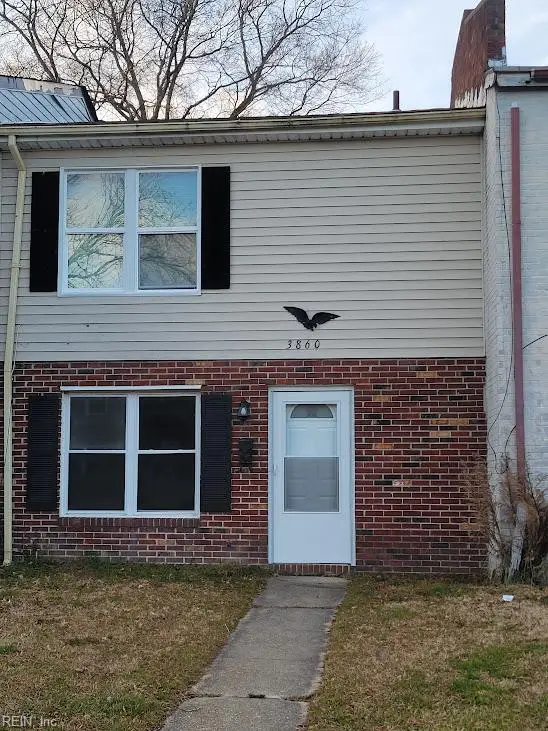 $179,900Pending3 beds 2 baths1,120 sq. ft.
3860 Schooner Trail, Chesapeake, VA 23321
MLS# 10614766Listed by: Howard Hanna Real Estate Svcs. $449,900Active4 beds 3 baths2,842 sq. ft.
4646 Longleaf Place, Chesapeake, VA 23321
MLS# 10614629Listed by: KW Coastal Virginia Chesapeake $639,740Pending5 beds 4 baths3,224 sq. ft.
5128 Duxbury Road, Suffolk, VA 23435
MLS# 10614193Listed by: D R Horton Realty of Virginia $599,900Active4 beds 3 baths2,000 sq. ft.
1530 Jolliff Road, Chesapeake, VA 23321
MLS# 10613272Listed by: BHHS RW Towne Realty $150,000Pending3 beds 1 baths900 sq. ft.
4440 S Military Highway, Chesapeake, VA 23321
MLS# 10613052Listed by: VA Realty Professionals $559,345Pending4 beds 3 baths2,468 sq. ft.
2212 Captiva Lane, Chesapeake, VA 23321
MLS# 10611927Listed by: Corinth Realty LLC $516,909Pending4 beds 3 baths2,880 sq. ft.
4728 Mahogany Run, Chesapeake, VA 23321
MLS# 10611933Listed by: BHHS RW Towne Realty $539,900Pending4 beds 2 baths2,183 sq. ft.
5110 Annapolis Drive, Chesapeake, VA 23321
MLS# 10609789Listed by: RHOAD & CO. $609,900Active6 beds 3 baths2,812 sq. ft.
MM Myrtle Ii, Chesapeake, VA 23321
MLS# 10609830Listed by: RHOAD & CO. $650,000Pending6 beds 3 baths3,000 sq. ft.
2219 Captiva Lane, Chesapeake, VA 23321
MLS# 10608812Listed by: RHOAD & CO. $381,900Active3 beds 3 baths1,642 sq. ft.
MM The Grove (laurel), Chesapeake, VA 23321
MLS# 10607970Listed by: Corinth Realty LLC $537,000Pending4 beds 3 baths2,614 sq. ft.
4730 Mahogany Run, Chesapeake, VA 23321
MLS# 10606876Listed by: BHHS RW Towne Realty $550,519Pending4 beds 3 baths2,454 sq. ft.
5029 Duxbury Road, Chesapeake, VA 23321
MLS# 10604040Listed by: Corinth Realty LLC $676,263Pending4 beds 4 baths2,969 sq. ft.
2241 Captiva Lane, Chesapeake, VA 23321
MLS# 10603969Listed by: RHOAD & CO. $574,193Pending5 beds 4 baths2,661 sq. ft.
5000 Cape May Loop, Chesapeake, VA 23321
MLS# 10600680Listed by: Corinth Realty LLC $548,234Pending4 beds 3 baths2,468 sq. ft.
5021 Duxbury Road, Chesapeake, VA 23321
MLS# 10600687Listed by: Corinth Realty LLC $760,000Pending5 beds 4 baths3,384 sq. ft.
4413 Mccaan Quay, Chesapeake, VA 23321
MLS# 10599939Listed by: Seaside Realty $69,900Pending0.53 Acres
13 Truitt Road, Chesapeake, VA 23321
MLS# 10600536Listed by: CENTURY 21 Nachman Realty $69,900Pending0.53 Acres
14 Truitt Road, Chesapeake, VA 23321
MLS# 10600537Listed by: CENTURY 21 Nachman Realty $539,900Pending4 beds 2 baths2,335 sq. ft.
2221 Captiva Lane, Chesapeake, VA 23321
MLS# 10600541Listed by: RHOAD & CO. $319,500Pending3 beds 3 baths1,870 sq. ft.
2613 Leytonstone Drive #377, Chesapeake, VA 23321
MLS# 10599774Listed by: XRealty.NET LLC $505,422Pending4 beds 3 baths2,880 sq. ft.
4611 Longleaf Place, Chesapeake, VA 23321
MLS# 10599827Listed by: BHHS RW Towne Realty $542,900Pending4 beds 3 baths2,400 sq. ft.
2239 Captiva Lane, Chesapeake, VA 23321
MLS# 10597348Listed by: RHOAD & CO. $545,400Pending4 beds 3 baths2,420 sq. ft.
2243 Captiva Lane, Chesapeake, VA 23321
MLS# 10595123Listed by: RHOAD & CO. $559,900Pending4 beds 3 baths2,520 sq. ft.
2237 Captiva Lane, Chesapeake, VA 23321
MLS# 10595130Listed by: RHOAD & CO. $564,690Pending4 beds 2 baths2,335 sq. ft.
2231 Captiva Lane, Chesapeake, VA 23321
MLS# 10594839Listed by: RHOAD & CO. $394,860Pending3 beds 3 baths1,642 sq. ft.
4912 Breck Lane, Chesapeake, VA 23321
MLS# 10594012Listed by: Corinth Realty LLC $446,711Pending3 beds 4 baths2,044 sq. ft.
4910 Breck Lane, Chesapeake, VA 23321
MLS# 10594014Listed by: Corinth Realty LLC $315,000Pending3 beds 3 baths1,900 sq. ft.
2516 Leytonstone Drive, Chesapeake, VA 23321
MLS# 10591465Listed by: Allison James Estates and Homes of Virginia LLC $500,795Pending3 beds 3 baths2,626 sq. ft.
2133 Mainsail Drive, Carrollton, VA 23314
MLS# 10591051Listed by: BHHS RW Towne Realty $539,900Pending4 beds 3 baths2,194 sq. ft.
2220 Captiva Lane, Chesapeake, VA 23321
MLS# 10589247Listed by: Corinth Realty LLC $511,100Pending4 beds 3 baths2,194 sq. ft.
2207 Sanibel Lane, Chesapeake, VA 23321
MLS# 10588678Listed by: Corinth Realty LLC $634,900Pending4 beds 3 baths3,105 sq. ft.
2245 Captiva Lane, Chesapeake, VA 23321
MLS# 10588725Listed by: RHOAD & CO. $490,000Active3 beds 3 baths2,214 sq. ft.
904 Flintfield Crescent, Chesapeake, VA 23321
MLS# 10588377Listed by: KW Coastal Virginia Chesapeake $415,400Pending3 beds 4 baths2,044 sq. ft.
4930 Breck Lane, Chesapeake, VA 23321
MLS# 10583052Listed by: Corinth Realty LLC $544,900Pending4 beds 3 baths2,880 sq. ft.
2217 Captiva Lane, Chesapeake, VA 23321
MLS# 10582011Listed by: RHOAD & CO. $509,900Pending4 beds 2 baths2,183 sq. ft.
5025 Annapolis Drive, Chesapeake, VA 23321
MLS# 10577415Listed by: RHOAD & CO. $285,000Pending3 beds 2 baths1,300 sq. ft.
3404 Newport Drive, Chesapeake, VA 23321
MLS# 10426693Listed by: Keffer Realty $495,831Pending3 beds 3 baths2,433 sq. ft.
4706 Mahogany Run, Chesapeake, VA 23321
MLS# 10548494Listed by: BHHS RW Towne Realty $639,900Pending4 beds 4 baths2,982 sq. ft.
5031 Annapolis Drive, Chesapeake, VA 23321
MLS# 10573232Listed by: RHOAD & CO. $559,900Pending4 beds 3 baths2,520 sq. ft.
2213 Captiva Lane, Chesapeake, VA 23321
MLS# 10567625Listed by: RHOAD & CO. $569,900Pending4 beds 3 baths2,700 sq. ft.
5005 Annapolis Drive, Chesapeake, VA 23321
MLS# 10559874Listed by: RHOAD & CO. $459,000Pending4 beds 3 baths2,385 sq. ft.
4448 S Military Highway, Chesapeake, VA 23321
MLS# 10610795Listed by: Melody Matthews&Assoc.RE Prof
Local realty services provided by:CENTURY 21 Realty @ Home, CENTURY 21 Reilly Realtors
The listings data displayed on this medium comes in part from the Real Estate Information Network Inc. (REIN) and has been authorized by participating listing Broker Members of REIN for display. REIN's listings are based upon Data submitted by its Broker Members, and REIN therefore makes no representation or warranty regarding the accuracy of the Data. All users of REIN's listings database should confirm the accuracy of the listing information directly with the listing agent. 2026 REIN. REIN's listings Data and information is protected under federal copyright laws. Federal law prohibits, among other acts, the unauthorized copying or alteration of, or preparation of derivative works from, all or any part of copyrighted materials, including certain compilations of Data and information. COPYRIGHT VIOLATORS MAY BE SUBJECT TO SEVERE FINES AND PENALTIES UNDER FEDERAL LAW. REIN updates its listings on a daily basis. Data last updated: December 24, 2025 This application does not include information on all of the properties available for sale at this time.
Some listings may be duplicated in the search results due to the co-mingling of listings from more than one multiple listing service. Should there be different listing information between the duplicated listings; user is advised to verify the accuracy of the listing information before making any financial decisions.
2026 REIN, Inc. Information Deemed Reliable But Not Guaranteed.
Popular searches near 23321
Popular neighborhoods near 23321
- Camelot, Chesapeake homes for sale
- College Park, Virginia Beach homes for sale
- Deep Creek, Chesapeake homes for sale
- Downtown, Portsmouth homes for sale
- Huntington, Newport News homes for sale
- Indian River, Chesapeake homes for sale
- Marshall, Newport News homes for sale
- Military Highway Corridor, Virginia Beach homes for sale
- Newsome, Newport News homes for sale
- Norfolk Highlands, Chesapeake homes for sale
- NS Norfolk, Norfolk homes for sale
- Olde Towne, Portsmouth homes for sale
- Rivercrest, Chesapeake homes for sale
- Salters Creek, Newport News homes for sale
- South Norfolk, Chesapeake homes for sale
- Stuart Gardens, Newport News homes for sale
- Tuckers Creek, Newport News homes for sale
- Uptown, Portsmouth homes for sale
- Western Branch, Chesapeake homes for sale
- Wickham, Newport News homes for sale
Counties near Chesapeake, 23321
- Camden County homes for sale
- Chesapeake city County homes for sale
- Franklin city County homes for sale
- Gates County homes for sale
- Hampton city County homes for sale
- Isle of Wight County homes for sale
- James City County homes for sale
- Newport News city County homes for sale
- Norfolk city County homes for sale
- Northampton County homes for sale
- Pasquotank County homes for sale
- Perquimans County homes for sale
- Poquoson city County homes for sale
- Portsmouth city County homes for sale
- Southampton County homes for sale
- Suffolk city County homes for sale
- Surry County homes for sale
- Virginia Beach city County homes for sale
- Williamsburg city County homes for sale
- York County homes for sale
Protect your home and budget from life's surprises with an Assurant Home Warranty, backed by a partner that supports you through every step of homeownership. Explore Plans.
©2026 Century 21 Real Estate LLC. All rights reserved. CENTURY 21®, the CENTURY 21 Logo and C21® are service marks owned by Century 21 Real Estate LLC. Century 21 Real Estate LLC fully supports the principles of the Fair Housing Act and the Equal Opportunity Act. Each office is independently owned and operated. Listing information is deemed reliable but not guaranteed accurate.