- Adams properties for sale
- Beverly properties for sale
- Beverly properties for sale
- Caldwell properties for sale
- Cumberland properties for sale
- Devola properties for sale
- Elk properties for sale
- Lawrence properties for sale
- Lowell properties for sale
- Lower Salem properties for sale
- Marietta properties for sale
- Muskingum properties for sale
- Noble properties for sale
- Olive properties for sale
- Salem properties for sale
- Seneca properties for sale
- Summerfield properties for sale
- Waterford properties for sale
- Waterford Township properties for sale
- Whipple properties for sale
45727, OH - homes for sale
3 of 3 results displayed
 $89,000Active3 beds 1 baths2,247 sq. ft.
128 Main Street, Dexter City, OH 45727
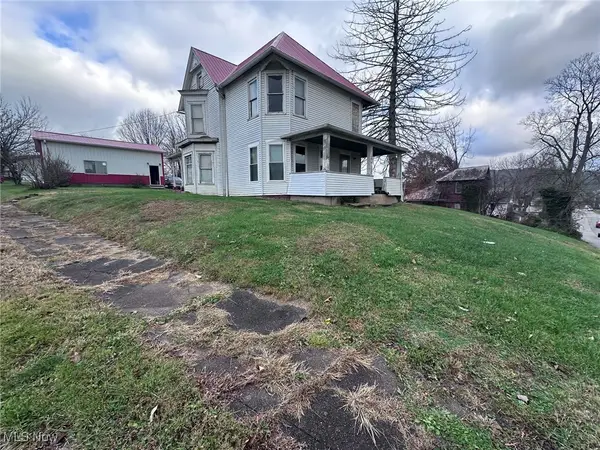
MLS# 5173859Listed by: IMPACT REALTY GROUP OF GREATER OHIO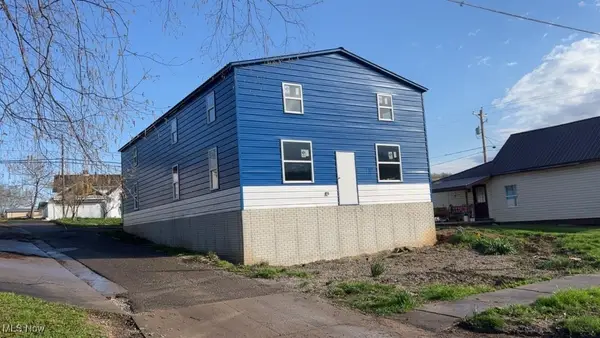 $195,000Active4 beds 2 baths3,290 sq. ft.
116 Main Street, Dexter City, OH 45727
MLS# 5163274Listed by: LEONARD AND NEWLAND REAL ESTATE SERVICES $325,000Active76 Acres
38100 Ogles Ridge Road, Dexter City, OH 45727
MLS# 5155233Listed by: KAUFMAN REALTY & AUCTION, LLC
Local realty services provided by:CENTURY 21 DeAnna Realty
Popular searches near 45727
Popular neighborhoods near 45727
- Abby Trails, Canal Winchester properties for sale
- Beech Wood Trails, Pataskala properties for sale
- Big Walnut, Columbus properties for sale
- Blacklick Estates, Columbus properties for sale
- Brice, Canal Winchester properties for sale
- Broad-McNaughten, Columbus properties for sale
- Cedar Heights, Lancaster properties for sale
- East Columbus, Columbus properties for sale
- Eastland, Columbus properties for sale
- George's Creek, Canal Winchester properties for sale
- Greenbriar Farm, Columbus properties for sale
- Independence Village, Canal Winchester properties for sale
- Livingston, Columbus properties for sale
- Oakmont, Columbus properties for sale
- Rolling Meadows, Johnstown properties for sale
- Shannon Square, Canal Winchester properties for sale
- Turnberry, Pickerington properties for sale
- Walnut Heights, Columbus properties for sale
- White Ash, Canal Winchester properties for sale
- Winchester, Groveport properties for sale
Counties near Dexter City, 45727
- Athens County properties for sale
- Belmont County properties for sale
- Coshocton County properties for sale
- Doddridge County properties for sale
- Guernsey County properties for sale
- Harrison County properties for sale
- Marshall County properties for sale
- Meigs County properties for sale
- Monroe County properties for sale
- Morgan County properties for sale
- Muskingum County properties for sale
- Noble County properties for sale
- Perry County properties for sale
- Pleasants County properties for sale
- Ritchie County properties for sale
- Tyler County properties for sale
- Washington County properties for sale
- Wetzel County properties for sale
- Wirt County properties for sale
- Wood County properties for sale
©2025 Century 21 Real Estate LLC. All rights reserved. CENTURY 21®, the CENTURY 21 Logo and C21® are service marks owned by Century 21 Real Estate LLC. Century 21 Real Estate LLC fully supports the principles of the Fair Housing Act and the Equal Opportunity Act. Each office is independently owned and operated. Listing information is deemed reliable but not guaranteed accurate.
©2025 Century 21 Real Estate LLC. All rights reserved. CENTURY 21®, the CENTURY 21 Logo and C21® are service marks owned by Century 21 Real Estate LLC. Century 21 Real Estate LLC fully supports the principles of the Fair Housing Act and the Equal Opportunity Act. Each office is independently owned and operated. Listing information is deemed reliable but not guaranteed accurate.