- Alta Loma properties for sale
- Bloomington properties for sale
- Cedarpines Park properties for sale
- Colton properties for sale
- Crestline properties for sale
- Fontana properties for sale
- Grand Terrace properties for sale
- Highgrove properties for sale
- Jurupa Valley properties for sale
- Lytle Creek properties for sale
- Mira Loma properties for sale
- Mt Baldy properties for sale
- Mount Baldy-Wrightwood properties for sale
- Muscoy properties for sale
- Ontario properties for sale
- Rancho Cucamonga properties for sale
- Rialto properties for sale
- San Antonio Heights properties for sale
- San Bernardino properties for sale
- Upland properties for sale
92336, CA - homes for sale
300 of 321 results displayed
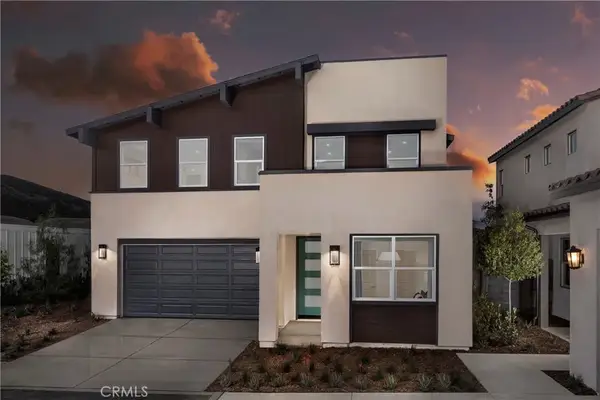
- Open Sat, 11am to 1:30pmNew
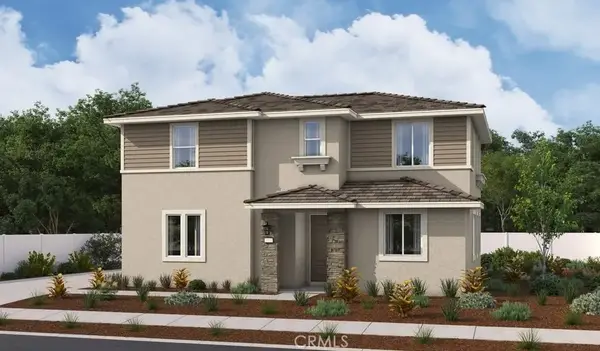
 $624,900Active3 beds 2 baths1,395 sq. ft.
17190 Melon Avenue, Fontana, CA 92336
MLS# IV26041289Listed by: ANOMALY REAL ESTATE - New
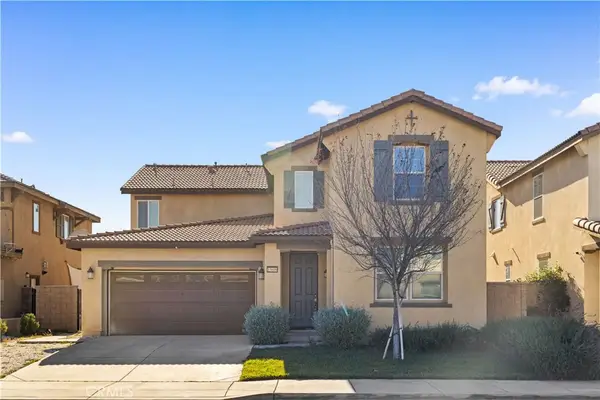
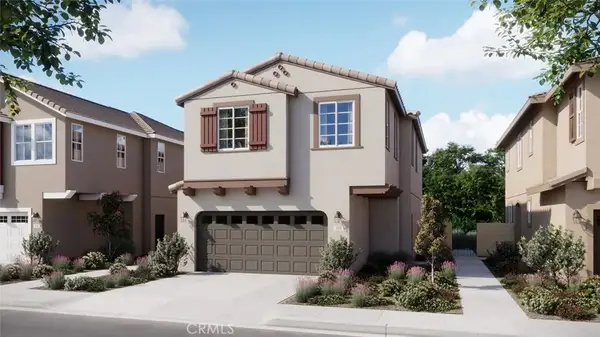
 $799,999Active4 beds 3 baths2,532 sq. ft.
14834 Shetland Lane, Fontana, CA 92336
MLS# CL26655393Listed by: THE AGENCY - Open Sat, 12 to 3pmNew
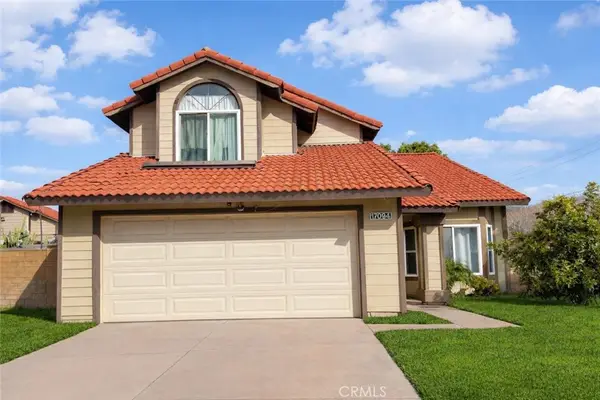
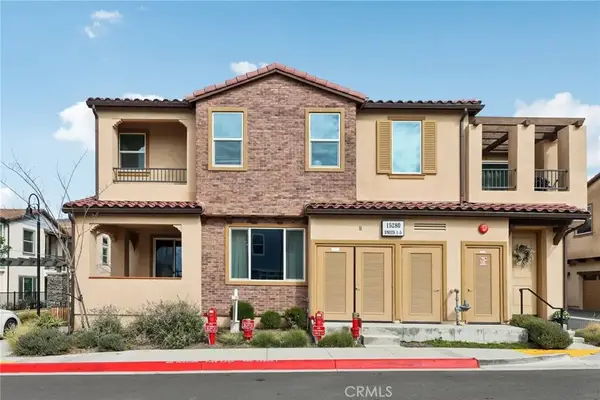 $540,000Active3 beds 3 baths1,788 sq. ft.
15280 Horizon #2, Fontana, CA 92336
MLS# CV26032867Listed by: REDFIN CORPORATION - Open Sat, 12 to 3pmNew
 $540,000Active3 beds 3 baths1,788 sq. ft.
15280 Horizon #2, Fontana, CA 92336
MLS# CV26032867Listed by: REDFIN CORPORATION - Open Sat, 1 to 4pmNew
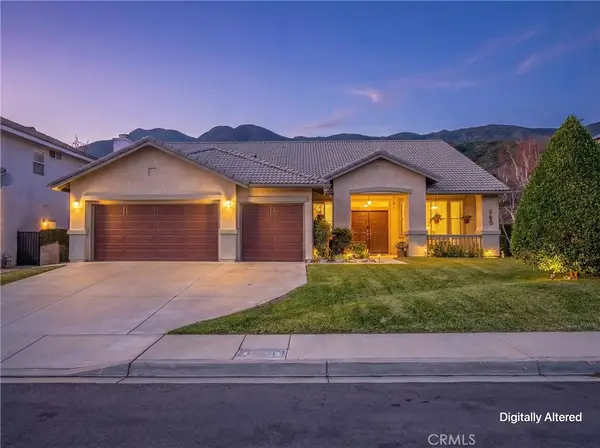
 $730,000Active4 beds 3 baths2,301 sq. ft.
6949 Dewpoint Way, Fontana, CA 92336
MLS# CV26039217Listed by: DYNASTY REAL ESTATE - New
 $699,000Active4 beds 3 baths2,054 sq. ft.
15345 Bellflower Lane, Fontana, CA 92336
MLS# CRCV26038826Listed by: INFINITY REALTY SALES CO - New
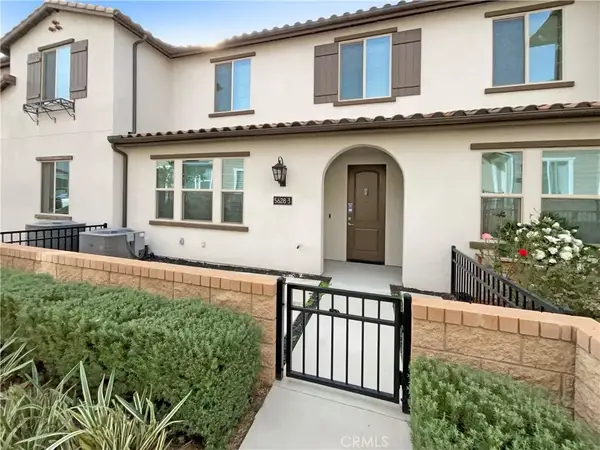 $545,000Active2 beds 3 baths1,556 sq. ft.
5628 Kate Way #3, Fontana, CA 92336
MLS# IV26038273Listed by: OPENDOOR BROKERAGE INC. - Open Sat, 1 to 4pmNew
 $609,000Active3 beds 4 baths1,642 sq. ft.
7194 Crescrendo Lane, Fontana, CA 92336
MLS# CV26034774Listed by: COMPASS - New
 $135,000Active2 beds 1 baths1,700 sq. ft.
7605 E Obsidian, Cantil, CA 93519
MLS# HD26038151Listed by: KELLER WILLIAMS VICTOR VALLEY - Open Sat, 11am to 4pmNew
 $536,990Active3 beds 2 baths1,530 sq. ft.
16582 Bottlebrush Lane #1, Fontana, CA 92336
MLS# OC26037404Listed by: THE NEW HOME COMPANY - New
 $550,393Active3 beds 3 baths1,584 sq. ft.
15525 April Dawn Way #2, Fontana, CA 92336
MLS# SW26037835Listed by: D R HORTON AMERICA'S BUILDER - New
 $1,290,000Active7 beds 6 baths3,857 sq. ft.
17548 Court Street, Fontana, CA 92336
MLS# WS26037930Listed by: IRN REALTY - Open Sat, 11am to 4pmNew
 $536,990Active3 beds 2 baths1,530 sq. ft.
16582 Bottlebrush Lane #1, Fontana, CA 92336
MLS# OC26037404Listed by: THE NEW HOME COMPANY - New
 $1,049,990Active4 beds 3 baths2,375 sq. ft.
15919 Conservatory Drive, Fontana, CA 92336
MLS# OC26036115Listed by: KELLER WILLIAMS REALTY - New
 $624,000Active3 beds 3 baths1,926 sq. ft.
16281 Castello Lane #2, Fontana, CA 92336
MLS# CV26035906Listed by: PAK HOME REALTY  $515,000Pending4 beds 2 baths1,599 sq. ft.
7345 Palm, Fontana, CA 92336
MLS# IV26037113Listed by: RE/MAX TIME REALTY- New
 $715,945Active4 beds 4 baths2,074 sq. ft.
5164 Currant Way, Fontana, CA 92336
MLS# IG26036532Listed by: RICHMOND AMERICAN HOMES - New
 $725,446Active4 beds 4 baths2,120 sq. ft.
16535 Shallot Street, Fontana, CA 92336
MLS# IG26036553Listed by: RICHMOND AMERICAN HOMES - New
 $624,000Active3 beds 3 baths1,926 sq. ft.
16281 Castello Lane #2, Fontana, CA 92336
MLS# CV26035906Listed by: PAK HOME REALTY - New
 $738,800Active4 beds 3 baths2,791 sq. ft.
15609 Paprika Lane, Fontana, CA 92336
MLS# WS26036944Listed by: PINNACLE REAL ESTATE GROUP - Open Sat, 2 to 4pmNew
 $650,000Active4 beds 3 baths1,811 sq. ft.
17094 Cambria, Fontana, CA 92336
MLS# TR26036799Listed by: REAL BROKER - New
 $725,446Active4 beds 4 baths2,120 sq. ft.
16535 Shallot Street, Fontana, CA 92336
MLS# IG26036553Listed by: RICHMOND AMERICAN HOMES - New
 $715,945Active4 beds 4 baths2,074 sq. ft.
5164 Currant Way, Fontana, CA 92336
MLS# IG26036532Listed by: RICHMOND AMERICAN HOMES - New
 $699,900Active3 beds 2 baths1,946 sq. ft.
16590 Shafer Court, Fontana, CA 92336
MLS# IV26036061Listed by: ANOMALY REAL ESTATE - New
 $624,999Active3 beds 3 baths2,213 sq. ft.
5313 Teramo, Fontana, CA 92336
MLS# CV26035898Listed by: WERE REAL ESTATE - New
 $799,900Active4 beds 2 baths2,315 sq. ft.
14730 Reservoir, Fontana, CA 92336
MLS# CV26034932Listed by: RE/MAX TOP PRODUCERS - New
 $889,910Active5 beds 3 baths3,666 sq. ft.
14573 Calgary, Fontana, CA 92336
MLS# IV26035352Listed by: CAMDEN MCKAY REALTY - New
 $849,990Active4 beds 3 baths2,362 sq. ft.
6617 Logan Avenue, Fontana, CA 92336
MLS# CV26034540Listed by: PRODIGY ESTATES GROUP - Open Sat, 12 to 2:30pmNew
 $549,900Active3 beds 3 baths1,280 sq. ft.
6650 Carmel Court, Fontana, CA 92336
MLS# RS26033946Listed by: KELLER WILLIAMS REALTY  $699,000Pending4 beds 3 baths2,358 sq. ft.
15783 Ralph Lane, Fontana, CA 92336
MLS# IV26033518Listed by: KJ REALTY GROUP INC.- New
 $564,118Active3 beds 3 baths1,500 sq. ft.
16206 Lumia Way, Fontana, CA 92336
MLS# CRSW26032268Listed by: D R HORTON AMERICA'S BUILDER - New
 $650,000Active4 beds 2 baths1,366 sq. ft.
7470 Ginger, Fontana, CA 92336
MLS# CV26033932Listed by: ONE WEST REALTY INC  $649,000Active3 beds 3 baths1,726 sq. ft.
16729 Wyndham, Fontana, CA 92336
MLS# CV26033895Listed by: 6550 REALTY GROUP $569,900Active3 beds 2 baths1,125 sq. ft.
15465 Raymond Avenue, Fontana, CA 92336
MLS# CV26033861Listed by: SYNERGY ONE REAL ESTATE $660,000Active3 beds 3 baths1,895 sq. ft.
5664 Kate Way #2, Fontana, CA 92336
MLS# DW25277730Listed by: RE/MAX DYNASTY $924,900Active5 beds 5 baths3,301 sq. ft.
7786 Arosia Dr, Fontana, CA 92336
MLS# HD26032468Listed by: REALTY ONE GROUP EMPIRE $649,800Active4 beds 2 baths1,354 sq. ft.
7714 Acacia, Fontana, CA 92336
MLS# TR26031081Listed by: UNIVERSAL ELITE INC. $699,999Pending3 beds 2 baths2,032 sq. ft.
5725 Ridgemark, Fontana, CA 92336
MLS# HD26032364Listed by: REAL BROKERAGE TECHNOLOGIES $699,000Active4 beds 3 baths1,752 sq. ft.
7119 Birch Tree Place, Fontana, CA 92336
MLS# PW26031533Listed by: SEVEN GABLES REAL ESTATE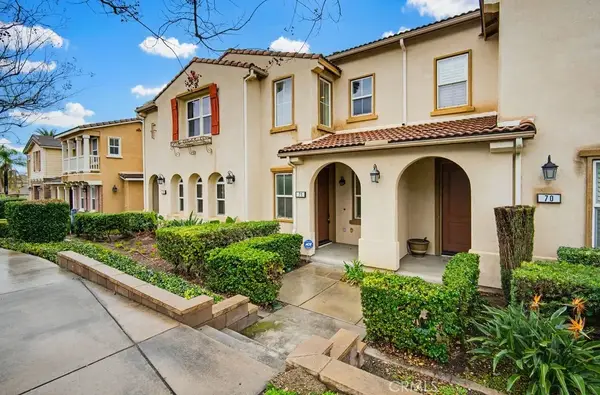 $475,000Active2 beds 2 baths1,282 sq. ft.
14975 S Highland #71, Fontana, CA 92336
MLS# NP26032352Listed by: BERKSHIRE HATHAWAY HOMESERVICES LIFESTYLE PROP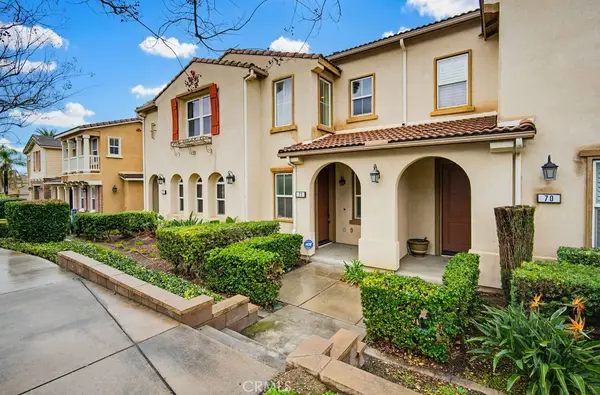 $475,000Active2 beds 2 baths1,282 sq. ft.
14975 S Highland #71, Fontana, CA 92336
MLS# NP26032352Listed by: BERKSHIRE HATHAWAY HOMESERVICES LIFESTYLE PROP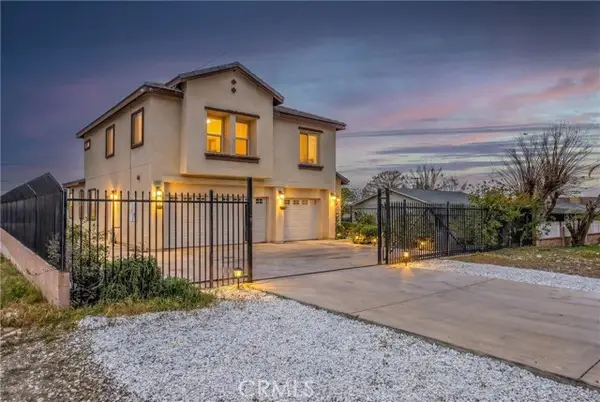 $829,000Active5 beds 3 baths2,562 sq. ft.
15879 Highland, Fontana, CA 92336
MLS# CRCV26028207Listed by: REALTY MASTERS & ASSOCIATES $650,000Active3 beds 2 baths1,343 sq. ft.
7425 Palo Verde, Fontana, CA 92336
MLS# IG26031454Listed by: ELEVATE REAL ESTATE AGENCY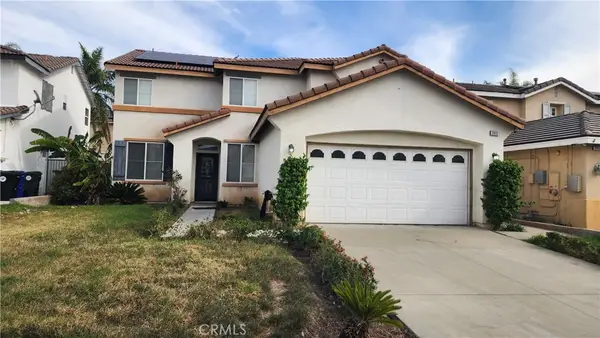 $650,000Pending6 beds 3 baths2,676 sq. ft.
7411 Olympia, Fontana, CA 92336
MLS# SW26031574Listed by: BOLD REALTY GROUP $659,000Active3 beds 3 baths1,322 sq. ft.
13606 Crawford Court, Fontana, CA 92336
MLS# CV26030626Listed by: EXP REALTY OF SOUTHERN CALIFORNIA INC $680,000Pending3 beds 3 baths1,718 sq. ft.
5176 Wintercress, Fontana, CA 92336
MLS# CV26029433Listed by: JCE REALTY $469,000Active2 beds 2 baths1,183 sq. ft.
15280 Horizon St #6, Fontana, CA 92336
MLS# CROC26030565Listed by: WEST CAPITAL REAL ESTATE
 $724,999Active4 beds 3 baths2,499 sq. ft.
16763 Plantain, Fontana, CA 92336
MLS# CV26029654Listed by: CENTURY 21 CITRUS REALTY INC $690,000Active4 beds 3 baths1,926 sq. ft.
16255 Castello #2, Fontana, CA 92336
MLS# IG26029643Listed by: JWILLIAN REALTY $995,000Active4 beds 3 baths3,101 sq. ft.
4903 Edmonton, Fontana, CA 92336
MLS# CV26030230Listed by: OPTION ONE REAL ESTATE $690,000Active4 beds 3 baths1,926 sq. ft.
16255 Castello #2, Fontana, CA 92336
MLS# IG26029643Listed by: JWILLIAN REALTY $775,000Active5 beds 3 baths2,676 sq. ft.
14122 Mendocino, Fontana, CA 92236
MLS# CV26029392Listed by: THOMAS RIOS, BROKER $755,990Active4 beds 3 baths2,875 sq. ft.
7170 Melody Drive, Fontana, CA 92336
MLS# IV26029383Listed by: BRIAN KENSINGER, BROKER $599,000Active4 beds 3 baths1,936 sq. ft.
16564 El Revino, Fontana, CA 92336
MLS# TR26029125Listed by: PINNACLE REAL ESTATE GROUP $849,000Active4 beds 3 baths2,924 sq. ft.
5388 Wrangler Drive, Fontana, CA 92336
MLS# CV26028519Listed by: MAJOR LEAGUE REAL ESTATE $774,900Active5 beds 3 baths2,751 sq. ft.
7915 Ocean, Fontana, CA 92336
MLS# OC26026773Listed by: REAL BROKER $890,000Active4 beds 4 baths3,664 sq. ft.
15621 Pisa Lane, Fontana, CA 92336
MLS# TR26028264Listed by: COLDWELL BANKER TRI-COUNTIES R $770,083Active4 beds 3 baths1,805 sq. ft.
6341 Sierra Vista Lane, Fontana, CA 92336
MLS# SW26027783Listed by: D R HORTON AMERICA'S BUILDER- Open Sun, 12 to 2pm
 $549,900Active2 beds 3 baths1,556 sq. ft.
5664 Kate Way #3, Fontana, CA 92336
MLS# IG26026479Listed by: REDFIN  $669,999Active4 beds 2 baths1,614 sq. ft.
5368 Mantova Court, Fontana, CA 92336
MLS# SR26026402Listed by: REALTY EXECUTIVES HOMES $869,000Active4 beds 3 baths3,289 sq. ft.
15519 Syracuse, Fontana, CA 92336
MLS# CV26026057Listed by: HOME HAVEN REALTY GROUP- Open Sun, 12 to 2pm
 $549,900Active2 beds 3 baths1,556 sq. ft.
5664 Kate Way #3, Fontana, CA 92336
MLS# IG26026479Listed by: REDFIN - Open Sat, 11am to 4pm
 $584,990Active3 beds 3 baths1,450 sq. ft.
15880 Blue Copper Way, Fontana, CA 92336
MLS# OC26026277Listed by: THE NEW HOME COMPANY - Open Sat, 11am to 4pm
 $1,174,990Active4 beds 4 baths3,160 sq. ft.
15797 Conservatory Drive, Fontana, CA 92336
MLS# OC26026185Listed by: THE NEW HOME COMPANY - Open Sat, 11am to 4pm
 $584,990Active3 beds 3 baths1,450 sq. ft.
15880 Blue Copper Way, Fontana, CA 92336
MLS# OC26026277Listed by: THE NEW HOME COMPANY  $775,000Active4 beds 3 baths3,107 sq. ft.
16765 Buttonwood, Fontana, CA 92336
MLS# CRPW26023889Listed by: ERNIE LIM, BROKER $799,000Active4 beds 3 baths3,035 sq. ft.
6228 S Kingsmill Court, Fontana, CA 92336
MLS# 26647271Listed by: HXP REAL ESTATE, INC. $699,999Pending3 beds 3 baths2,161 sq. ft.
4788 Condor, Fontana, CA 92336
MLS# CV26023463Listed by: MAINSTREET REALTORS $699,000Active4 beds 2 baths1,463 sq. ft.
5572 Horseshoe, Fontana, CA 92336
MLS# WS26024815Listed by: WEDGEWOOD HOMES REALTY $615,000Pending3 beds 3 baths1,916 sq. ft.
16724 Stags Leap, Fontana, CA 92336
MLS# PW26017623Listed by: ANGELIZA PALMA, BROKER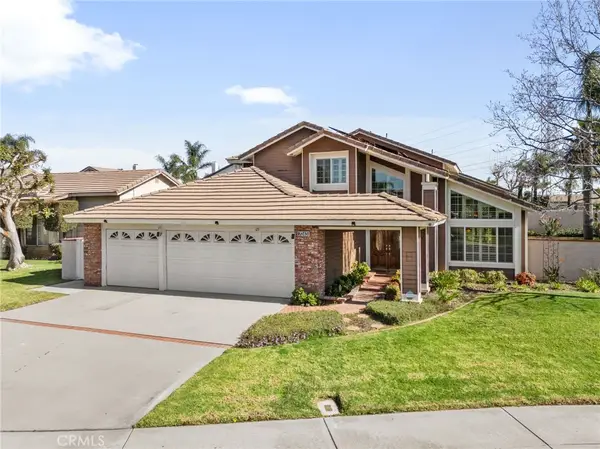 $800,000Active4 beds 3 baths2,070 sq. ft.
7243 Kittyhawk Street, Fontana, CA 92336
MLS# IG26021143Listed by: FIV REALTY CO. $899,000Active5 beds 5 baths3,923 sq. ft.
5015 Thornberry Way, Fontana, CA 92336
MLS# 219142513DAListed by: RONALD CHRISTOPHER & ASSOC. $749,000Pending4 beds 3 baths1,922 sq. ft.
7863 Iroquois, Fontana, CA 92336
MLS# TR26016743Listed by: RE/MAX TIME REALTY $799,998Active6 beds 3 baths3,287 sq. ft.
7526 Purple Sage, Fontana, CA 92336
MLS# CV26013146Listed by: RE/MAX TIME REALTY $912,000Active5 beds 3 baths3,683 sq. ft.
15064 Fawn Court, Fontana, CA 92336
MLS# SR26023536Listed by: MICHAEL GREEN REALTY & INV. $724,900Pending4 beds 3 baths1,889 sq. ft.
16422 Empire Lakes Court, Fontana, CA 92336
MLS# CV26020176Listed by: COMPASS $839,000Active4 beds 3 baths2,540 sq. ft.
14528 Oxer Court, Fontana, CA 92336
MLS# CRCV26019733Listed by: NEST REAL ESTATE $1,119,999Active6 beds 5 baths4,122 sq. ft.
5149 Sammy Hagar, Fontana, CA 92336
MLS# PW26022166Listed by: CIRCLE REAL ESTATE- Open Sat, 11am to 4pm
 $583,990Pending4 beds 3 baths1,567 sq. ft.
16573 Bottlebrush Lane #2, Fontana, CA 92336
MLS# OC26022462Listed by: THE NEW HOME COMPANY - Open Sat, 11am to 4pm
 $583,990Pending4 beds 3 baths1,567 sq. ft.
16573 Bottlebrush Lane #2, Fontana, CA 92336
MLS# OC26022462Listed by: THE NEW HOME COMPANY  $735,000Active4 beds 3 baths2,098 sq. ft.
7348 Elderberry Court, Fontana, CA 92336
MLS# 219142387DAListed by: COLDWELL BANKER REALTY $659,000Active5 beds 3 baths1,927 sq. ft.
5644 Altamura Way, Fontana, CA 92336
MLS# IV26005590Listed by: WIEST REALTY INC $899,000Active6 beds 6 baths3,814 sq. ft.
15860 Nuaimi, Fontana, CA 92336
MLS# WS26020678Listed by: REAL BROKERAGE TECHNOLOGIES- Open Sun, 12 to 3pm
 $729,000Active4 beds 3 baths2,290 sq. ft.
7082 Mallow Drive #2, Fontana, CA 92336
MLS# PW26017717Listed by: ARAMIS REALTY GROUP INC.  $649,000Active4 beds 3 baths1,421 sq. ft.
17090 Micallef, Fontana, CA 92336
MLS# OC26021000Listed by: COMPASS $479,900Active2 beds 2 baths1,224 sq. ft.
16001 Chase Road #72, Fontana, CA 92336
MLS# CV26020179Listed by: OMEGA REAL ESTATE $479,900Active2 beds 2 baths1,224 sq. ft.
16001 Chase Road #72, Fontana, CA 92336
MLS# CRCV26020179Listed by: OMEGA REAL ESTATE $849,000Active4 beds 3 baths2,419 sq. ft.
6335 Casey, Fontana, CA 92336
MLS# TR26020530Listed by: KELLER WILLIAMS- Open Sun, 12 to 3pm
 $729,000Active4 beds 3 baths2,290 sq. ft.
7082 Mallow Drive #2, Fontana, CA 92336
MLS# PW26017717Listed by: ARAMIS REALTY GROUP INC.  $739,000Active5 beds 3 baths2,621 sq. ft.
15359 Palm Leaf, Fontana, CA 92336
MLS# CRIG26008553Listed by: EXP REALTY OF CALIFORNIA INC. $599,900Active4 beds 3 baths1,899 sq. ft.
5604 Altamura Way #10, Fontana, CA 92336
MLS# IG26019128Listed by: KELLER WILLIAMS REALTY $850,000Active4 beds 3 baths3,375 sq. ft.
16224 Sun Glory Way, Fontana, CA 92336
MLS# IG26018686Listed by: SMART SELL REAL ESTATE $695,000Pending4 beds 3 baths2,470 sq. ft.
15841 Barletta, Fontana, CA 92336
MLS# WS26015637Listed by: WEDGEWOOD HOMES REALTY $789,000Active4 beds 3 baths2,749 sq. ft.
6208 Beth Page, Fontana, CA 92336
MLS# OC26012609Listed by: REAL BROKER $699,000Active3 beds 3 baths2,138 sq. ft.
16369 Medinah, Fontana, CA 92336
MLS# TR26017634Listed by: IRN REALTY $622,000Active4 beds 3 baths1,926 sq. ft.
16229 Castello Lane #6, Fontana, CA 92336
MLS# IG26017336Listed by: REALTY MASTERS & ASSOCIATES $920,000Active6 beds 5 baths3,340 sq. ft.
5891 Forest Oaks, Fontana, CA 92336
MLS# OC26006610Listed by: REAL BROKER $599,000Active3 beds 2 baths1,263 sq. ft.
15516 Raymond, Fontana, CA 92336
MLS# CV26016912Listed by: REALTY MASTERS & ASSOCIATES $648,000Pending4 beds 2 baths1,350 sq. ft.
7532 Marconia Court, Fontana, CA 92336
MLS# IG26016383Listed by: REALTY ONE GROUP WEST $611,000Active3 beds 2 baths1,358 sq. ft.
15362 Rockwell, Fontana, CA 92336
MLS# CRDW26016042Listed by: ROA CALIFORNIA INC. $599,999Active4 beds 3 baths1,895 sq. ft.
15901 Stresa Lane #6, Fontana, CA 92336
MLS# TR26016515Listed by: A + REALTY & MORTGAGE $760,000Active5 beds 3 baths2,908 sq. ft.
7667 Yellow Iris Court, Fontana, CA 92336
MLS# CV26013436Listed by: CALIFORNIA CURB APPEAL RPS $499,999Active3 beds 2 baths1,410 sq. ft.
7603 Date Avenue, Fontana, CA 92336
MLS# CV26012939Listed by: CENTURY 21 PRIMETIME REALTORS $910,000Active5 beds 3 baths3,365 sq. ft.
5416 Daytime, Fontana, CA 92336
MLS# CRIV26015351Listed by: CALIFORNIA 5 STAR REALTY $779,900Active4 beds 3 baths2,311 sq. ft.
15818 Caterpillar Dr, Fontana, CA 92336
MLS# CV25282455Listed by: KELLER WILLIAMS PREMIER PROPER- New
 $574,990Active3 beds 3 baths1,450 sq. ft.
15909 Blue Copper Way, Fontana, CA 92336
MLS# OC26036016Listed by: KELLER WILLIAMS REALTY  $779,900Active4 beds 3 baths2,311 sq. ft.
15818 Caterpillar Dr, Fontana, CA 92336
MLS# CV25282455Listed by: KELLER WILLIAMS PREMIER PROPER $644,900Active3 beds 3 baths1,240 sq. ft.
7918 Sierra Avenue, Fontana, CA 92336
MLS# CV26015468Listed by: COLDWELL BANKER ENVISION $999,990Pending5 beds 5 baths3,612 sq. ft.
15800 Conservatory Drive, Fontana, CA 92336
MLS# OC26014989Listed by: KELLER WILLIAMS REALTY- New
 $574,990Active3 beds 3 baths1,450 sq. ft.
15909 Blue Copper Way, Fontana, CA 92336
MLS# OC26036016Listed by: KELLER WILLIAMS REALTY  $739,900Pending3 beds 3 baths2,161 sq. ft.
5213 Archery Court, Fontana, CA 92336
MLS# WS26013277Listed by: RE/MAX 2000 REALTY $860,000Pending4 beds 3 baths2,420 sq. ft.
15002 Sagegrove Lane, Fontana, CA 92336
MLS# CV26013760Listed by: BERKSHIRE HATH HM SVCS CA PROP $668,890Active3 beds 2 baths1,550 sq. ft.
6934 Fremontia, Fontana, CA 92336
MLS# CV26000645Listed by: REALTY MASTERS & ASSOCIATES, IN $795,000Active4 beds 4 baths2,749 sq. ft.
16287 Pablo Creek, Fontana, CA 92336
MLS# IG26013582Listed by: ELEVATE REAL ESTATE AGENCY $949,000Active5 beds 3 baths3,423 sq. ft.
16053 Stevens Lane, Fontana, CA 92336
MLS# IG26014352Listed by: REDFIN $809,000Active4 beds 4 baths2,628 sq. ft.
15507 Vanilla Bean, Fontana, CA 92336
MLS# IV26013044Listed by: RE/MAX TIME REALTY $845,000Active3 beds 2 baths2,315 sq. ft.
14786 Reservoir Road, Fontana, CA 92336
MLS# TR26014436Listed by: 168 REALTY INC. $875,000Pending4 beds 3 baths2,648 sq. ft.
15532 Skylark Avenue, Fontana, CA 92336
MLS# CV26013329Listed by: RE/MAX TIME REALTY $540,000Active3 beds 3 baths1,953 sq. ft.
15723 Parkhouse #30, Fontana, CA 92336
MLS# TR26013215Listed by: REAL BROKER $998,800Active4 beds 4 baths3,080 sq. ft.
15842 Butterfly Drive, Fontana, CA 92336
MLS# PW26013036Listed by: VYLLA HOME, INC. $779,900Active3 beds 3 baths2,407 sq. ft.
7801 Sheridan, Fontana, CA 92336
MLS# CV26012330Listed by: PHUOC HUYNH, BROKER $694,918Active3 beds 3 baths1,650 sq. ft.
6373 Moonfire Lane, Fontana, CA 92336
MLS# SW26012280Listed by: D R HORTON AMERICA'S BUILDER $570,000Active3 beds 3 baths1,953 sq. ft.
15723 Parkhouse, Fontana, CA 92336
MLS# DW26010589Listed by: PLF REAL ESTATE SOLUTIONS $799,999Active3 beds 3 baths2,337 sq. ft.
5864 Backus Peak Way, Fontana, CA 92336
MLS# IG26012212Listed by: RED DOOR EXECUTIVE REALTY- Open Sat, 11am to 4pm
 $716,990Active4 beds 3 baths2,136 sq. ft.
4806 Milkweed Court, Fontana, CA 92336
MLS# OC26011285Listed by: THE NEW HOME COMPANY - Open Sat, 11am to 4pm
 $716,990Active4 beds 3 baths2,136 sq. ft.
4806 Milkweed Court, Fontana, CA 92336
MLS# OC26011285Listed by: THE NEW HOME COMPANY  $1,260,000Pending4 beds 3 baths3,500 sq. ft.
3070 Lytle Creek, Fontana, CA 92336
MLS# IV26003054Listed by: RE/MAX TIME REALTY- Open Sat, 11am to 4pm
 $676,990Active4 beds 3 baths1,870 sq. ft.
16557 Stone Pine Lane, Fontana, CA 92336
MLS# OC26010394Listed by: THE NEW HOME COMPANY - Open Sat, 11am to 4pm
 $676,990Active4 beds 3 baths1,870 sq. ft.
16557 Stone Pine Lane, Fontana, CA 92336
MLS# OC26010394Listed by: THE NEW HOME COMPANY 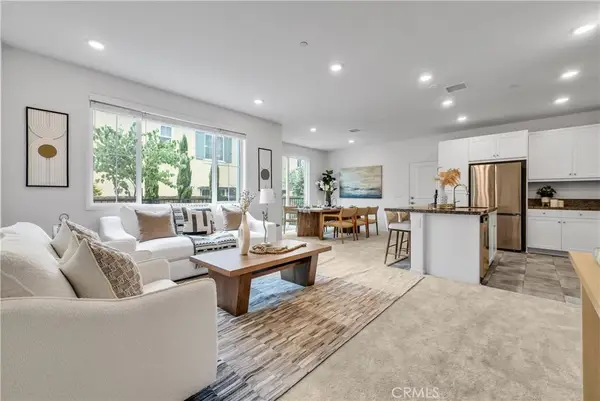 $590,000Active4 beds 3 baths1,927 sq. ft.
5584 Kate Way #10, Fontana, CA 92336
MLS# TR26010039Listed by: PINNACLE REAL ESTATE GROUP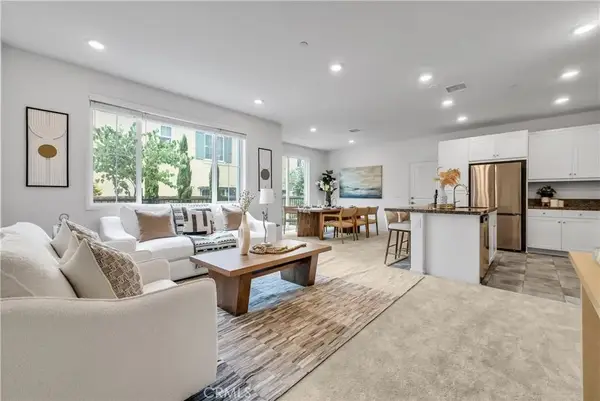 $590,000Active4 beds 3 baths1,927 sq. ft.
5584 Kate Way #10, Fontana, CA 92336
MLS# TR26010039Listed by: PINNACLE REAL ESTATE GROUP $799,990Active4 beds 3 baths2,473 sq. ft.
5825 Opal Court, Fontana, CA 92336
MLS# CRIV26009136Listed by: KELLER WILLIAMS EMPIRE ESTATES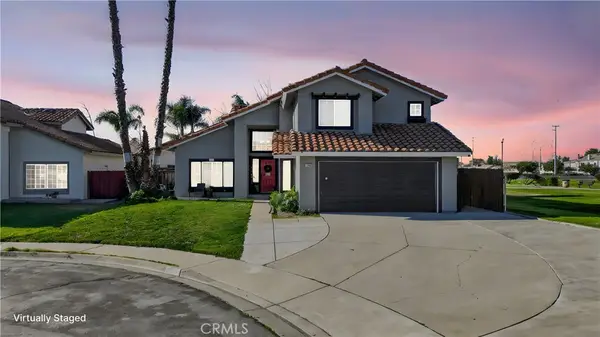 $749,900Pending5 beds 3 baths1,954 sq. ft.
13413 Pico Court, Fontana, CA 92336
MLS# CV26009938Listed by: ALIGN HOMES $731,525Active4 beds 3 baths1,805 sq. ft.
6363 Moonfire Lane, Fontana, CA 92336
MLS# SW26009872Listed by: D R HORTON AMERICA'S BUILDER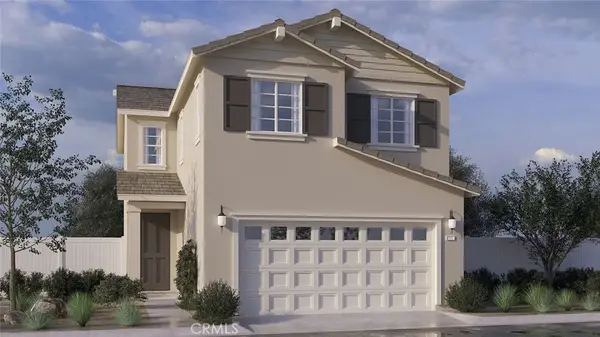 $682,605Pending3 beds 3 baths1,650 sq. ft.
6375 Moonfire Lane, Fontana, CA 92336
MLS# SW26009891Listed by: D R HORTON AMERICA'S BUILDER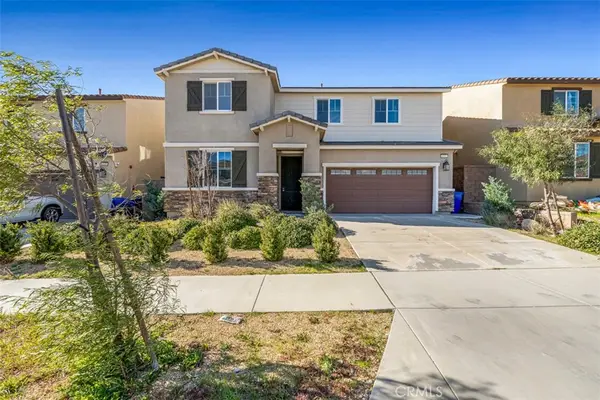 $730,000Active3 beds 3 baths2,703 sq. ft.
4352 Monarch Drive, Fontana, CA 92336
MLS# WS26007264Listed by: SUNSHINE INTERNATIONAL INV., INC.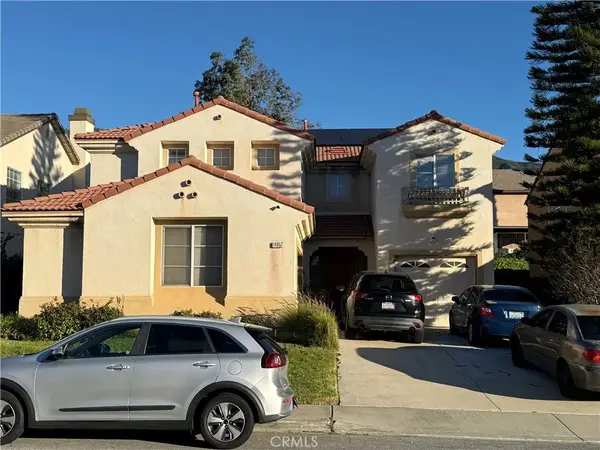 $649,900Pending4 beds 3 baths2,676 sq. ft.
14852 Rosetown, Fontana, CA 92336
MLS# CV26008947Listed by: RE/MAX CHAMPIONS- Open Sat, 11am to 4pm
 $634,990Active3 beds 3 baths1,654 sq. ft.
16554 Stone Pine Lane, Fontana, CA 92336
MLS# OC26008475Listed by: THE NEW HOME COMPANY  $537,131Pending3 beds 3 baths1,584 sq. ft.
15513 April Dawn Way #4, Fontana, CA 92336
MLS# SW26008929Listed by: D R HORTON AMERICA'S BUILDER- Open Sat, 11am to 4pm
 $634,990Active3 beds 3 baths1,654 sq. ft.
16554 Stone Pine Lane, Fontana, CA 92336
MLS# OC26008475Listed by: THE NEW HOME COMPANY  $899,990Pending5 beds 4 baths3,340 sq. ft.
6122 Glen Abbey Way, Fontana, CA 92336
MLS# CV26007151Listed by: OMEGA REAL ESTATE $929,900Active4 beds 4 baths3,194 sq. ft.
5385 La Bodega, Fontana, CA 92336
MLS# SR26007903Listed by: KELLER WILLIAMS REALTY ANTELOPE VALLEY $625,000Active4 beds 3 baths1,868 sq. ft.
16604 Quince Lane, Fontana, CA 92336
MLS# OC26005472Listed by: REAL BROKER $614,999Active3 beds 3 baths1,654 sq. ft.
15008 Gallery Way #1, Fontana, CA 92336
MLS# IG26007021Listed by: REALTY MASTERS & ASSOCIATES $614,999Active3 beds 3 baths1,654 sq. ft.
15008 Gallery Way #1, Fontana, CA 92336
MLS# IG26007021Listed by: REALTY MASTERS & ASSOCIATES $670,000Active3 beds 3 baths1,998 sq. ft.
6914 Stonecrop, Fontana, CA 92336
MLS# CV26006864Listed by: VISMAR REAL ESTATE $869,999Pending5 beds 4 baths2,617 sq. ft.
5264 Darwin, Fontana, CA 92336
MLS# IV26005988Listed by: LPT REALTY INC. $555,900Active4 beds 3 baths1,847 sq. ft.
15188 Horizon #7 Street, Fontana, CA 92336
MLS# IG26004776Listed by: REALTY MASTERS & ASSOCIATES- Open Sun, 12 to 1pm
 $685,000Active3 beds 3 baths1,567 sq. ft.
16442 El Revino Drive, Fontana, CA 92336
MLS# PW26005127Listed by: MACLONS CAPITAL REALTY  $825,000Active5 beds 3 baths2,720 sq. ft.
15765 Kings Peak Dr, Fontana, CA 92336
MLS# CRCV26005315Listed by: REALTY ONE GROUP WEST $700,000Active4 beds 3 baths1,956 sq. ft.
5814 Pine Valley Dr, Fontana, CA 92336
MLS# IV26004999Listed by: FIRST TEAM REAL ESTATE $562,232Active3 beds 3 baths1,500 sq. ft.
16208 Lumia Way, Fontana, CA 92336
MLS# SW26004805Listed by: D R HORTON AMERICA'S BUILDER $555,900Active4 beds 3 baths1,847 sq. ft.
15188 Horizon #7 Street, Fontana, CA 92336
MLS# IG26004776Listed by: REALTY MASTERS & ASSOCIATES $568,524Pending4 beds 3 baths1,602 sq. ft.
16202 Lumia Way, Fontana, CA 92336
MLS# SW26004622Listed by: D R HORTON AMERICA'S BUILDER $577,848Active4 beds 3 baths1,602 sq. ft.
16210 Lumia Way, Fontana, CA 92336
MLS# SW26004570Listed by: D R HORTON AMERICA'S BUILDER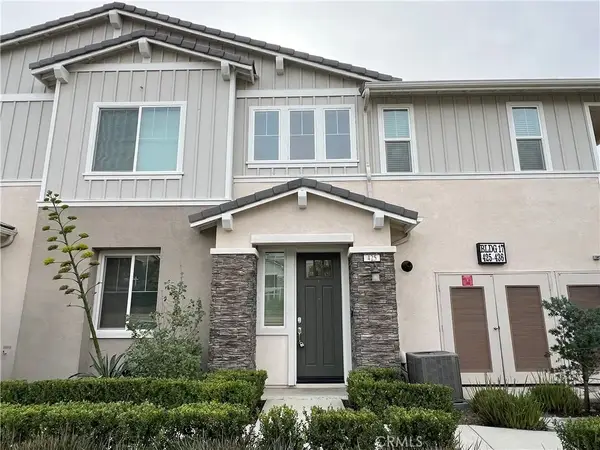 $405,000Pending1 beds 2 baths849 sq. ft.
16502 Casa Grande Avenue #425, Fontana, CA 92336
MLS# TR26004520Listed by: YAWA REALTY $405,000Pending1 beds 2 baths849 sq. ft.
16502 Casa Grande Avenue #425, Fontana, CA 92336
MLS# TR26004520Listed by: YAWA REALTY $599,000Active3 beds 3 baths1,824 sq. ft.
16125 Gelato Court #3, Fontana, CA 92336
MLS# IV26003718Listed by: PROVIDENCE REALTY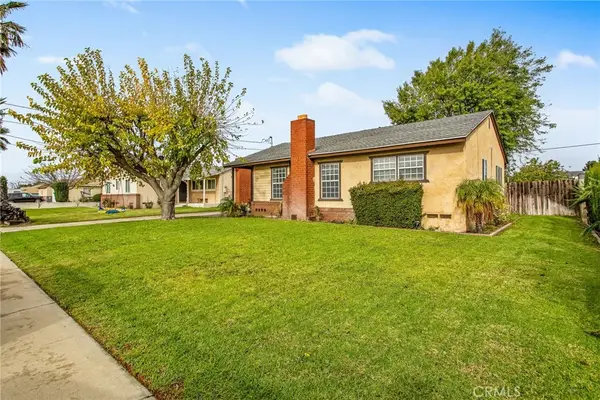 $599,900Pending4 beds 3 baths1,747 sq. ft.
17416 Malaga Street, Fontana, CA 92336
MLS# CV26003375Listed by: CENTURY 21 MASTERS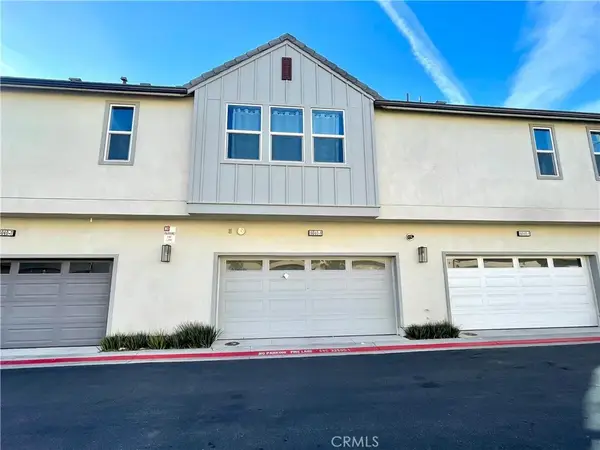 $505,000Active3 beds 2 baths1,477 sq. ft.
16040 Jamie Lane #8, Fontana, CA 92336
MLS# CV26002235Listed by: DONAJI & ASSOCIATES $505,000Active3 beds 2 baths1,477 sq. ft.
16040 Jamie Lane #8, Fontana, CA 92336
MLS# CV26002235Listed by: DONAJI & ASSOCIATES $715,000Active4 beds 3 baths2,257 sq. ft.
13856 Gazania, Fontana, CA 92336
MLS# WS26002822Listed by: REALTY MASTERS& ASSOC/CHINO $599,000Active3 beds 2 baths1,350 sq. ft.
15681 San Jacinto, Fontana, CA 92336
MLS# CV26002788Listed by: REALTY WORLD ALL STARS $838,000Active4 beds 4 baths3,340 sq. ft.
5808 Boca Raton, Fontana, CA 92336
MLS# WS26002513Listed by: GREEN FORCE, INC.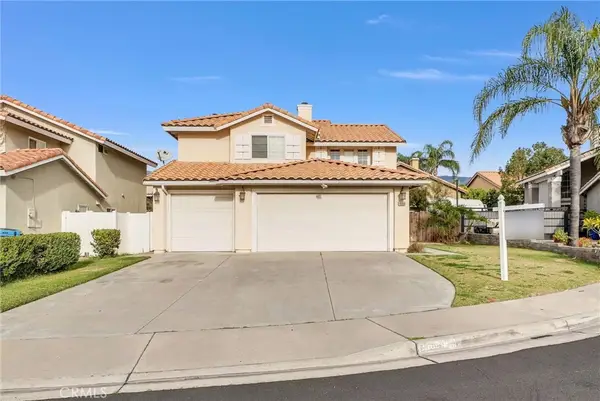 $679,900Active4 beds 3 baths1,788 sq. ft.
14086 Valley Forge Court, Fontana, CA 92336
MLS# CV26000269Listed by: PHUOC HUYNH, BROKER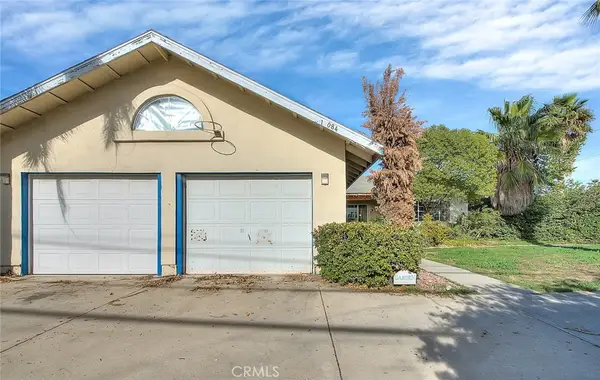 $500,000Pending2 beds 1 baths1,685 sq. ft.
17084 Miller, Fontana, CA 92336
MLS# IV26000987Listed by: SIERRA REALTY FONTANA INC- Open Sat, 1 to 4pm
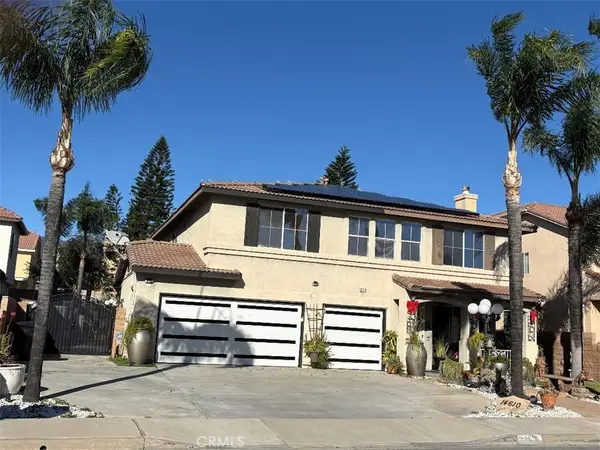 $869,999Active5 beds 3 baths2,829 sq. ft.
14610 Arizona Street, Fontana, CA 92336
MLS# PW25280565Listed by: COMMUNITY BROKERS  $819,000Active5 beds 3 baths2,720 sq. ft.
5242 Hayes Court, Fontana, CA 92336
MLS# DW26001982Listed by: VIDA REAL ESTATE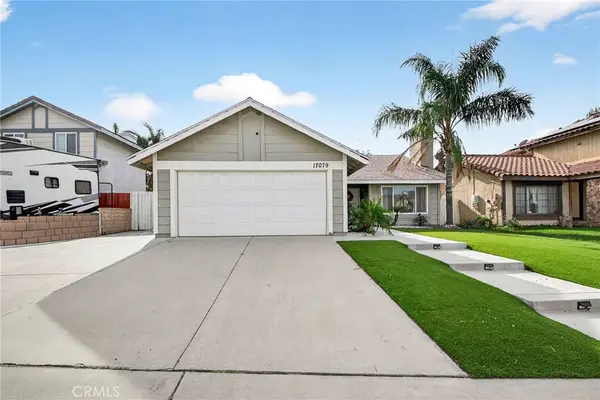 $624,900Active3 beds 2 baths1,235 sq. ft.
17079 Lurelane, Fontana, CA 92336
MLS# SB25282139Listed by: THE REALESTATE GROUP $769,800Active4 beds 3 baths2,414 sq. ft.
16414 Twinberry Court, Fontana, CA 92336
MLS# CV25282167Listed by: KELLER WILLIAMS REALTY COLLEGE PARK $741,583Active4 beds 3 baths1,914 sq. ft.
6367 Moonfire Lane, Fontana, CA 92336
MLS# SW26001256Listed by: D R HORTON AMERICA'S BUILDER- Open Sat, 11am to 2pm
 $855,000Active5 beds 3 baths2,720 sq. ft.
15575 Parry Peak, Fontana, CA 92336
MLS# CV26001127Listed by: ALIGN HOMES  $965,000Active4 beds 4 baths3,352 sq. ft.
16770 Tea Tree Lane, Fontana, CA 92336
MLS# CRPW26000527Listed by: REAL BROKER $660,000Active3 beds 3 baths1,895 sq. ft.
5664 Kate Way #2, Fontana, CA 92336
MLS# DW25277730Listed by: RE/MAX DYNASTY $735,000Active4 beds 3 baths2,448 sq. ft.
18215 Grove Place, Fontana, CA 92336
MLS# CRPW26000481Listed by: DG REALTY & SERVICES, INC. $668,890Active3 beds 2 baths1,550 sq. ft.
6934 Fremontia, Fontana, CA 92336
MLS# CV26000645Listed by: REALTY MASTERS & ASSOCIATES, IN $662,490Pending3 beds 3 baths1,650 sq. ft.
6354 Moonfire Lane, Fontana, CA 92336
MLS# SW25281738Listed by: D R HORTON AMERICA'S BUILDER $649,900Pending4 beds 2 baths1,628 sq. ft.
7550 Periwinkle Drive, Fontana, CA 92336
MLS# CV25280003Listed by: RE/MAX TIME REALTY $730,583Pending4 beds 3 baths1,914 sq. ft.
6362 Moonfire Lane, Fontana, CA 92336
MLS# SW25280241Listed by: D R HORTON AMERICA'S BUILDER $709,490Pending4 beds 3 baths1,805 sq. ft.
6366 Moonfire Lane, Fontana, CA 92336
MLS# SW25278981Listed by: D R HORTON AMERICA'S BUILDER $669,000Active3 beds 3 baths2,041 sq. ft.
6978 Alderwood Drive, Fontana, CA 92336
MLS# CRCV25275677Listed by: NEXT BROKERAGE $682,500Active4 beds 3 baths2,031 sq. ft.
16883 Hazeltine Court, Fontana, CA 92336
MLS# CV25276227Listed by: REALTY ONE GROUP MASTERS $758,999Active3 beds 3 baths2,009 sq. ft.
5236 Collard, Fontana, CA 92336
MLS# IV25276537Listed by: CALIFORNIA RANCHOS $773,000Active4 beds 3 baths2,288 sq. ft.
6341 Waterstone, Fontana, CA 92336
MLS# TR25277163Listed by: ONEDER REALTY $809,998Active5 beds 3 baths3,113 sq. ft.
15187 Hawk Street, Fontana, CA 92336
MLS# IV25276520Listed by: UNIVERSAL ELITE REALTY $549,000Active3 beds 2 baths1,477 sq. ft.
15992 Jaime Lane #8, Fontana, CA 92336
MLS# TR25276121Listed by: CENTURY 21 MASTERS $549,000Active3 beds 2 baths1,477 sq. ft.
15992 Jaime Lane #8, Fontana, CA 92336
MLS# TR25276121Listed by: CENTURY 21 MASTERS $948,000Active4 beds 4 baths3,194 sq. ft.
5327 La Bodega, Fontana, CA 92336
MLS# IV25275536Listed by: CENTURY 21 EXPERIENCE $529,990Pending3 beds 2 baths1,530 sq. ft.
16583 Bottlebrush Lane #1, Fontana, CA 92336
MLS# OC25275273Listed by: THE NEW HOME COMPANY $529,990Pending3 beds 2 baths1,530 sq. ft.
16583 Bottlebrush Lane #1, Fontana, CA 92336
MLS# OC25275273Listed by: THE NEW HOME COMPANY $750,000Active4 beds 3 baths2,000 sq. ft.
5029 La Sarre Drive, Fontana, CA 92336
MLS# IG25275077Listed by: EQUITY SMART HOME LOANS $514,900Active3 beds 3 baths1,953 sq. ft.
15723 Parkhouse, Fontana, CA 92336
MLS# CV25274758Listed by: RE/MAX CHAMPIONS $514,900Active3 beds 3 baths1,953 sq. ft.
15723 Parkhouse, Fontana, CA 92336
MLS# CV25274758Listed by: RE/MAX CHAMPIONS $527,131Pending3 beds 3 baths1,584 sq. ft.
15513 April Dawn Way #3, Fontana, CA 92336
MLS# SW25273585Listed by: D R HORTON AMERICA'S BUILDER $799,900Active5 beds 3 baths3,144 sq. ft.
14956 Genoa, Fontana, CA 92336
MLS# CV25272135Listed by: MAINSTREET REALTORS $699,000Active5 beds 3 baths2,676 sq. ft.
7441 Sultana, Fontana, CA 92336
MLS# PW25271463Listed by: CIRCLE REAL ESTATE $585,000Pending4 beds 2 baths1,267 sq. ft.
7558 Pinyon, Fontana, CA 92336
MLS# SW25270466Listed by: MARIN REALTY GROUP $549,998Active3 beds 3 baths1,829 sq. ft.
16681 Wyndham Lane #8, Fontana, CA 92336
MLS# CRCV25269006Listed by: HOMEQUEST REAL ESTATE $549,998Active3 beds 3 baths1,829 sq. ft.
16681 Wyndham Lane #8, Fontana, CA 92336
MLS# CV25269006Listed by: HOMEQUEST REAL ESTATE $800,000Active4 beds 3 baths2,070 sq. ft.
7234 Bodega, Fontana, CA 92336
MLS# CV25269218Listed by: KELLER WILLIAMS EMPIRE ESTATES $586,490Active4 beds 3 baths1,705 sq. ft.
15535 April Dawn Way #1, Fontana, CA 92336
MLS# SW25269209Listed by: D R HORTON AMERICA'S BUILDER $754,999Active4 beds 3 baths2,409 sq. ft.
15607 Allspice Lane, Fontana, CA 92336
MLS# CRTR25268329Listed by: PINNACLE REAL ESTATE GROUP $624,999Active4 beds 4 baths1,963 sq. ft.
15185 Ridge, Fontana, CA 92336
MLS# CV25267250Listed by: THE REAL BROKERAGE, INC. $885,000Active5 beds 3 baths2,875 sq. ft.
5252 Denali Court, Fontana, CA 92336
MLS# PW25263858Listed by: THE BOUTIQUE REAL ESTATE GROUP $650,000Active4 beds 3 baths1,661 sq. ft.
15959 Sparrow Court, Fontana, CA 92336
MLS# IV25267778Listed by: REALTY MASTERS & ASSOCIATES $650,000Active4 beds 3 baths1,661 sq. ft.
15959 Sparrow Court, Fontana, CA 92336
MLS# IV25267778Listed by: REALTY MASTERS & ASSOCIATES $624,999Active4 beds 4 baths1,963 sq. ft.
15185 Ridge, Fontana, CA 92336
MLS# CV25267250Listed by: THE REAL BROKERAGE, INC. $670,000Active3 beds 3 baths1,617 sq. ft.
14932 Dandelion Court, Fontana, CA 92336
MLS# OC25264942Listed by: PACIFIC STERLING REALTY $739,000Active4 beds 3 baths1,957 sq. ft.
6589 Grotto Lane #3, Fontana, CA 92336
MLS# IV25263048Listed by: TOWER AGENCY $1,059,990Active4 beds 4 baths2,747 sq. ft.
4794 Habitat Drive, Fontana, CA 92336
MLS# OC25252758Listed by: LANDSEA REAL ESTATE CALIFORNIA, INC. $1,349,000Active4 beds 4 baths3,827 sq. ft.
15957 Butterfly Drive, Fontana, CA 92336
MLS# CV25262367Listed by: CENTURY 21 MASTERS $679,900Active4 beds 3 baths1,649 sq. ft.
13584 Sutter Court, Fontana, CA 92336
MLS# DW25261342Listed by: RE/MAX DYNASTY $544,000Active3 beds 3 baths1,677 sq. ft.
7155 Citrus Avenue #381, Fontana, CA 92336
MLS# SB25252835Listed by: VISTA SOTHEBYS INTERNATIONAL REALTY $609,988Pending3 beds 3 baths1,642 sq. ft.
7252 Medley Lane, Fontana, CA 92336
MLS# AR25257386Listed by: IRN REALTY $525,000Pending3 beds 3 baths1,677 sq. ft.
7155 Citrus Avenue #426, Fontana, CA 92336
MLS# CV25257862Listed by: EXP REALTY OF CALIFORNIA INC $499,990Active3 beds 2 baths1,575 sq. ft.
5253 Wildflower Lane #1, Fontana, CA 92336
MLS# PW26019649Listed by: FIRST TEAM REAL ESTATE $699,999Active4 beds 3 baths2,043 sq. ft.
16064 Symphony Lane, Fontana, CA 92336
MLS# IV25258283Listed by: COLDWELL BANKER REALTY $874,999Active4 beds 3 baths2,698 sq. ft.
7925 Hemingway Court, Fontana, CA 92336
MLS# CRSR25256953Listed by: LUXURY COLLECTIVE $799,000Active5 beds 3 baths2,967 sq. ft.
5144 Godinez, Fontana, CA 92336
MLS# CRTR25257117Listed by: MLA INVESTMENTS $599,900Active3 beds 3 baths1,794 sq. ft.
16126 Cannoli Court #3, Fontana, CA 92336
MLS# MB25256132Listed by: TLC REALTY AND INVESTMENTS INC $599,900Active3 beds 3 baths1,794 sq. ft.
16126 Cannoli Court #3, Fontana, CA 92336
MLS# MB25256132Listed by: TLC REALTY AND INVESTMENTS INC $765,000Pending4 beds 3 baths1,776 sq. ft.
5630 Hunt Club, Fontana, CA 92336
MLS# CV25255809Listed by: DYNASTY REAL ESTATE $639,900Active3 beds 2 baths1,351 sq. ft.
7887 Kempster Ave, Fontana, CA 92336
MLS# OC25253730Listed by: COLDWELL BANKER LEADERS $519,900Active3 beds 2 baths1,477 sq. ft.
16040 Parkhouse Drive #1, Fontana, CA 92336
MLS# CV25254965Listed by: RE/MAX DYNASTY $1,289,987Active-- beds -- baths3 sq. ft.
16252 Baseline, Fontana, CA 92336
MLS# IG25253980Listed by: CENTURY 21 SYNERGIA REALTY $733,515Pending4 beds 3 baths1,914 sq. ft.
16051 Montenegro Lane, Fontana, CA 92336
MLS# SW25252237Listed by: D R HORTON AMERICA'S BUILDER $676,990Pending3 beds 3 baths1,650 sq. ft.
16054 Montenegro Lane, Fontana, CA 92336
MLS# SW25252223Listed by: D R HORTON AMERICA'S BUILDER $622,792Active3 beds 3 baths1,750 sq. ft.
16583 Botanical Lane, Fontana, CA 92336
MLS# IG25251193Listed by: RICHMOND AMERICAN HOMES $747,000Active4 beds 3 baths2,311 sq. ft.
15820 Caterpillar Drive, Fontana, CA 92336
MLS# CV26000045Listed by: REALTY WORLD ALL STARS $622,792Active3 beds 3 baths1,750 sq. ft.
16583 Botanical Lane, Fontana, CA 92336
MLS# IG25251193Listed by: RICHMOND AMERICAN HOMES $685,000Active3 beds 3 baths1,933 sq. ft.
6577 Canopy Lane, Fontana, CA 92336
MLS# CRAR25250606Listed by: WETRUST REALTY $729,656Pending4 beds 3 baths1,914 sq. ft.
16052 Montenegro Lane, Fontana, CA 92336
MLS# SW25250485Listed by: D R HORTON AMERICA'S BUILDER $692,952Pending4 beds 3 baths1,805 sq. ft.
16056 Montenegro Lane, Fontana, CA 92336
MLS# SW25250436Listed by: D R HORTON AMERICA'S BUILDER $562,989Pending4 beds 3 baths2,025 sq. ft.
15188 Horizon Street #8, Fontana, CA 92336
MLS# CV25249245Listed by: GREENVIEW REALTY $562,989Pending4 beds 3 baths2,025 sq. ft.
15188 Horizon Street #8, Fontana, CA 92336
MLS# CV25249245Listed by: GREENVIEW REALTY $648,000Active3 beds 3 baths2,051 sq. ft.
7155 Citrus #227, Fontana, CA 92336
MLS# CV25248904Listed by: AMERIWAY REALTY $505,000Active4 beds 3 baths2,047 sq. ft.
15723 Parkhouse Drive #97, Fontana, CA 92336
MLS# CV25243776Listed by: COLDWELL BANKER BLACKSTONE RTY $505,000Active4 beds 3 baths2,047 sq. ft.
15723 Parkhouse Drive #97, Fontana, CA 92336
MLS# CV25243776Listed by: COLDWELL BANKER BLACKSTONE RTY $566,005Pending3 beds 3 baths1,584 sq. ft.
6393 Sierra Vista Lane #4, Fontana, CA 92336
MLS# SW25246540Listed by: D R HORTON AMERICA'S BUILDER $560,000Active3 beds 3 baths1,677 sq. ft.
7155 Citrus Avenue #405, Fontana, CA 92336
MLS# CRPW25244795Listed by: BK PLATINUM PROPERTIES $749,000Active3 beds 3 baths1,996 sq. ft.
7397 Mcclellan, Fontana, CA 92336
MLS# CV25243419Listed by: CALIFORNIA FIRST REALTY $749,000Active3 beds 3 baths1,996 sq. ft.
7397 Mcclellan, Fontana, CA 92336
MLS# CV25243419Listed by: CALIFORNIA FIRST REALTY $630,000Active3 beds 3 baths1,794 sq. ft.
16126 Cannoli Court #2, Fontana, CA 92336
MLS# IV25240574Listed by: EXP REALTY OF CALIFORNIA INC $630,000Active3 beds 3 baths1,794 sq. ft.
16126 Cannoli Court #2, Fontana, CA 92336
MLS# IV25240574Listed by: EXP REALTY OF CALIFORNIA INC $899,000Active5 beds 4 baths3,194 sq. ft.
5367 Heitz Way, Fontana, CA 92336
MLS# SB25235750Listed by: REALTY ONE GROUP UNITED $720,000Pending3 beds 3 baths1,629 sq. ft.
14998 Mustang Lane, Fontana, CA 92336
MLS# CV25236254Listed by: HAUS OF REAL ESTATE $759,975Active4 beds 3 baths2,409 sq. ft.
15457 Red Pepper Place, Fontana, CA 92336
MLS# CRCV25233719Listed by: SMART SELL REAL ESTATE $860,000Active4 beds 3 baths2,992 sq. ft.
16448 Los Coyotes Street, Fontana, CA 92336
MLS# TR25229342-1Listed by: IRN REALTY $545,000Active3 beds 3 baths1,965 sq. ft.
15723 Parkhouse #6, Fontana, CA 92336
MLS# CV25232500Listed by: VESTA FINANCIAL CAPITAL $545,000Active3 beds 3 baths1,965 sq. ft.
15723 Parkhouse #6, Fontana, CA 92336
MLS# CV25232500Listed by: VESTA FINANCIAL CAPITAL $550,000Active3 beds 1 baths999 sq. ft.
17279 Miller Avenue, Fontana, CA 92336
MLS# SW25231179Listed by: GOLDEN FEATHER INVESTMENTS INC $649,990Active3 beds 3 baths1,760 sq. ft.
16540 Stone Pine Lane, Fontana, CA 92336
MLS# OC25230308Listed by: TNHC REALTY AND CONSTRUCTION- New
 $745,000Active4 beds 3 baths1,624 sq. ft.
7620 Catawba Court, Fontana, CA 92336
MLS# CV26038968Listed by: COLDWELL BANKER LEADERS  $690,990Pending4 beds 3 baths1,870 sq. ft.
16560 Stone Pine Lane, Fontana, CA 92336
MLS# OC25230287Listed by: TNHC REALTY AND CONSTRUCTION $649,990Active3 beds 3 baths1,760 sq. ft.
16540 Stone Pine Lane, Fontana, CA 92336
MLS# OC25230308Listed by: TNHC REALTY AND CONSTRUCTION $519,000Active3 beds 3 baths1,432 sq. ft.
7155 Citrus #433, Fontana, CA 92336
MLS# IG25226260Listed by: EXP REALTY OF CALIFORNIA INC. $849,000Active5 beds 3 baths2,942 sq. ft.
5433 Grand Prix Court, Fontana, CA 92336
MLS# WS26014059Listed by: RE/MAX 2000 REALTY $519,000Active3 beds 3 baths1,432 sq. ft.
7155 Citrus #433, Fontana, CA 92336
MLS# IG25226260Listed by: EXP REALTY OF CALIFORNIA INC. $639,999Active3 beds 3 baths1,963 sq. ft.
15237 Horizon #4, Fontana, CA 92336
MLS# DW25225596Listed by: CALIFORNIA REALTY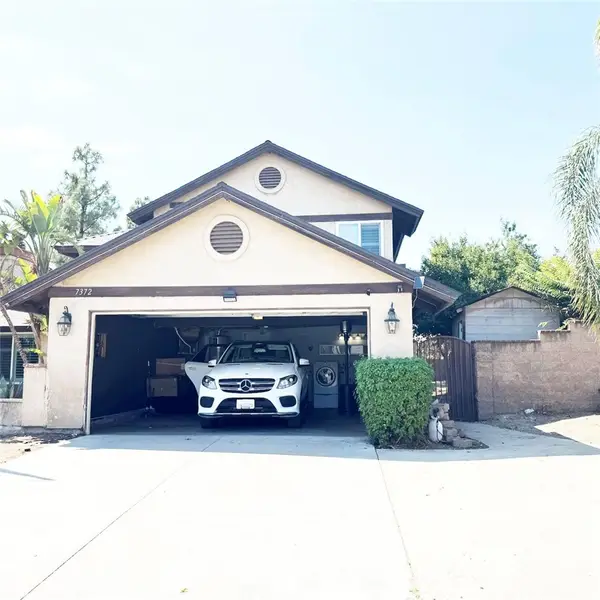 $649,000Active4 beds 3 baths1,766 sq. ft.
7372 Oleander, Fontana, CA 92336
MLS# CRTR25225251Listed by: REAL BROKER $924,900Active4 beds 3 baths2,305 sq. ft.
5206 Archery Court, Fontana, CA 92336
MLS# CRSR25218167Listed by: HOFFMAN THEUS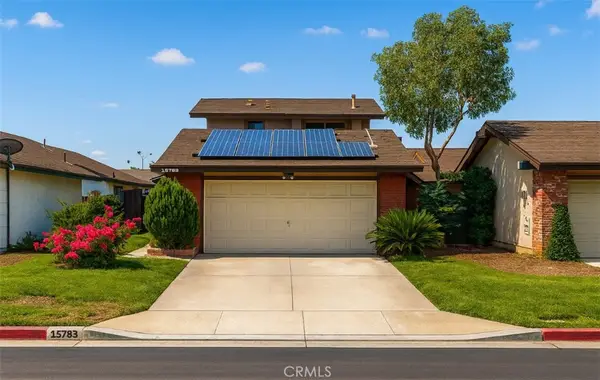 $545,000Active3 beds 3 baths1,338 sq. ft.
15783 Barbee Street #10, Fontana, CA 92336
MLS# IV25190886Listed by: CASTLE REALTORS, PC $788,000Active0.87 Acres
15707 Highland Ave, Fontana, CA 92336
MLS# CV25202741Listed by: UPCITY GROUP $569,999Active4 beds 4 baths1,953 sq. ft.
15723 Parkhouse Drive #105, Fontana, CA 92336
MLS# CV25192086Listed by: EXP REALTY OF GREATER LOS ANGELES $569,999Active4 beds 4 baths1,953 sq. ft.
15723 Parkhouse Drive #105, Fontana, CA 92336
MLS# CV25192086Listed by: EXP REALTY OF GREATER LOS ANGELES $325,000Active0.41 Acres
17562 Court Street, Fontana, CA 92336
MLS# PW25196858Listed by: RE/MAX COLLEGE PARK REALTY $819,900Active5 beds 3 baths2,541 sq. ft.
8043 Tuscany Street, Fontana, CA 92336
MLS# OC25190637Listed by: PACIFIC STERLING REALTY $1,110,000Active5 beds 6 baths4,313 sq. ft.
5003 Thornberry Way, Fontana, CA 92336
MLS# IG25192689Listed by: CARLOS DIAZ $554,900Active4 beds 3 baths1,611 sq. ft.
16040 Jamie Lane #9, Fontana, CA 92336
MLS# IV25186888Listed by: 1-2-3 HOMEKEYS $749,000Pending4 beds 3 baths2,364 sq. ft.
16681 Escalon Drive, Fontana, CA 92336
MLS# CV26005361Listed by: NEW STAR REALTY & INVESTMENT $160,000Active0.24 Acres
0 Juniper, Fontana, CA 92336
MLS# IV25188372Listed by: AMERICAN INVESTORS REALTY $554,900Active4 beds 3 baths1,611 sq. ft.
16040 Jamie Lane #9, Fontana, CA 92336
MLS# IV25186888Listed by: 1-2-3 HOMEKEYS $850,000Active5 beds 4 baths2,748 sq. ft.
7044 Mallow Drive Mall #4, Fontana, CA 92336
MLS# CV25181749Listed by: ALTA REALTY GROUP CA, INC. $850,000Active5 beds 4 baths2,748 sq. ft.
7044 Mallow Drive Mall #4, Fontana, CA 92336
MLS# CV25181749Listed by: ALTA REALTY GROUP CA, INC. $1,350,000Pending8 beds 6 baths
18281 N Montgomery Avenue, Fontana, CA 92336
MLS# IV25174396Listed by: EMAAR ENTERPRISE $564,005Pending3 beds 3 baths1,584 sq. ft.
6393 Sierra Vista Lane #3, Fontana, CA 92336
MLS# CRSW25175558Listed by: D R HORTON AMERICA'S BUILDER $540,000Active3 beds 3 baths1,953 sq. ft.
15723 Parkhouse #30, Fontana, CA 92336
MLS# TR26013215Listed by: REAL BROKER $545,000Active3 beds 3 baths1,808 sq. ft.
15723 Parkhouse Drive #40, Fontana, CA 92336
MLS# CV25150327Listed by: BALSWICK REALTY $379,900Pending2 beds 2 baths875 sq. ft.
13674 Balboa Court, Fontana, CA 92336
MLS# IG19211610Listed by: RE/MAX TOP PRODUCERS $350,000Pending4 beds 2 baths1,628 sq. ft.
7550 Periwinkle Drive, Fontana, CA 92336
MLS# IV19230105Listed by: REALTY MASTERS & ASSOC. INC $381,000Pending3 beds 3 baths1,716 sq. ft.
14975 S Highland Avenue #69, Fontana, CA 92336
MLS# IV20002193Listed by: BERKSHIRE HATHAWAY HS CA $949,999Active5 beds 3 baths4,121 sq. ft.
5381 Campania Way, Fontana, CA 92336
MLS# IV25162681Listed by: CALIFORNIA KEY HOMES $545,000Active3 beds 3 baths1,808 sq. ft.
15723 Parkhouse Drive #40, Fontana, CA 92336
MLS# CV25150327Listed by: BALSWICK REALTY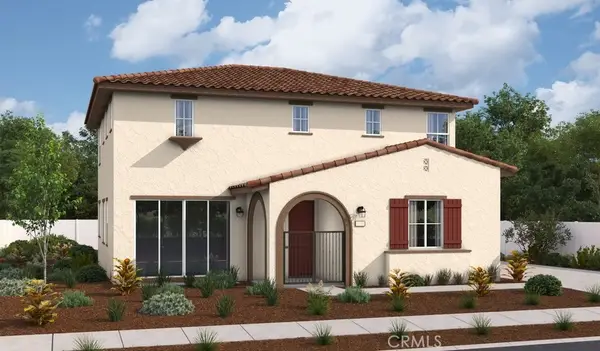 $681,077Active3 beds 3 baths1,850 sq. ft.
16543 Shallot Street, Fontana, CA 92336
MLS# IG25121673Listed by: RICHMOND AMERICAN HOMES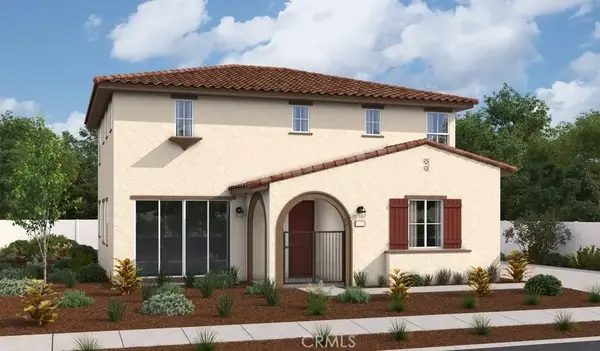 $681,077Active3 beds 3 baths1,850 sq. ft.
16543 Shallot Street, Fontana, CA 92336
MLS# IG25121673Listed by: RICHMOND AMERICAN HOMES $711,806Active4 beds 4 baths2,074 sq. ft.
5164 Currant Way, Fontana, CA 92336
MLS# IG25113192Listed by: RICHMOND AMERICAN HOMES $711,806Active4 beds 4 baths2,074 sq. ft.
5164 Currant Way, Fontana, CA 92336
MLS# IG25113192Listed by: RICHMOND AMERICAN HOMES $599,000Active3 beds 3 baths1,661 sq. ft.
16020 Sunny Court, Fontana, CA 92336
MLS# CV25103921Listed by: COLDWELL BANKER LEADERS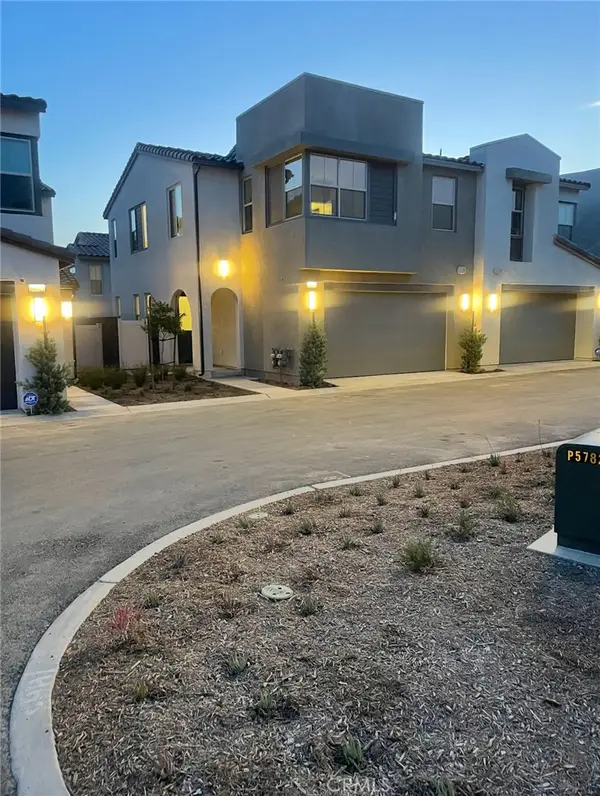 $599,000Active3 beds 3 baths1,661 sq. ft.
16020 Sunny Court, Fontana, CA 92336
MLS# CV25103921Listed by: COLDWELL BANKER LEADERS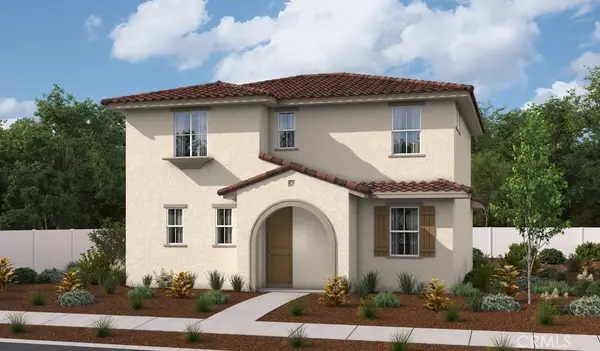 $654,990Active4 beds 3 baths1,950 sq. ft.
16485 Botanical Lane, Fontana, CA 92336
MLS# IG25064907Listed by: RICHMOND AMERICAN HOMES $654,990Active4 beds 3 baths1,950 sq. ft.
16485 Botanical Lane, Fontana, CA 92336
MLS# IG25064907Listed by: RICHMOND AMERICAN HOMES $655,122Active4 beds 3 baths1,950 sq. ft.
16475 Botanical Lane, Fontana, CA 92336
MLS# IG25064915Listed by: RICHMOND AMERICAN HOMES $655,122Active4 beds 3 baths1,950 sq. ft.
16475 Botanical Lane, Fontana, CA 92336
MLS# IG25064915Listed by: RICHMOND AMERICAN HOMES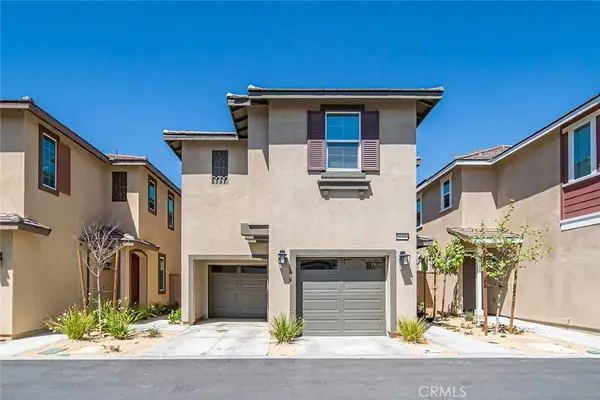 $600,000Active3 beds 3 baths1,767 sq. ft.
16584 Poppy Seed Lane, Fontana, CA 92336
MLS# TR25079927Listed by: PARK GROUP REAL ESTATE $600,000Active3 beds 3 baths1,767 sq. ft.
16584 Poppy Seed Lane, Fontana, CA 92336
MLS# TR25079927Listed by: PARK GROUP REAL ESTATE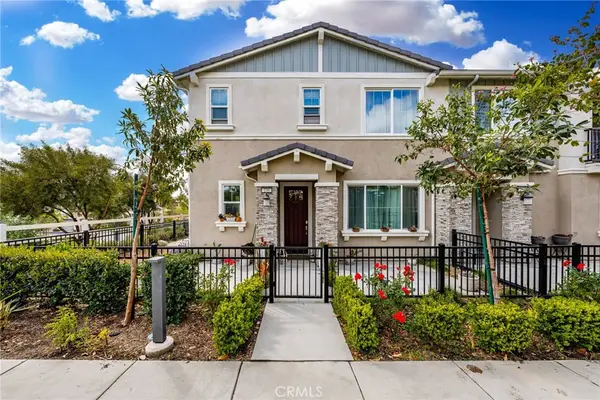 $510,000Pending3 beds 3 baths1,829 sq. ft.
16502 Casa Grande Avenue #235, Fontana, CA 92336
MLS# CV25060140Listed by: KELLER WILLIAMS EMPIRE ESTATES $760,000Active3 beds 2 baths2,253 sq. ft.
14987 Pepperdine, Fontana, CA 92336
MLS# IV26000330Listed by: COLDWELL BANKER TOWN & COUNTRY $510,000Pending3 beds 3 baths1,829 sq. ft.
16502 Casa Grande Avenue #235, Fontana, CA 92336
MLS# CV25060140Listed by: KELLER WILLIAMS EMPIRE ESTATES $745,500Active4 beds 4 baths2,122 sq. ft.
5150 Currant Way, Fontana, CA 92336
MLS# IG25071718Listed by: RICHMOND AMERICAN HOMES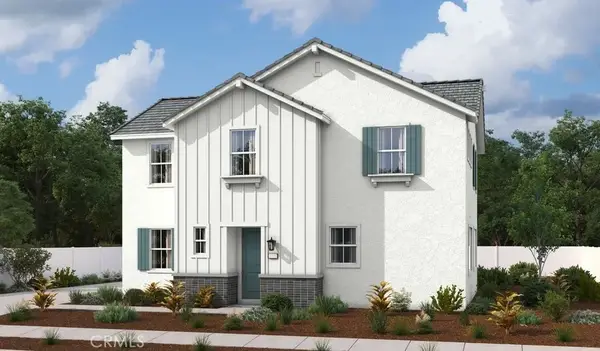 $745,500Active4 beds 4 baths2,122 sq. ft.
5150 Currant Way, Fontana, CA 92336
MLS# IG25071718Listed by: RICHMOND AMERICAN HOMES
Local realty services provided by:CENTURY 21 Valley Properties, CENTURY 21 Wildwood Properties, Inc., CENTURY 21 Affiliated
The information being provided by California Regional MLS (Southern California) is for the consumer's personal, non-commercial use and may not be used for any purpose other than to identify prospective properties consumer may be interested in purchasing. Any information relating to real estate for sale referenced on this web site comes from the Internet Data Exchange (IDX) program of the California Regional MLS (Southern California). CENTURY 21 Valley Properties is not a Multiple Listing Service (MLS), nor does it offer MLS access. This website is a service of CENTURY 21 Valley Properties, a broker participant of California Regional MLS (Southern California). This web site may reference real estate listing(s) held by a brokerage firm other than the broker and/or agent who owns this web site.
The accuracy of all information, regardless of source, including but not limited to open house information, square footages and lot sizes, is deemed reliable but not guaranteed and should be personally verified through personal inspection by and/or with the appropriate professionals. The data contained herein is copyrighted by California Regional MLS (Southern California) and is protected by all applicable copyright laws. Any unauthorized dissemination of this information is in violation of copyright laws and is strictly prohibited.
Copyright 2021 California Regional MLS (Southern California). All rights reserved.
This information is deemed reliable but not guaranteed. You should rely on this information only to decide whether or not to further investigate a particular property. BEFORE MAKING ANY OTHER DECISION, YOU SHOULD PERSONALLY INVESTIGATE THE FACTS (e.g. square footage and lot size) with the assistance of an appropriate professional. You may use this information only to identify properties you may be interested in investigating further. All uses except for personal, non-commercial use in accordance with the foregoing purpose are prohibited. Redistribution or copying of this information, any photographs or video tours is strictly prohibited. This information is derived from the Internet Data Exchange (IDX) service provided by San Diego MLS®. Displayed property listings may be held by a brokerage firm other than the broker and/or agent responsible for this display. The information and any photographs and video tours and the compilation from which they are derived is protected by copyright. Compilation © 2020 San Diego MLS®, Inc.
Popular searches near 92336
Popular neighborhoods near 92336
- California Landings, Fontana properties for sale
- Caryn, Rancho Cucamonga properties for sale
- Citrus Heights North, Fontana properties for sale
- Coyote Canyon, Fontana properties for sale
- Etiwanda, Rancho Cucamonga properties for sale
- Foothill Boulevard East, Rialto properties for sale
- Hunter's Ridge, Fontana properties for sale
- North Etiwanda, Rancho Cucamonga properties for sale
- Northwest Rialto, Rialto properties for sale
- Rancho Fontana, Fontana properties for sale
- Renaissance, Rialto properties for sale
- Rosena Ranch, San Bernardino properties for sale
- Shady Trails, Fontana properties for sale
- Sierra Lakes, Fontana properties for sale
- Summit Heights, Fontana properties for sale
- The Arboretum, Fontana properties for sale
- Victoria, Rancho Cucamonga properties for sale
- Walnut Village, Fontana properties for sale
- West End, Fontana properties for sale
- Westgate, Fontana properties for sale
Protect your home and budget from life's surprises with an Assurant Home Warranty, backed by a partner that supports you through every step of homeownership. Explore Plans.
©2026 Century 21 Real Estate LLC. All rights reserved. CENTURY 21®, the CENTURY 21 Logo and C21® are service marks owned by Century 21 Real Estate LLC. Century 21 Real Estate LLC fully supports the principles of the Fair Housing Act and the Equal Opportunity Act. Each office is independently owned and operated. Listing information is deemed reliable but not guaranteed accurate.