- Avocado Heights, La Puente homes for sale
- Blackstone, Brea homes for sale
- California Village, Pasadena homes for sale
- Casa Grande, Pasadena homes for sale
- Chapman, Pasadena homes for sale
- Chino, Chino homes for sale
- Harvest at Upland, Upland homes for sale
- Hastings Ranch, Pasadena homes for sale
- Lamanda Park, Pasadena homes for sale
- North Whittier, Whittier homes for sale
- Norumbega, Monrovia homes for sale
- Rancho Santa Ana del Chino, Ontario homes for sale
- Red Hills Rancho Homes, Rancho Cucamonga homes for sale
- San Antonio Heights, Upland homes for sale
- The San Gabriel Valley, La Puente homes for sale
- Tonner Hills, Brea homes for sale
- Upland Hills, Upland homes for sale
- Victory Park, Pasadena homes for sale
- Village Oaks, Chino Hills homes for sale
- Windmill Creek, Chino Hills homes for sale
Glendora, CA - homes for sale
109 of 109 results displayed
- New
 $1,276,580Active3 beds 3 baths2,280 sq. ft.
475 Citrus Oak Road, Glendora, CA 91740
MLS# CRIG26062888Listed by: TAYLOR MORRISON SERVICES - New
 $878,800Active3 beds 2 baths1,672 sq. ft.
356 Trayer Avenue, Glendora, CA 91741
MLS# CV26066735Listed by: SOUTHLAND PROPERTIES - New
 $1,436,110Active4 beds 3 baths2,631 sq. ft.
481 Citrus Oak Road, Glendora, CA 91740
MLS# IG26065355Listed by: TAYLOR MORRISON SERVICES - New
 $1,148,000Active4 beds 3 baths2,192 sq. ft.
120 E Renwick Road, Glendora, CA 91740
MLS# CV26063335Listed by: CENTURY 21 MASTERS - New
 $1,149,000Active3 beds 3 baths1,638 sq. ft.
543 N Glenwood Avenue, Glendora, CA 91741
MLS# CRIV26064496Listed by: REALTY MASTERS & ASSOCIATES - New
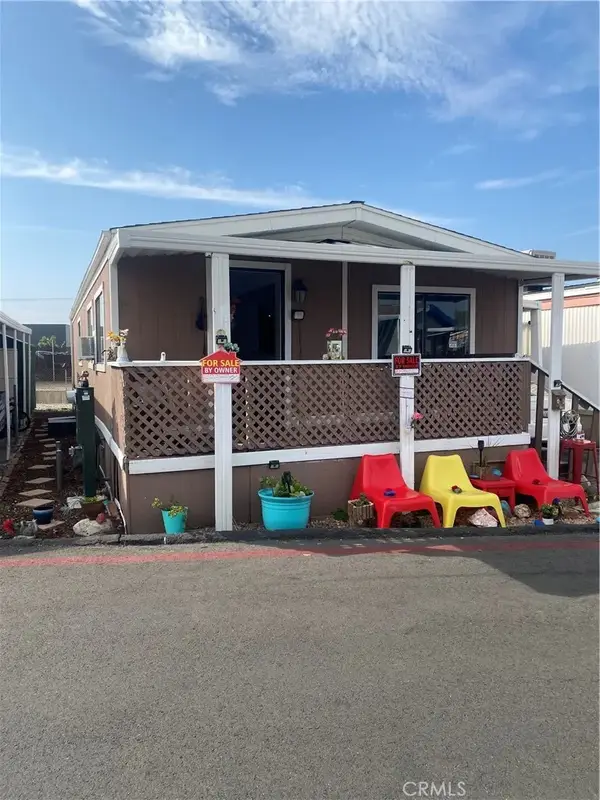 $109,000Active3 beds 2 baths
1700 Glendora #40, Glendora, CA 91740
MLS# CV26064872Listed by: STIGLER MORTGAGE - Open Mon, 10:30am to 4pmNew
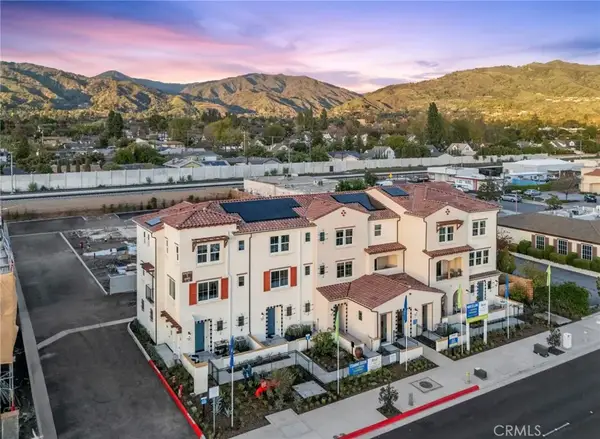 $493,990Active1 beds 1 baths743 sq. ft.
725 E. Route 66, Glendora, CA 91740
MLS# OC26057512Listed by: SEABRIGHT MANAGEMENT - New
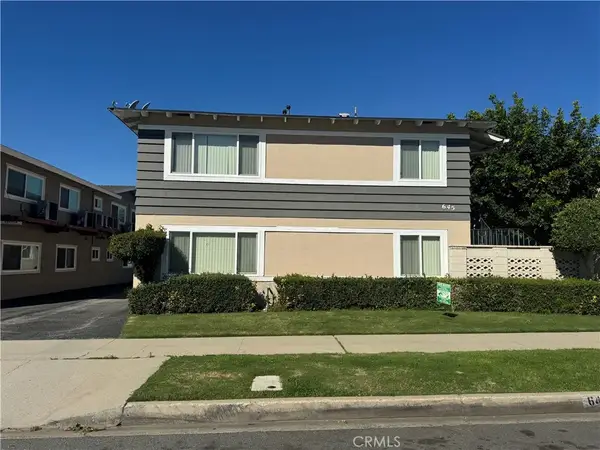 $1,800,000Active5 beds 4 baths
645 Scott, Glendora, CA 91740
MLS# AR26062857Listed by: RE/MAX PREMIER PROP ARCADIA - New
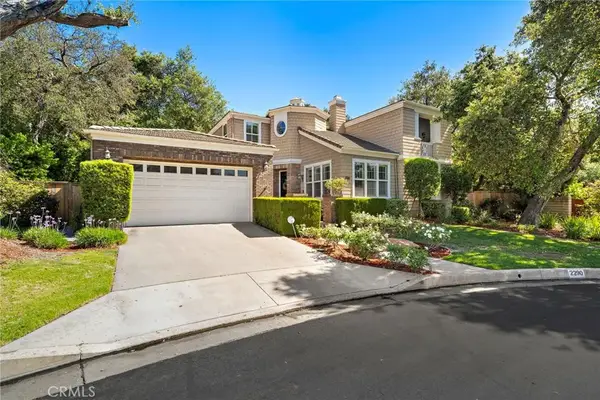 $1,788,000Active4 beds 5 baths3,278 sq. ft.
2290 Redwood Drive, Glendora, CA 91741
MLS# OC26062281Listed by: FIRST TEAM REAL ESTATE - New
 $829,999Active3 beds 2 baths1,238 sq. ft.
839 Alford Street, Glendora, CA 91740
MLS# CRGD26062856Listed by: THE ART IN REAL ESTATE - New
 $612,000Active2 beds 3 baths1,240 sq. ft.
422 W Route 66 #29, Glendora, CA 91740
MLS# CV26062689Listed by: KALEO REAL ESTATE COMPANY - New
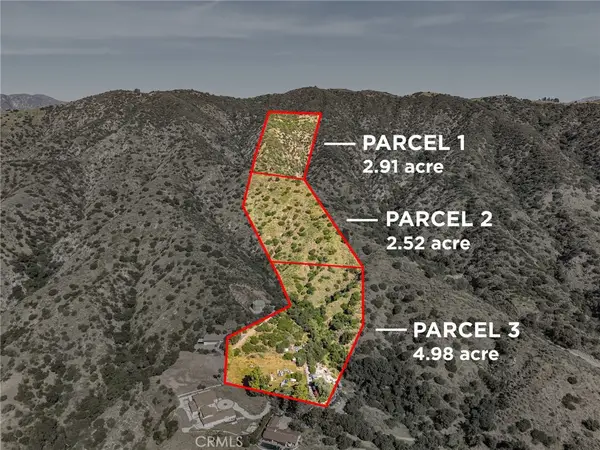 $2,000,000Active10.41 Acres
1154 N Glendora, Glendora, CA 91741
MLS# DW26057383Listed by: CENTURY 21 ALLSTARS  $1,095,000Pending4 beds 2 baths1,698 sq. ft.
1048 E Comstock Avenue, Glendora, CA 91741
MLS# CV26058906Listed by: RE/MAX MASTERS REALTY- New
 $950,000Active4 beds 2 baths1,319 sq. ft.
2030 E Linfield, Glendora, CA 91740
MLS# CV26058945Listed by: OPTION ONE REALTY - New
 $2,489,000Active4 beds 6 baths5,400 sq. ft.
451 N Baldy Vista, Glendora, CA 91741
MLS# SW26037346Listed by: COLDWELL BANKER ASSOC.BRKS-CL - New
 $925,000Active3 beds 2 baths1,227 sq. ft.
617 N Vista Bonita Avenue, Glendora, CA 91741
MLS# CV26060630Listed by: KW THE FOOTHILLS  $925,000Active3 beds 2 baths1,298 sq. ft.
409 Sycamore, Glendora, CA 91741
MLS# CV26059377Listed by: PORTER REAL ESTATE $949,999Active4 beds 2 baths1,572 sq. ft.
1123 Claraday, Glendora, CA 91740
MLS# CV26058775Listed by: VISMAR REAL ESTATE $1,849,000Active4 beds 3 baths2,988 sq. ft.
2269 Shady Oaks, Glendora, CA 91741
MLS# OC26056823Listed by: RE/MAX CONNECTIONS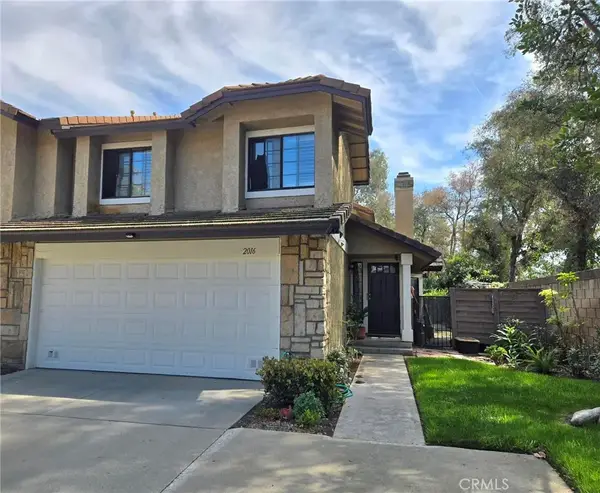 $749,000Active3 beds 3 baths1,697 sq. ft.
2016 Driftstone, Glendora, CA 91740
MLS# TR26055258Listed by: IRN REALTY $1,325,000Active7 beds 5 baths3,037 sq. ft.
315 E Juanita, Glendora, CA 91740
MLS# CROC26055780Listed by: REAL BROKER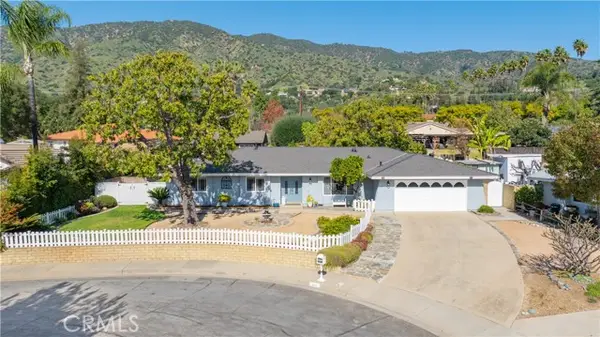 $1,185,000Active3 beds 2 baths1,969 sq. ft.
335 W Northridge, Glendora, CA 91741
MLS# CRCV26055177Listed by: GMA REAL ESTATE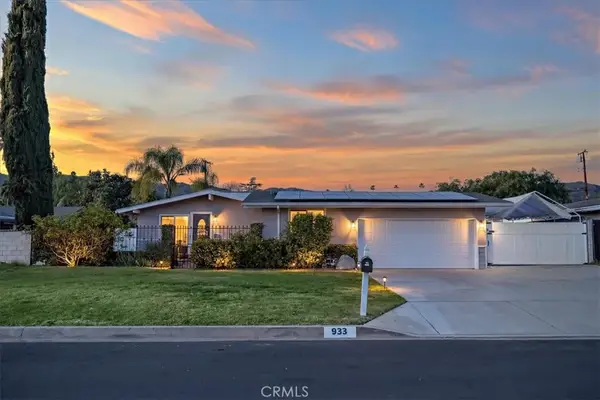 $998,000Active4 beds 2 baths1,518 sq. ft.
933 E Woodland, Glendora, CA 91741
MLS# CV26043854Listed by: HILL TOP REAL ESTATE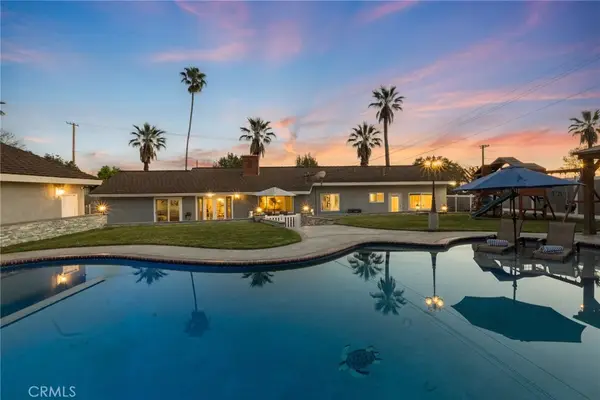 $1,589,990Active4 beds 2 baths1,759 sq. ft.
735 E Sierra Madre, Glendora, CA 91741
MLS# PW26023707Listed by: MOMENTUM REALTY GROUP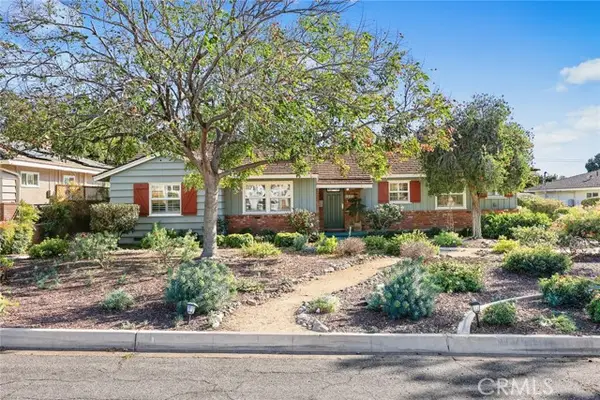 $980,000Active3 beds 2 baths1,437 sq. ft.
884 E Whitcomb Avenue, Glendora, CA 91741
MLS# CRCV26054431Listed by: SEVEN GABLES REAL ESTATE $998,000Active3 beds 2 baths1,840 sq. ft.
137 N Burnaby Avenue, Glendora, CA 91741
MLS# CL26663545Listed by: BC MOYER $680,000Active2 beds 3 baths1,499 sq. ft.
2411 E Greenview Drive, Glendora, CA 91741
MLS# CV26053119Listed by: EHOMES $245,000Active0 Acres
831 Hunters, Glendora, CA 91740
MLS# CV26052971Listed by: FELIX REAL ESTATE- Open Mon, 1 to 5pm
 $713,990Active3 beds 4 baths1,650 sq. ft.
424 Lemonade Place, Covina, CA 91723
MLS# OC26051634Listed by: TRUMARK CONSTRUCTION SERVICES INC  $1,295,000Active3 beds 2 baths1,750 sq. ft.
608 Thornhurst Avenue, Glendora, CA 91741
MLS# CV26046611Listed by: RE/MAX MASTERS REALTY $948,000Pending3 beds 2 baths1,787 sq. ft.
725 W Orangepath, Glendora, CA 91741
MLS# CV26049146Listed by: RE/MAX MASTERS REALTY $1,580,000Active5 beds 3 baths2,861 sq. ft.
1030 Fountain Springs, Glendora, CA 91741
MLS# CRCV26044087Listed by: HOMESMART, EVERGREEN REALTY $2,198,000Active5 beds 5 baths4,475 sq. ft.
388 Conifer Road, Glendora, CA 91741
MLS# CV26041607Listed by: COMPASS $849,900Active4 beds 2 baths1,252 sq. ft.
1126 E Ada, Glendora, CA 91741
MLS# CV26047274Listed by: RE/MAX INNOVATIONS $1,345,000Active3 beds 3 baths2,202 sq. ft.
1025 W Sierra Madre, Glendora, CA 91741
MLS# AR26046549Listed by: EXP REALTY OF CALIFORNIA INC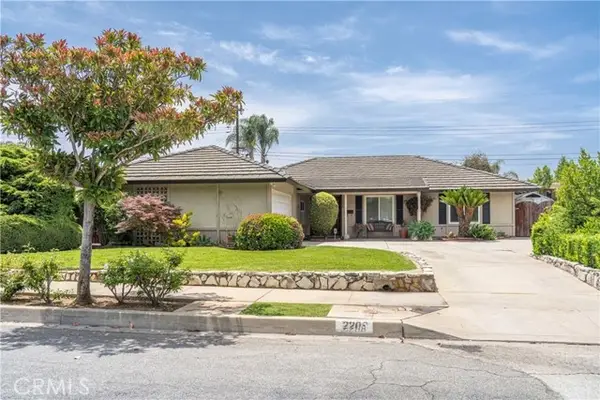 $918,000Active4 beds 2 baths1,430 sq. ft.
2208 E Linfield, Glendora, CA 91740
MLS# CRWS26046779Listed by: IRN REALTY $2,300,000Active2.14 Acres
685 Gordon Highlands Road, Glendora, CA 91741
MLS# CRCV26033261Listed by: JOHNHART CORP $1,595,000Pending5 beds 8 baths5,791 sq. ft.
732 W Bagnall, Glendora, CA 91740
MLS# CRCV26045749Listed by: CB RICHARD ELLIS $1,445,000Active4 beds 3 baths2,657 sq. ft.
1268 Indian Springs, Glendora, CA 91741
MLS# CRCV26036036Listed by: THE REAL ESTATE RESOURCE GROUP $1,650,000Active4 beds 3 baths2,529 sq. ft.
1215 Hidden Springs, Glendora, CA 91741
MLS# CRCV26042576Listed by: HILL TOP REAL ESTATE $1,350,000Active4 beds 3 baths2,777 sq. ft.
1023 Fountain Springs Lane, Glendora, CA 91741
MLS# CRV1-34891Listed by: REAL BROKERAGE TECHNOLOGIES, INC $1,595,000Active4 beds 3 baths2,652 sq. ft.
605 Live Oak Avenue, Glendora, CA 91741
MLS# CV26039934Listed by: RE/MAX INNOVATIONS $1,700,000Active4 beds 4 baths2,854 sq. ft.
1010 Juniper, Glendora, CA 91741
MLS# CRCV26033146Listed by: SYNERGY ONE REAL ESTATE $769,980Active3 beds 4 baths1,760 sq. ft.
649 W Foothill Boulevard #2, Glendora, CA 91741
MLS# PW26040731Listed by: REDFIN CORPORATION $1,325,000Active2.48 Acres
1037 Becklee Road, Glendora, CA 91741
MLS# CL26655363Listed by: LPT REALTY, INC $325,000Active2 beds 2 baths1,280 sq. ft.
208 S Barranca #13, Glendora, CA 91741
MLS# HD26040016Listed by: REAL BROKERAGE TECHNOLOGIES $1,375,000Active5 beds 5 baths2,700 sq. ft.
304 S Minnesota, Glendora, CA 91741
MLS# CRCV26037832Listed by: CAPITAL & INFLUENCE $1,120,000Active3 beds 2 baths2,146 sq. ft.
1241 E Mountain View Avenue, Glendora, CA 91741
MLS# CRCV26035853Listed by: JOHNHART CORP $724,900Active3 beds 2 baths1,495 sq. ft.
907 Shady Lane, Glendora, CA 91740
MLS# CV26035247Listed by: RE/MAX MASTERS REALTY $1,299,000Active3 beds 3 baths2,210 sq. ft.
1011 E Palm, Glendora, CA 91741
MLS# TR26029224Listed by: SIGNATURE R.E. AND FINANCIAL $899,000Pending3 beds 2 baths1,646 sq. ft.
905 E Juanita, Glendora, CA 91740
MLS# CV26027476Listed by: EXECUTIVE CAPITAL GROUP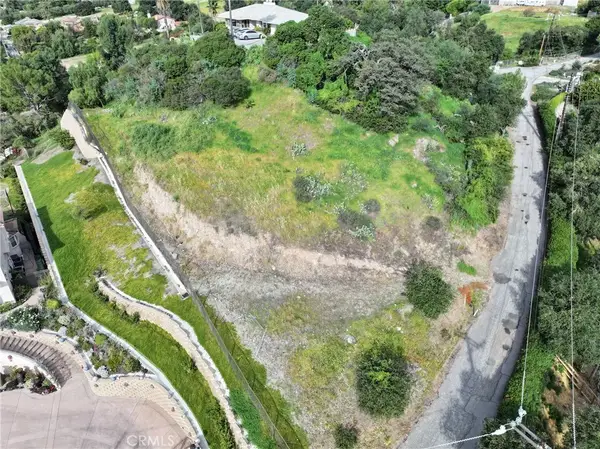 $280,000Active0 Acres
0 N Ben Lomond, Glendora, CA 91741
MLS# CV26028655Listed by: KALEO REAL ESTATE COMPANY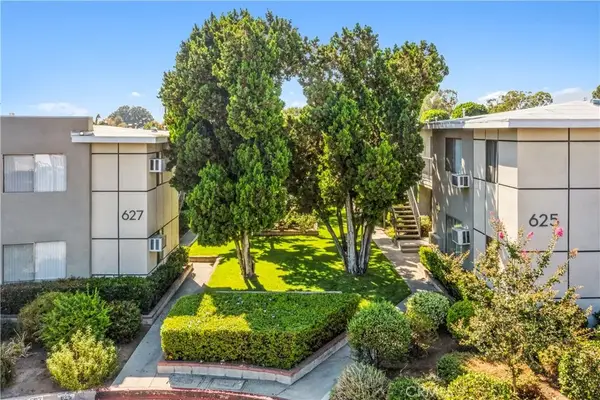 $4,575,000Pending6 beds 3 baths
625 S Wabash Avenue, Glendora, CA 91740
MLS# WS26027988Listed by: KELLER WILLIAMS REALTY/PASADENA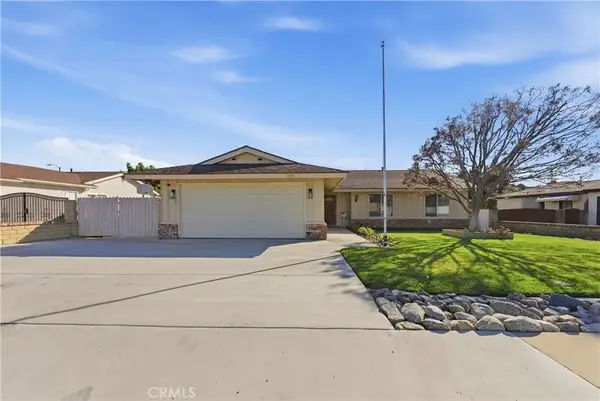 $1,025,000Pending4 beds 2 baths1,718 sq. ft.
1258 Cossacks Place, Glendora, CA 91741
MLS# CV26026915Listed by: THE REAL ESTATE RESOURCE GROUP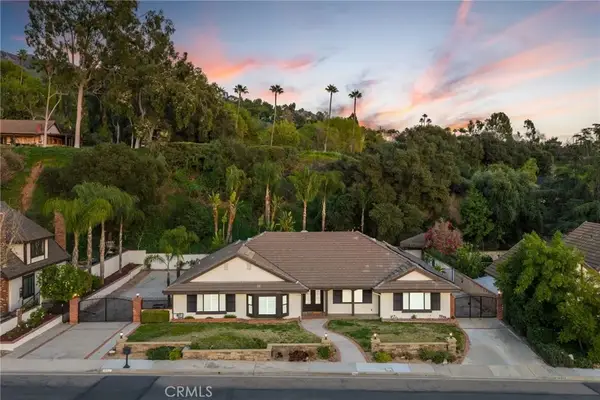 $1,399,000Active4 beds 2 baths2,520 sq. ft.
514 N Valley Center Avenue, Glendora, CA 91741
MLS# CV26024821Listed by: RE/MAX MASTERS REALTY $120,000Active2 beds 1 baths672 sq. ft.
201 E Arrow Hwy #70, Glendora, CA 91740
MLS# CRSR26022639Listed by: KELLER WILLIAMS VIP PROPERTIES- Open Mon, 10:30am to 4pm
 $720,990Active2 beds 3 baths1,371 sq. ft.
733 E. Route 66, Glendora, CA 91740
MLS# OC26021758Listed by: SEABRIGHT MANAGEMENT  $1,199,000Pending3 beds 3 baths2,350 sq. ft.
138 S Hacienda, Glendora, CA 91741
MLS# DW26014280Listed by: CENTURY 21 ALLSTARS $677,810Active2 beds 3 baths1,439 sq. ft.
729 E. Route 66, Glendora, CA 91740
MLS# CROC26021650Listed by: SEABRIGHT MANAGEMENT- Open Mon, 10:30am to 3:30pm
 $742,990Active3 beds 4 baths1,728 sq. ft.
723 E. Route 66, Glendora, CA 91740
MLS# OC26021358Listed by: SEABRIGHT MANAGEMENT  $189,999Pending3 beds 2 baths1,248 sq. ft.
201 E Arrow #73, Glendora, CA 91740
MLS# OC26018567Listed by: ARBOR REAL ESTATE $139,950Active2 beds 2 baths800 sq. ft.
451 S Sellers Street #29, Glendora, CA 91741
MLS# CRP1-25592Listed by: DAVID PAI COMMERICAL $650,000Pending3 beds 2 baths1,792 sq. ft.
7751 Cairngrove, Glendora, CA 91741
MLS# CRWS26014894Listed by: SONJA J. TRONCOSO $1,978,000Active5 beds 4 baths3,880 sq. ft.
2233 Valiant Street, Glendora, CA 91741
MLS# P1-25533Listed by: COMPASS $899,800Active3 beds 1 baths1,017 sq. ft.
811 Bridwell, Glendora, CA 91741
MLS# CRCV26011672Listed by: 6550 REALTY GROUP $949,000Pending4 beds 2 baths1,464 sq. ft.
119 W Gladstone, Glendora, CA 91740
MLS# CRSB26011544Listed by: EXP REALTY OF GREATER LOS ANGELES, INC. $898,800Pending3 beds 3 baths2,558 sq. ft.
432 E Bougainvillea Lane, Glendora, CA 91741
MLS# CRCV26008545Listed by: COMPASS $688,000Active2 beds 2 baths1,520 sq. ft.
130 N Vermont, Glendora, CA 91741
MLS# CRPW26009219Listed by: PARTNERS REAL ESTATE GROUP $1,140,000Active3 beds 2 baths1,617 sq. ft.
112 S Hacienda, Glendora, CA 91741
MLS# CRCV26021888Listed by: SYNERGY ONE REAL ESTATE $765,000Active3 beds 3 baths1,697 sq. ft.
1951 Cobblefield, Glendora, CA 91740
MLS# CV25279777Listed by: BR REAL ESTATE, INC. $3,799,995Active13 beds 12 baths9,368 sq. ft.
820 N Verano Drive, Glendora, CA 91741
MLS# 25631885Listed by: COMPASS $865,000Pending4 beds 2 baths1,464 sq. ft.
1032 E Juanita, Glendora, CA 91740
MLS# CV25280384Listed by: WORK REALTY ADVISORS $714,400Active4 beds 2 baths1,252 sq. ft.
1114 E Lemon, Glendora, CA 91741
MLS# CRCV25277794Listed by: KELLER WILLIAMS REALTY COLLEGE PARK $550,000Active2 beds 3 baths1,124 sq. ft.
520 Claraday Street #1, Glendora, CA 91740
MLS# CRDW25276459Listed by: STAR REALTY OF SOUTHERN CALIFORNIA $550,000Active2 beds 3 baths1,124 sq. ft.
520 Claraday Street #1, Glendora, CA 91740
MLS# DW25276459Listed by: STAR REALTY OF SOUTHERN CALIFORNIA $330,000Pending0.38 Acres
441 E Juanita, Glendora, CA 91740
MLS# CV25273917Listed by: VISMAR REAL ESTATE $1,500,000Active3 beds 2 baths3,516 sq. ft.
705 Beaverbrook, Glendora, CA 91740
MLS# CV25270190Listed by: RE/MAX MASTERS REALTY $775,000Active3 beds 2 baths1,094 sq. ft.
6003 N Briargate, Glendora, CA 91740
MLS# CRCV25270627Listed by: NM LEGACY REALTY & ASSOCIATES $1,495,000Active4 beds 4 baths3,135 sq. ft.
1356 S Prospero, Glendora, CA 91740
MLS# CV25265210Listed by: BARRON REAL ESTATE $1,495,000Active4 beds 4 baths3,135 sq. ft.
1356 S Prospero, Glendora, CA 91740
MLS# CV25265210Listed by: BARRON REAL ESTATE $4,000,000Active4 beds 4 baths
310 W Mountain View Ave, Glendora, CA 91741
MLS# CV25266795Listed by: DAVID REID REAL ESTATE $570,000Active0 Acres
1826 Bluebird, Glendora, CA 91741
MLS# AR25261327Listed by: CAL METRO REALTY $1,490,000Active5 beds 4 baths2,507 sq. ft.
326 E Sierra Madre Avenue, Glendora, CA 91741
MLS# WS25257278Listed by: MALVIN ROMPAS, BROKER $1,399,000Active3 beds 3 baths2,700 sq. ft.
425 Fern Dell Place, Glendora, CA 91741
MLS# 25616083Listed by: REVILO REALTY, INC. $139,900Active2 beds 2 baths1,504 sq. ft.
1630 S Barranca, Glendora, CA 91740
MLS# CRCV25252622Listed by: CORNERSTONE REALTY GROUP $9,500,000Active6 beds 6 baths8,943 sq. ft.
658 Oakhill Drive, Glendora, CA 91741
MLS# AR25251391Listed by: COLDWELL BANKER REALTY $134,950Active2 beds 2 baths630 sq. ft.
732 E Route 66 #7, Glendora, CA 91740
MLS# CRWS25249855Listed by: HARMONY COMMUNITIES $109,999Active2 beds 1 baths672 sq. ft.
826 E Route 66, Glendora, CA 91740
MLS# CRPW25248510Listed by: COCHRAN REAL ESTATE PROFESSIONALS INC $850,000Active3 beds 2 baths986 sq. ft.
205 W Linfield, Glendora, CA 91740
MLS# IV26027399Listed by: H & L LEGACY CORP. $850,000Active3 beds 4 baths1,870 sq. ft.
623 W Foothill #39, Glendora, CA 91741
MLS# CRWS25228012Listed by: IRN REALTY $3,999,000Active3.82 Acres
1449 E Bennett Avenue, Glendora, CA 91741
MLS# CRCV25186976Listed by: KALEO REAL ESTATE COMPANY $699,000Active3 beds 2 baths1,470 sq. ft.
19003 E Haltern Avenue, Glendora, CA 91740
MLS# TR25183253Listed by: CENTURY 21 MASTERS $89,999Pending3 beds 2 baths920 sq. ft.
201 E Arrow #64, Glendora, CA 91740
MLS# PW25178356Listed by: HOMESMART REALTY GROUP $710,800Pending3 beds 2 baths1,121 sq. ft.
1137 Willow Avenue, Glendora, CA 91740
MLS# CRCV25167203Listed by: NEXGEN REALTORS $999,999Active2 beds 2 baths1,364 sq. ft.
947 N Glendora Avenue, Glendora, CA 91741
MLS# CRCV25168380Listed by: RE/MAX MASTERS REALTY $629,900Pending4 beds 2 baths1,383 sq. ft.
1309 Wales Avenue, Glendora, CA 91740
MLS# CV20017028Listed by: CENTURY 21 KING $1,388,888Active2 beds -- baths2,883 sq. ft.
2022 E Route 66, Glendora, CA 91740
MLS# CL25565575Listed by: CBRE $980,000Active2 beds -- baths1,487 sq. ft.
2010 E Route 66, Glendora, CA 91740
MLS# CL25565615Listed by: CBRE $598,000Active1.05 Acres
946 N Glendora Ave, Glendora, CA 91741
MLS# CV26007604Listed by: YES! MORTGAGE $3,998,000Active6 beds 6 baths6,789 sq. ft.
1051 Oak Canyon Lane, Glendora, CA 91741
MLS# CV25118511Listed by: COMPASS $2,788,000Active5 beds 7 baths4,375 sq. ft.
1170 N Englewild Dr., Glendora, CA 91741
MLS# PW25098470Listed by: COLDWELL BANKER PLATINUM PROP. $155,000Active2 beds 2 baths720 sq. ft.
732 E Route 66 #4, Glendora, CA 91740
MLS# CRCV25275412Listed by: PREMIER REALTY ASSOCIATES $1,080,000Active0.33 Acres
1060 E Route 66, Glendora, CA 91740
MLS# CRCV25081036Listed by: RE/MAX CHAMPIONS $1,080,000Active2 beds 1 baths1,239 sq. ft.
1060 E Route 66, Glendora, CA 91740
MLS# CV25067817Listed by: RE/MAX CHAMPIONS $1,750,000Active13.35 Acres
1018 N Glendora Avenue, Glendora, CA 91741
MLS# CROC25040336Listed by: RE/MAX ONE $140,000Active3 beds 2 baths896 sq. ft.
1700 S Glendora Avenue #43, Glendora, CA 91740
MLS# CRCV25025133Listed by: RE/MAX CHAMPIONS $739,000Active3 beds 2 baths1,326 sq. ft.
1760 S Vecino Avenue, Glendora, CA 91740
MLS# 25487035Listed by: KELLER WILLIAMS BEVERLY HILLS $925,000Pending3 beds 2 baths1,612 sq. ft.
248 S Vecino Avenue, Glendora, CA 91741
MLS# CRWS24087456Listed by: KELLER WILLIAMS SIGNATURE RLTY $999,000Active0 Acres
648 Gordon Highlands, Glendora, CA 91741
MLS# PF23001539Listed by: DOUGLAS ELLIMAN OF CA INC
Local realty services provided by:CENTURY 21 Wildwood Properties, Inc., CENTURY 21 Synergia Realty, CENTURY 21 Affiliated
The information being provided by California Regional MLS (Southern California) is for the consumer's personal, non-commercial use and may not be used for any purpose other than to identify prospective properties consumer may be interested in purchasing. Any information relating to real estate for sale referenced on this web site comes from the Internet Data Exchange (IDX) program of the California Regional MLS (Southern California). CENTURY 21 Synergia Realty is not a Multiple Listing Service (MLS), nor does it offer MLS access. This website is a service of CENTURY 21 Synergia Realty, a broker participant of California Regional MLS (Southern California). This web site may reference real estate listing(s) held by a brokerage firm other than the broker and/or agent who owns this web site.
The accuracy of all information, regardless of source, including but not limited to open house information, square footages and lot sizes, is deemed reliable but not guaranteed and should be personally verified through personal inspection by and/or with the appropriate professionals. The data contained herein is copyrighted by California Regional MLS (Southern California) and is protected by all applicable copyright laws. Any unauthorized dissemination of this information is in violation of copyright laws and is strictly prohibited.
Copyright 2021 California Regional MLS (Southern California). All rights reserved.
This information is deemed reliable but not guaranteed. You should rely on this information only to decide whether or not to further investigate a particular property. BEFORE MAKING ANY OTHER DECISION, YOU SHOULD PERSONALLY INVESTIGATE THE FACTS (e.g. square footage and lot size) with the assistance of an appropriate professional. You may use this information only to identify properties you may be interested in investigating further. All uses except for personal, non-commercial use in accordance with the foregoing purpose are prohibited. Redistribution or copying of this information, any photographs or video tours is strictly prohibited. This information is derived from the Internet Data Exchange (IDX) service provided by San Diego MLS®. Displayed property listings may be held by a brokerage firm other than the broker and/or agent responsible for this display. The information and any photographs and video tours and the compilation from which they are derived is protected by copyright. Compilation © 2020 San Diego MLS®, Inc.
Neighborhoods near Glendora, CA
Zip codes near Glendora, CA
- 91008 homes for sale
- 91010 homes for sale
- 91016 homes for sale
- 91702 homes for sale
- 91706 homes for sale
- 91711 homes for sale
- 91722 homes for sale
- 91723 homes for sale
- 91724 homes for sale
- 91740 homes for sale
- 91741 homes for sale
- 91744 homes for sale
- 91750 homes for sale
- 91766 homes for sale
- 91767 homes for sale
- 91768 homes for sale
- 91773 homes for sale
- 91790 homes for sale
- 91791 homes for sale
- 91792 homes for sale
Popular searches near Glendora, CA
- Azusa homes for sale
- Baldwin Park homes for sale
- Bradbury homes for sale
- Charter Oak homes for sale
- Citrus homes for sale
- Claremont homes for sale
- Covina homes for sale
- Duarte homes for sale
- East San Gabriel Valley homes for sale
- La Verne homes for sale
- Monrovia homes for sale
- Phillips Ranch homes for sale
- Pomona homes for sale
- San Dimas homes for sale
- South Monrovia Island homes for sale
- Valinda homes for sale
- Vincent homes for sale
- Walnut homes for sale
- West Covina homes for sale
- West Puente Valley homes for sale
Protect your home and budget from life's surprises with an Assurant Home Warranty, backed by a partner that supports you through every step of homeownership. Explore Plans.
©2026 Century 21 Real Estate LLC. All rights reserved. CENTURY 21®, the CENTURY 21 Logo and C21® are service marks owned by Century 21 Real Estate LLC. Century 21 Real Estate LLC fully supports the principles of the Fair Housing Act and the Equal Opportunity Act. Each office is independently owned and operated. Listing information is deemed reliable but not guaranteed accurate.