- Coronado, Hot Springs Village homes for sale
- Cortez Highlands, Hot Springs Village homes for sale
- East Village, Hot Springs Village homes for sale
- Glazy Peau, Hot Springs Village homes for sale
- SoBo, Hot Springs Village homes for sale
- The Foothills, Hot Springs Village homes for sale
- The Mountain, Hot Springs Village homes for sale
- Village Center, Hot Springs Village homes for sale
- Wake Village, Wake Village homes for sale
- West Village, Hot Springs Village homes for sale
Grannis, AR - homes for sale
2 of 2 results displayed
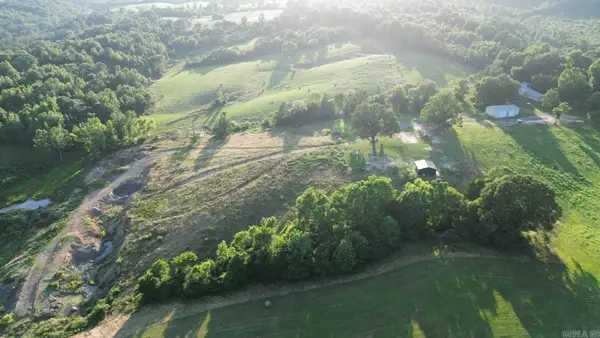 $185,000Active9 Acres
520 Frachiseur Road, Grannis, AR 71944
MLS# 26027377Listed by: SMITH & MOUNTS REALTY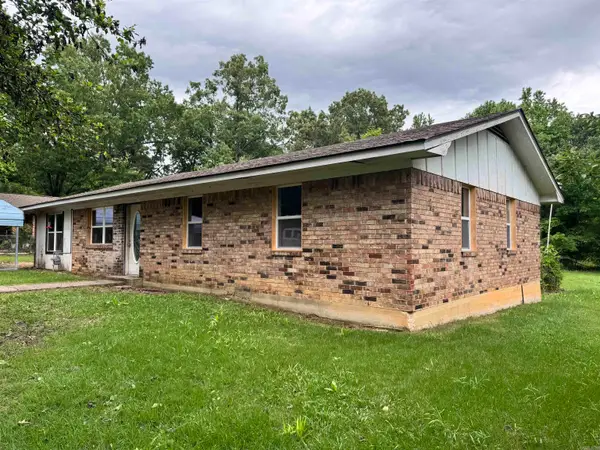 $139,000Active3 beds 1 baths1,404 sq. ft.
151 Payne Street, Grannis, AR 71944
MLS# 26017177Listed by: SELECT REALTY
Local realty services provided by:CENTURY 21 PORTFOLIO
Neighborhoods near Grannis, AR
Zip codes near Grannis, AR
- 71832 homes for sale
- 71833 homes for sale
- 71841 homes for sale
- 71842 homes for sale
- 71846 homes for sale
- 71851 homes for sale
- 71852 homes for sale
- 71937 homes for sale
- 71945 homes for sale
- 71950 homes for sale
- 71952 homes for sale
- 71953 homes for sale
- 71959 homes for sale
- 71971 homes for sale
- 71972 homes for sale
- 71973 homes for sale
- 74728 homes for sale
- 74734 homes for sale
- 74957 homes for sale
- 74963 homes for sale
Popular searches near Grannis, AR
- Bear Creek homes for sale
- Cove homes for sale
- Cove township homes for sale
- De Queen homes for sale
- De Queen North homes for sale
- De Queen South homes for sale
- Dierks homes for sale
- Eagletown homes for sale
- Gap Springs homes for sale
- Gillham homes for sale
- Hatfield homes for sale
- Madison homes for sale
- Mineral homes for sale
- Monroe homes for sale
- Red Colony homes for sale
- Umpire homes for sale
- Vandervoort homes for sale
- Watson homes for sale
- White homes for sale
- Wickes homes for sale
Protect your home and budget from life's surprises with an Assurant Home Warranty, backed by a partner that supports you through every step of homeownership. Explore Plans.
©2026 Century 21 Real Estate LLC. All rights reserved. CENTURY 21®, the CENTURY 21 Logo and C21® are service marks owned by Century 21 Real Estate LLC. Century 21 Real Estate LLC fully supports the principles of the Fair Housing Act and the Equal Opportunity Act. Each office is independently owned and operated. Listing information is deemed reliable but not guaranteed accurate.