- Bath Beach, Brooklyn homes for sale
- Bensonhurst, Brooklyn homes for sale
- Borough Park, Brooklyn homes for sale
- Brighton Beach, Brooklyn homes for sale
- Coney Island, Brooklyn homes for sale
- Ditmas Park, Brooklyn homes for sale
- Dyker Heights, Brooklyn homes for sale
- Flatlands, Brooklyn homes for sale
- Gerritsen Beach, Brooklyn homes for sale
- Homecrest, Brooklyn homes for sale
- Kensington, Brooklyn homes for sale
- Madison, Brooklyn homes for sale
- Manhattan Beach, Brooklyn homes for sale
- Marine Park, Brooklyn homes for sale
- Midwood, Brooklyn homes for sale
- New Utrecht, Brooklyn homes for sale
- Sea Gate, Brooklyn homes for sale
- Sheepshead Bay, Brooklyn homes for sale
- Southeastern Brooklyn, Brooklyn homes for sale
- Southern Brooklyn, Brooklyn homes for sale
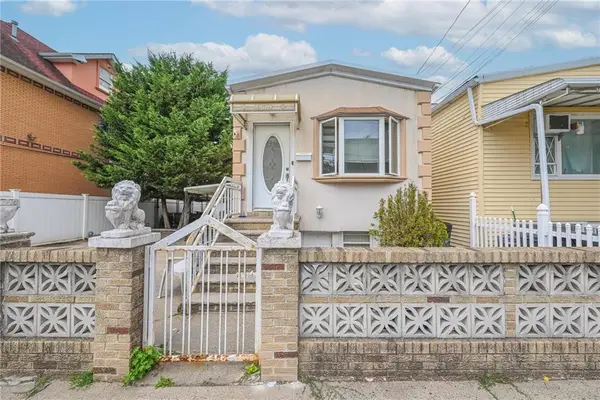
Gravesend, Brooklyn, NY - homes for sale
1 of 1 results displayed
Local realty services provided by:CENTURY 21 Awaye Realty
Popular neighborhoods near Gravesend, Brooklyn, NY
Zip codes near Gravesend, Brooklyn, NY
- 11203 homes for sale
- 11204 homes for sale
- 11209 homes for sale
- 11210 homes for sale
- 11214 homes for sale
- 11215 homes for sale
- 11218 homes for sale
- 11219 homes for sale
- 11220 homes for sale
- 11223 homes for sale
- 11224 homes for sale
- 11225 homes for sale
- 11226 homes for sale
- 11228 homes for sale
- 11229 homes for sale
- 11230 homes for sale
- 11232 homes for sale
- 11234 homes for sale
- 11235 homes for sale
- 11697 homes for sale
Counties near Gravesend, Brooklyn, NY
- Bergen County homes for sale
- Bronx County homes for sale
- Essex County homes for sale
- Hudson County homes for sale
- Hunterdon County homes for sale
- Kings County homes for sale
- Mercer County homes for sale
- Middlesex County homes for sale
- Monmouth County homes for sale
- Morris County homes for sale
- Nassau County homes for sale
- New York County homes for sale
- Passaic County homes for sale
- Queens County homes for sale
- Richmond County homes for sale
- Rockland County homes for sale
- Somerset County homes for sale
- Sussex County homes for sale
- Union County homes for sale
- Westchester County homes for sale
Protect your home and budget from life's surprises with an Assurant Home Warranty, backed by a partner that supports you through every step of homeownership. Explore Plans.
©2026 Century 21 Real Estate LLC. All rights reserved. CENTURY 21®, the CENTURY 21 Logo and C21® are service marks owned by Century 21 Real Estate LLC. Century 21 Real Estate LLC fully supports the principles of the Fair Housing Act and the Equal Opportunity Act. Each office is independently owned and operated. Listing information is deemed reliable but not guaranteed accurate.