- Chinquapin homes for sale
- Faison Township homes for sale
- Harrells homes for sale
- Island Creek homes for sale
- Kenansville Township homes for sale
- Kenansville homes for sale
- Lisbon homes for sale
- Magnolia township homes for sale
- Magnolia homes for sale
- Rockfish homes for sale
- Rose Hill Township homes for sale
- Rose Hill homes for sale
- South Clinton homes for sale
- Taylors Bridge homes for sale
- Teachey homes for sale
- Turkey homes for sale
- Turkey township homes for sale
- Wallace homes for sale
- Warsaw homes for sale
- Warsaw Township homes for sale
28453, NC - homes for sale
9 of 9 results displayed
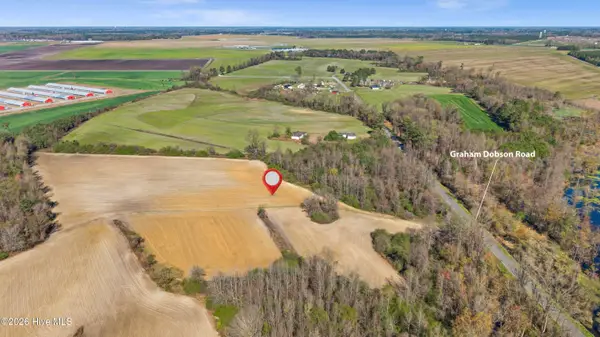 $129,900Active12.86 Acres
0 Graham Dobson Road, Magnolia, NC 28453
MLS# 100560517Listed by: RELENTLESS VENTURES REALTY GROUP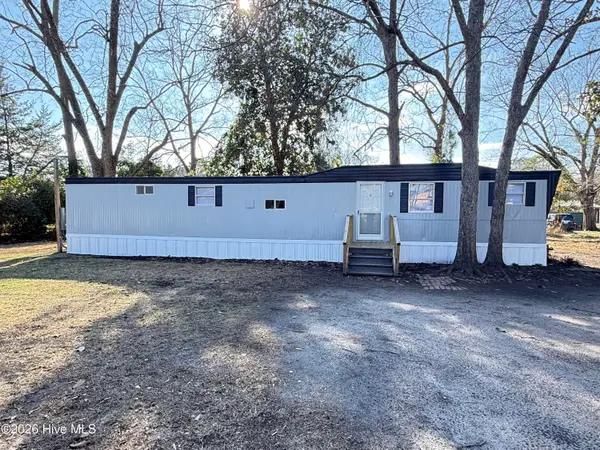 $99,900Active3 beds 1 baths896 sq. ft.
113 N Academy Street, Magnolia, NC 28453
MLS# 100557312Listed by: KORNEGAY REALTY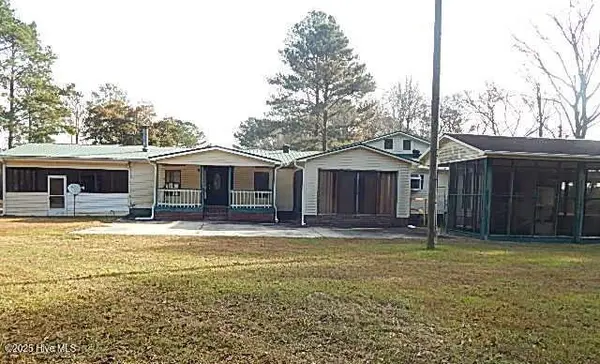 $150,000Active3 beds 2 baths1,684 sq. ft.
149 Jeff Murphy Lane, Magnolia, NC 28453
MLS# 100542922Listed by: CARDINAL HOMES REALTY $185,000Active3 beds 2 baths1,068 sq. ft.
122 W Faison Street, Magnolia, NC 28453
MLS# 100540255Listed by: SIMPSON REAL ESTATE GROUP INC $335,000Active4 beds 3 baths2,723 sq. ft.
451 Tracy Brown Road, Magnolia, NC 28453
MLS# 100537173Listed by: SIMPSON REAL ESTATE GROUP INC $235,000Active3 beds 1 baths1,049 sq. ft.
1110 S Dobson Chapel Road S, Magnolia, NC 28453
MLS# 100532501Listed by: SIMPSON REAL ESTATE GROUP INC $2,250,000Active45.88 Acres
103 S Julius Monk Mhp Lane, Kenansville, NC 28349
MLS# 100496874Listed by: UNITED COUNTRY DRAUGHON REALTY $12,900Pending0.46 Acres
14 Whispering Pines Lane, Magnolia, NC 28453
MLS# 100256395Listed by: JOHNSON REALTY $12,900Pending0.46 Acres
13 Whispering Pines Lane, Magnolia, NC 28453
MLS# 100264234Listed by: JOHNSON REALTY
Local realty services provided by:CENTURY 21 Triangle Group
Popular searches near 28453
Popular neighborhoods near 28453
- Aragona Village, Jacksonville homes for sale
- Bayshore, Wilmington homes for sale
- Blue Clay Farms, Wilmington homes for sale
- Blue Creek Farms, Jacksonville homes for sale
- Brittany, Wilmington homes for sale
- Carolina Forest, Jacksonville homes for sale
- Carolina Plantations, Jacksonville homes for sale
- Castle Hayne, Wilmington homes for sale
- Hampstead, Hampstead homes for sale
- Hightsville, Wilmington homes for sale
- Holly Shelter, Castle Hayne homes for sale
- Hunter's Creek, Jacksonville homes for sale
- Lauradale Acres, Jacksonville homes for sale
- Northchase, Wilmington homes for sale
- Northside, Wilmington homes for sale
- Skippers Corner, Castle Hayne homes for sale
- Southwest Plantation, Maple Hill homes for sale
- Springview, Wilmington homes for sale
- Stone Bay, Holly Ridge homes for sale
- Wrightsboro, Castle Hayne homes for sale
Counties near Magnolia, 28453
- Bladen County homes for sale
- Brunswick County homes for sale
- Columbus County homes for sale
- Craven County homes for sale
- Cumberland County homes for sale
- Duplin County homes for sale
- Greene County homes for sale
- Harnett County homes for sale
- Hoke County homes for sale
- Johnston County homes for sale
- Jones County homes for sale
- Lenoir County homes for sale
- New Hanover County homes for sale
- Onslow County homes for sale
- Pender County homes for sale
- Pitt County homes for sale
- Robeson County homes for sale
- Sampson County homes for sale
- Wayne County homes for sale
- Wilson County homes for sale
Protect your home and budget from life's surprises with an Assurant Home Warranty, backed by a partner that supports you through every step of homeownership. Explore Plans.
©2026 Century 21 Real Estate LLC. All rights reserved. CENTURY 21®, the CENTURY 21 Logo and C21® are service marks owned by Century 21 Real Estate LLC. Century 21 Real Estate LLC fully supports the principles of the Fair Housing Act and the Equal Opportunity Act. Each office is independently owned and operated. Listing information is deemed reliable but not guaranteed accurate.