- Beaumont homes for sale
- Bridge City homes for sale
- Bridge City-Orangefield homes for sale
- Evadale homes for sale
- Fannett homes for sale
- Forest Heights homes for sale
- Groves homes for sale
- LaBelle homes for sale
- Little Cypress homes for sale
- Lumberton homes for sale
- Mauriceville homes for sale
- Nederland homes for sale
- Orange homes for sale
- Pinehurst homes for sale
- Port Arthur homes for sale
- Port Neches homes for sale
- Starks homes for sale
- Vidor homes for sale
- Vinton homes for sale
- West Orange homes for sale
Orange County, TX - homes for sale
288 of 288 results displayed
- New
 $291,190Active4 beds 3 baths2,041 sq. ft.
5610 Spoonbill Lane, Orange, TX 77632
MLS# 26616412Listed by: D.R. HORTON-TEXAS, LTD - New
 $394,900Active4 beds 3 baths3,044 sq. ft.
6330 Chasse Stone, Orange, TX 77632
MLS# 58404333Listed by: AMERICAN REAL ESTATE ORANGE - New
 $269,000Active3 beds 2 baths1,861 sq. ft.
6655 Ashby Way, Orange, TX 77630
MLS# 72093083Listed by: LANGE REALTY GROUP - New
 $369,000Active3 beds 3 baths1,885 sq. ft.
2363 Twin Oaks, Orange, TX 77630
MLS# 7646286Listed by: COLDWELL BANKER SOUTHERN HOMES - New
 $425,000Active3 beds 3 baths3,328 sq. ft.
4434 Hillbrook Drive, Orange, TX 77632
MLS# 36602972Listed by: RE/MAX ONE - New
 $118,000Active3 beds 2 baths2,228 sq. ft.
21788 Interstate Highway 10, Vidor, TX 77662
MLS# 53527396Listed by: TRILLIONAIRE REALTY - New
 $89,900Active3 beds 3 baths2,511 sq. ft.
1004 Cherry, Orange, TX 77630
MLS# 1953097Listed by: RED DOOR REALTY - New
 $149,900Active2 beds 2 baths1,188 sq. ft.
481 Moore, Vidor, TX 77662
MLS# 14579554Listed by: AMERICAN REAL ESTATE ORANGE - New
 $169,900Active3 beds 2 baths1,183 sq. ft.
1833 W Decker Avenue, Orange, NH 77632
MLS# 14625124Listed by: AMERICAN REAL ESTATE ORANGE - New
 $276,725Active4 beds 3 baths2,092 sq. ft.
6780 Arbor Way, Orange, TX 77630
MLS# 18924262Listed by: REGENCY REAL ESTATE PROFESSIONALS - New
 $263,105Active4 beds 3 baths1,851 sq. ft.
6795 Arbor Way, Orange, TX 77630
MLS# 30189115Listed by: REGENCY REAL ESTATE PROFESSIONALS - New
 $229,900Active3 beds 2 baths1,688 sq. ft.
1450 Bassett Street, Orange, TX 77632
MLS# 51819544Listed by: COLDWELL BANKER SOUTHERN HOMES - New
 $267,500Active3 beds 3 baths1,956 sq. ft.
2807 Bear Trail, Orange, TX 77632
MLS# 63237086Listed by: AMERICAN REAL ESTATE ORANGE - New
 $349,900Active4 beds 2 baths2,155 sq. ft.
200 Zachary, Bridge City, TX 77611
MLS# 67735792Listed by: AMERICAN REAL ESTATE ORANGE - New
 $300,735Active4 beds 3 baths1,885 sq. ft.
322 Dove Court, Bridge City, TX 77611
MLS# 87115790Listed by: REGENCY REAL ESTATE PROFESSIONALS  $839,900Pending4 beds 4 baths3,191 sq. ft.
132 Peachleaf Drive, Krugerville, TX 76227
MLS# 21220553Listed by: LGI HOMES- New
 $229,000Active3 beds 2 baths1,636 sq. ft.
1833 Maple Ave, Orange, TX 77632
MLS# 1952560Listed by: RED DOOR REALTY - New
 $209,900Active5 beds 3 baths2,040 sq. ft.
7024 Morris Rd, Orange, TX 77632
MLS# 20262053Listed by: SUMMERS COOK & COMPANY  $165,000Active3 beds 2 baths1,352 sq. ft.
1110 N 5th Street, Orange, TX 77630
MLS# 51693297Listed by: KELLER WILLIAMS ELITE $108,000Active3 beds 2 baths1,320 sq. ft.
4744 Randall Road, Orange, TX 77632
MLS# 94905636Listed by: TRIANGLE REAL ESTATE, LLC $96,900Active3 beds 2 baths1,153 sq. ft.
811 W Scott St., Orange, TX 77630
MLS# 20261998Listed by: SUMMERS COOK & COMPANY $230,000Pending2 beds 2 baths2,000 sq. ft.
14899 Highway 62 N, Orange, TX 77632
MLS# 46528416Listed by: RE/MAX PRO $18,500Active0.21 Acres
2514 8th Street, Orange, TX 77630
MLS# 59931441Listed by: SOUTHEAST TEXAS 1ST REALTY $29,500Active0.49 Acres
1609 Missouri Street, Orange, TX 77630
MLS# 6826095Listed by: SOUTHEAST TEXAS 1ST REALTY $109,900Active2 beds 1 baths
5487 Fairview Dr, Bridge City, TX 77630
MLS# 10793251Listed by: COLDWELL BANKER SOUTHERN HOMES $26,000Active0.33 Acres
1555 Cherokee Street, Vidor, TX 77662
MLS# 35978999Listed by: JASON MITCHELL GROUP $32,000Active0.51 Acres
185 Regina Road, Vidor, TX 77662
MLS# 40598288Listed by: JASON MITCHELL GROUP $34,000Active0.68 Acres
2106 Travis Street, West Orange, TX 77630
MLS# 66485532Listed by: JASON MITCHELL GROUP $18,000Active0.27 Acres
955 Rene Lane, Vidor, TX 77662
MLS# 75035144Listed by: JASON MITCHELL GROUP $499,900Active3 beds 3 baths3,168 sq. ft.
1801 Cub Trail, Orange, TX 77632
MLS# 53997082Listed by: COLDWELL BANKER SOUTHERN HOMES $119,900Pending2 beds 2 baths1,482 sq. ft.
1802 29th Street, Orange, TX 77630
MLS# 70202179Listed by: 2011 AMERICAN REAL ESTATE CO. LLC $395,000Active3 beds 4 baths2,615 sq. ft.
3803 Martin Luther King Jr Drive, Orange, TX 77632
MLS# 80729105Listed by: AMERICAN REAL ESTATE ORANGE $265,000Active4 beds 2 baths1,872 sq. ft.
3210 Martha Street, Vidor, TX 77662
MLS# 71965360Listed by: RE/MAX EXCELLENCE $199,900Active4 beds 2 baths1,734 sq. ft.
270 Jane, Bridge City, TX 77611
MLS# 36196299Listed by: RE/MAX ONE $2,613,200Active791 Acres
00 Corrigan Road, Vidor, TX 77662
MLS# 21205311Listed by: BRADLEY PAUL WILSON $46,000Active0.5 Acres
145 Blueberry Street, Bridge City, TX 77611
MLS# 90429586Listed by: AMERICAN REAL ESTATE MIDCOUNTY $243,190Active4 beds 2 baths1,796 sq. ft.
5630 Canvasback, Orange, TX 77632
MLS# 41579829Listed by: D.R. HORTON $46,800Active2 beds 1 baths852 sq. ft.
9122 Tulane Road, Orange, TX 77630
MLS# 22124610Listed by: AMERICAN REAL ESTATE MIDCOUNTY $169,900Active4 beds 3 baths1,609 sq. ft.
970 Charleston Circle, Bridge City, TX 77611
MLS# 35506179Listed by: DAYNA SIMMONS REAL ESTATE $219,900Pending4 beds 3 baths1,632 sq. ft.
316 Linda, Bridge City, TX 77611
MLS# 71182917Listed by: RE/MAX ONE $265,000Active3 beds 2 baths1,779 sq. ft.
160 Lauren, Orange, TX 77630
MLS# 31193070Listed by: RE/MAX ONE $309,900Active4 beds 2 baths2,271 sq. ft.
790 Bridgeview, Bridge City, TX 77611
MLS# 48738556Listed by: RE/MAX ONE $159,900Active3 beds 2 baths2,040 sq. ft.
4220 W Sutton Drive, Vidor, TX 77662
MLS# 34938293Listed by: JOSEPH WALTER REALTY, LLC $259,900Active3 beds 2 baths1,781 sq. ft.
3703 Mcknight Rd, Bridge City, TX 77611
MLS# 83687168Listed by: RE/MAX ONE $439,000Active4 beds 4 baths3,092 sq. ft.
6305 Meadow Mist, Orange, TX 77632
MLS# 66755461Listed by: RE/MAX ONE $267,700Active5 beds 2 baths2,262 sq. ft.
770 Katherene, Bridge City, TX 77611
MLS# 75323537Listed by: RE/MAX ONE $840,000Active-- beds -- baths4,078 sq. ft.
6854 Lazy Vale Ct., Tyler, TX 75703
MLS# 26003089Listed by: P&I REAL ESTATE MANAGEMENT $194,900Active3 beds 2 baths1,474 sq. ft.
351 Dobbyn, Bridge City, TX 77611
MLS# 20770471Listed by: RE/MAX ONE $254,900Active3 beds 2 baths1,463 sq. ft.
276 Pineburr Street, Vidor, TX 77662
MLS# 54693270Listed by: RE/MAX PRO $585,000Active4 beds 3 baths3,324 sq. ft.
9448 Acadian Way, Orange, TX 77630
MLS# 37627190Listed by: LANGE REALTY GROUP $359,900Pending5 beds 3 baths3,300 sq. ft.
3212 Timberlane Circle, Orange, TX 77632
MLS# 55748828Listed by: AMERICAN REAL ESTATE ORANGE $429,900Active4 beds 3 baths2,264 sq. ft.
1065 Fm 1078, Orange, TX 77632
MLS# 72216189Listed by: AMERICAN REAL ESTATE ORANGE $44,900Active1.56 Acres
1270 Operators Lane, Vidor, TX 77662
MLS# 10627965Listed by: COLDWELL BANKER SOUTHERN HOMES $165,000Active3 beds 2 baths1,368 sq. ft.
2227 Westway Street, Orange, TX 77630
MLS# 87158948Listed by: CAPITAL TRUST REALTY $219,995Active3 beds 2 baths2,347 sq. ft.
2960 Call Street, Vidor, TX 77662
MLS# 26712939Listed by: 007 SIGNATURE REALTY, LLC $330,000Pending4 beds 2 baths2,267 sq. ft.
12273 Highway 12, Orange, TX 77632
MLS# 32102940Listed by: COLDWELL BANKER SOUTHERN HOMES $450,000Active4 beds 3 baths2,718 sq. ft.
665 Winchester Drive, Bridge City, TX 77611
MLS# 59675819Listed by: DAYNA SIMMONS REAL ESTATE $266,000Pending3 beds 2 baths1,788 sq. ft.
103 Holly Grove Street, Bridge City, TX 77611
MLS# 31658481Listed by: COLDWELL BANKER SOUTHERN HOMES $89,900Active2 beds 1 baths1,000 sq. ft.
2115 Bonnie Street, Orange, TX 77630
MLS# 79399331Listed by: HOUSTON, REALTORS $175,000Pending3 beds 2 baths1,344 sq. ft.
1364 Beagle Road, Orange, TX 77632
MLS# 78631100Listed by: COLDWELL BANKER SOUTHERN HOMES $299,990Pending3 beds 2 baths1,925 sq. ft.
411 Redbird Dr Court, Bridge City, TX 77611
MLS# 81952510Listed by: REGENCY REAL ESTATE PROFESSIONALS $238,000Pending3 beds 2 baths1,410 sq. ft.
105 Butler Road, Vidor, TX 77662
MLS# 24584394Listed by: RE/MAX ONE $215,000Pending86.27 Acres
TBD (5900) Corrigan Road Road, Vidor, TX 77662
MLS# 73737403Listed by: SOUTHERN STAR REALTY $155,000Active3 beds 1 baths1,132 sq. ft.
340 Warner, Bridge City, TX 77611
MLS# 82661983Listed by: RE/MAX ONE $219,000Active2 beds 2 baths1,731 sq. ft.
1306 Bassett Street, Orange, TX 77632
MLS# 14478991Listed by: COLDWELL BANKER SOUTHERN HOMES $254,990Pending3 beds 2 baths1,780 sq. ft.
18535 Henley Way, Orange, TX 77630
MLS# 28135520Listed by: REGENCY REAL ESTATE PROFESSIONALS $29,900Active0 Acres
9 Bayou Bend, Orange, TX 77630
MLS# 83326251Listed by: HOMESMART $229,000Pending3 beds 2 baths1,458 sq. ft.
570 Moreland Street, Vidor, TX 77662
MLS# 21919940Listed by: RE/MAX PRO $276,990Pending4 beds 2 baths1,986 sq. ft.
4765 Little Cypress Loop, Orange, TX 77632
MLS# 41127204Listed by: REGENCY REAL ESTATE PROFESSIONALS $164,900Active3 beds 2 baths1,646 sq. ft.
1520 Longhorn Avenue, Orange, TX 77630
MLS# 11488933Listed by: AMERICAN REAL ESTATE ORANGE $110,000Active3 beds 2 baths2,212 sq. ft.
1202 Pine Avenue, Orange, TX 77630
MLS# 7086699Listed by: SOUTHEAST TEXAS 1ST REALTY $260,990Pending3 beds 2 baths1,848 sq. ft.
18565 Henley Way, Orange, TX 77630
MLS# 11714167Listed by: REGENCY REAL ESTATE PROFESSIONALS $257,990Pending4 beds 3 baths1,851 sq. ft.
18665 Henley Way, Orange, TX 77630
MLS# 73562005Listed by: REGENCY REAL ESTATE PROFESSIONALS $283,990Pending4 beds 3 baths2,092 sq. ft.
1670 Little Cypress Loop, Orange, TX 77632
MLS# 89339124Listed by: REGENCY REAL ESTATE PROFESSIONALS $267,570Pending4 beds 2 baths1,885 sq. ft.
1285 Little Cypress Loop, Orange, TX 77632
MLS# 31620100Listed by: REGENCY REAL ESTATE PROFESSIONALS $55,000Active0 Acres
1308 14th Street, Orange, TX 77630
MLS# 21652206Listed by: KELLER WILLIAMS REALTY METROPOLITAN $80,000Active3 beds 1 baths948 sq. ft.
518 Azalea Avenue, Orange, TX 77630
MLS# 33880875Listed by: COLDWELL BANKER SOUTHERN HOMES $282,900Active4 beds 2 baths2,542 sq. ft.
2515 Black Oak Drive, Orange, TX 77632
MLS# 7373733Listed by: COLDWELL BANKER SOUTHERN HOMES $50,000Active0 Acres
810 Texas Street, Orange, TX 77630
MLS# 85934981Listed by: KELLER WILLIAMS REALTY METROPOLITAN $300,000Pending5 beds 2 baths2,375 sq. ft.
2705 E Tanager Trail, Orange, TX 77632
MLS# 12836386Listed by: DAYNA SIMMONS REAL ESTATE $119,900Active3 beds 2 baths1,344 sq. ft.
1709 Robin Avenue, Orange, TX 77632
MLS# 68830806Listed by: AMERICAN REAL ESTATE ORANGE $80,000Active10 Acres
TBD Sargent Street, Vidor, TX 77662
MLS# 53059766Listed by: NAN & COMPANY PROPERTIES - CORPORATE OFFICE (HEIGHTS) $299,900Active3 beds 2 baths1,965 sq. ft.
106 Mockingbird Lane, Bridge City, TX 77611
MLS# 31265148Listed by: AMERICAN REAL ESTATE BEAUMONT $170,000Active4 beds 2 baths1,472 sq. ft.
1370 2nd Street, Vidor, TX 77662
MLS# 19791103Listed by: RED DOOR REALTY & ASSOCIATES $169,000Pending3 beds 2 baths1,419 sq. ft.
321 S 44th Street, Orange, TX 77630
MLS# 25332671Listed by: RE/MAX ONE - PREMIER $425,000Active3 beds 2 baths3,205 sq. ft.
8708 W Fox Road, Orange, TX 77632
MLS# 50259136Listed by: PREMIER PROPERTY GROUP $258,000Active3 beds 2 baths1,400 sq. ft.
865 Dundee, Vidor, TX 77662
MLS# 46450383Listed by: MY CASTLE REALTY $258,495Pending4 beds 2 baths2,032 sq. ft.
5645 Spoonbill, Orange, TX 77632
MLS# 10310660Listed by: D.R. HORTON $214,900Active3 beds 2 baths1,958 sq. ft.
3317 Pelican, Orange, TX 77630
MLS# 28000709Listed by: RE/MAX ONE $75,000Active3 beds 1 baths1,288 sq. ft.
1913 Lincoln Drive, Orange, TX 77630
MLS# 17474993Listed by: RE/MAX SIGNATURE $699,000Active5.43 Acres
5.432 Acres Ih 10, Orange, TX 77630
MLS# 60914100Listed by: AMERICAN REAL ESTATE ORANGE $165,000Pending4 beds 2 baths1,496 sq. ft.
3540 Evangeline Drive, Vidor, TX 77662
MLS# 16244053Listed by: AUSMUS PREMIER PROPERTIES, LLC $189,500Active3 beds 2 baths1,736 sq. ft.
1845 King Arthur Court, Pinehurst, TX 77630
MLS# 9837147Listed by: COLDWELL BANKER SOUTHERN HOMES $12,000Pending0.42 Acres
3530 Evangeline Drive, Vidor, TX 77662
MLS# 87241896Listed by: AUSMUS PREMIER PROPERTIES, LLC $399,900Active4 beds 4 baths4,050 sq. ft.
4712 Frost, Orange, TX 77630
MLS# 6294576Listed by: AMERICAN REAL ESTATE ORANGE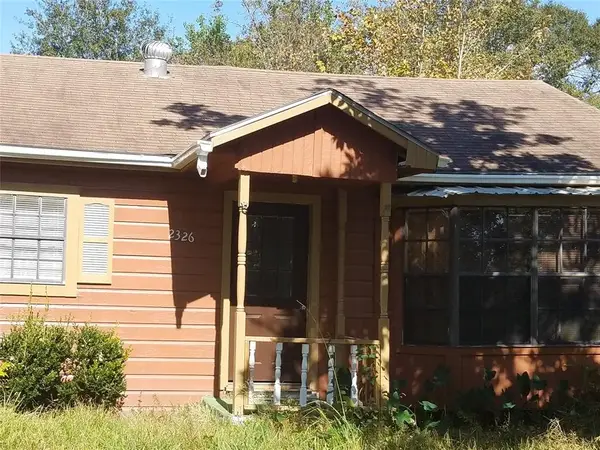 $49,000Active3 beds 2 baths1,457 sq. ft.
2326 Houston Street, Orange, TX 77630
MLS# 37427347Listed by: IDG REALTY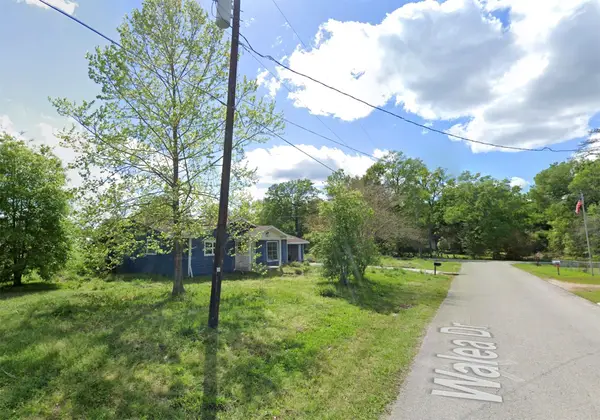 $169,000Active4 beds 2 baths1,554 sq. ft.
4777 Walea Drive, Orange, TX 77632
MLS# 50160892Listed by: IDG REALTY $549,900Active3 beds 3 baths2,789 sq. ft.
510 Country Lane, Bridge City, TX 77611
MLS# 48298606Listed by: AMERICAN REAL ESTATE ORANGE $44,900Active3 beds 2 baths1,368 sq. ft.
3118 Flora Street, Vidor, TX 77662
MLS# 63417151Listed by: COKER REALTY $135,000Active3 beds 1 baths992 sq. ft.
3015 Enner, Orange, TX 77630
MLS# 5107908Listed by: RIVER REALTY $310,000Active4 beds 2 baths2,130 sq. ft.
635 Windmill Way, Vidor, TX 77662
MLS# 38221541Listed by: RE/MAX PRO $187,000Active4 beds 2 baths2,219 sq. ft.
1805 King Arthur Court, Pinehurst, TX 77630
MLS# 68376231Listed by: AMERICAN REAL ESTATE MIDCOUNTY $340,000Pending3 beds 4 baths3,200 sq. ft.
2210 Sunrise Oaks Drive, Orange, TX 77630
MLS# 36139260Listed by: FOREY REAL ESTATE, LLC. $260,990Pending3 beds 2 baths1,848 sq. ft.
18545 Henley Way, Orange, TX 77630
MLS# 80931207Listed by: REGENCY REAL ESTATE PROFESSIONALS $276,990Pending4 beds 3 baths2,092 sq. ft.
18595 Henley Way, Orange, TX 77630
MLS# 95988828Listed by: REGENCY REAL ESTATE PROFESSIONALS $294,000Active2 beds 1 baths2,974 sq. ft.
210 College St, Orange, TX 77630
MLS# 16328494Listed by: CONNECT REALTY.COM $92,000Pending3 Acres
5865 Hudnall Rd, Orange, TX 77632
MLS# 52361841Listed by: CONNECT REALTY.COM $235,000Pending3 beds 3 baths1,636 sq. ft.
3629 Benson Rd, Orange, TX 77632
MLS# 74260366Listed by: CONNECT REALTY.COM $350,000Active4 beds 3 baths3,009 sq. ft.
3331 Aster St, Orange, TX 77632
MLS# 29606579Listed by: CONNECT REALTY.COM $184,900Active3 beds 2 baths1,586 sq. ft.
370 W Bolivar Street, Vidor, TX 77662
MLS# 75033529Listed by: ADVANTAGE REAL ESTATE $259,900Active3 beds 2 baths2,318 sq. ft.
29 Knotty Pine Lane, Orange, TX 77630
MLS# 14392333Listed by: COLDWELL BANKER SOUTHERN HOMES $168,000Active56 Acres
0 Highway 1131, Vidor, TX 77662
MLS# 17307812Listed by: HOMELAND PROPERTIES, INC $247,990Active4 beds 2 baths1,716 sq. ft.
18645 Henley Way, Orange, TX 77630
MLS# 29407434Listed by: REGENCY REAL ESTATE PROFESSIONALS $545,000Active4 beds 4 baths3,320 sq. ft.
405 Pintail Lane, Orange, TX 77630
MLS# 23251701Listed by: LANGE REALTY GROUP $99,900Active3 beds 1 baths1,254 sq. ft.
2309 Bradford Street, Orange, TX 77630
MLS# 44982305Listed by: AMERICAN REAL ESTATE ORANGE $398,400Active150 Acres
T-3 Hwy 1131, Vidor, TX 77662
MLS# 87445699Listed by: HOMELAND PROPERTIES, INC $155,100Active47 Acres
T-2 Hwy 1131, Vidor, TX 77662
MLS# 10079651Listed by: HOMELAND PROPERTIES, INC $283,250Active103 Acres
T-1 Lakeview Road, Vidor, TX 77662
MLS# 13793816Listed by: HOMELAND PROPERTIES, INC $108,500Active31 Acres
T-2 Zavalla Road, Mauriceville, TX 77626
MLS# 38371407Listed by: HOMELAND PROPERTIES, INC $210,000Active60 Acres
T-3 Zavalla Road, Mauriceville, TX 77626
MLS# 70391749Listed by: HOMELAND PROPERTIES, INC $101,500Active29 Acres
T-1 Zavalla Road, Mauriceville, TX 77626
MLS# 94850815Listed by: HOMELAND PROPERTIES, INC $340,000Active4 beds 3 baths2,527 sq. ft.
167 Ridgewood Street, Bridge City, TX 77611
MLS# 30088985Listed by: LANGE REALTY GROUP $104,000Active1 beds 1 baths432 sq. ft.
4312 Western Avenue, West Orange, TX 77630
MLS# 83203020Listed by: JLA REALTY $1,900,000Active3 beds 2 baths2,312 sq. ft.
8021 Highway 12, Orange, TX 77632
MLS# 16670897Listed by: JLA REALTY $31,999Active0.54 Acres
8620 Highway 87 N, Orange, TX 77632
MLS# 21160454Listed by: PLATLABS, LLC $242,045Pending3 beds 2 baths1,656 sq. ft.
6750 Arbor Way, Orange, TX 77630
MLS# 49230458Listed by: REGENCY REAL ESTATE PROFESSIONALS $242,990Pending3 beds 2 baths1,656 sq. ft.
18605 Henley Way, Orange, TX 77630
MLS# 51262477Listed by: REGENCY REAL ESTATE PROFESSIONALS $279,695Pending4 beds 3 baths2,092 sq. ft.
6775 Arbor Way, Orange, TX 77630
MLS# 17769419Listed by: REGENCY REAL ESTATE PROFESSIONALS $89,000Active3 beds 2 baths1,350 sq. ft.
870 W Davis Loop, Vidor, TX 77662
MLS# 45950665Listed by: LANGE REALTY GROUP $268,000Active1.25 Acres
1512 W Park Avenue, Orange, TX 77630
MLS# 68384681Listed by: COLDWELL BANKER SOUTHERN HOMES $268,000Active0.47 Acres
1606 W Park Avenue, Orange, TX 77630
MLS# 75221033Listed by: COLDWELL BANKER SOUTHERN HOMES $281,925Pending3 beds 2 baths1,710 sq. ft.
318 Dove Court, Bridge City, TX 77611
MLS# 83170149Listed by: REGENCY REAL ESTATE PROFESSIONALS $299,945Active4 beds 3 baths1,851 sq. ft.
320 Dove Court, Bridge City, TX 77611
MLS# 85162180Listed by: REGENCY REAL ESTATE PROFESSIONALS $247,500Active3 beds 2 baths1,656 sq. ft.
1265 Little Cypress Loop, Orange, TX 77632
MLS# 357378Listed by: REGENCY REAL ESTATE PROFESSIONALS $261,995Active4 beds 3 baths1,851 sq. ft.
1250 Little Cypress Loop, Orange, TX 77632
MLS# 18228551Listed by: REGENCY REAL ESTATE PROFESSIONALS $252,995Active3 beds 2 baths1,710 sq. ft.
1275 Little Cypress Loop, Orange, TX 77632
MLS# 8058353Listed by: REGENCY REAL ESTATE PROFESSIONALS $262,161Active3 beds 2 baths1,848 sq. ft.
1520 Little Cypress Loop, Orange, TX 77632
MLS# 76176329Listed by: REGENCY REAL ESTATE PROFESSIONALS $279,990Pending4 beds 2 baths1,986 sq. ft.
4785 Little Cypress Loop, Orange, TX 77632
MLS# 36587857Listed by: REGENCY REAL ESTATE PROFESSIONALS $299,900Active4 beds 2 baths2,046 sq. ft.
3513 Allie Payne Road, Orange, TX 77632
MLS# 55044175Listed by: JLA REALTY $330,000Active3 beds 3 baths2,145 sq. ft.
104 Mockingbird Lane, Bridge City, TX 77611
MLS# 1003440Listed by: CORCORAN GENESIS $69,900Active3 beds 2 baths1,558 sq. ft.
4585 Eaves Road, Vidor, TX 77662
MLS# 76661947Listed by: LUXELY REAL ESTATE $199,900Active14.73 Acres
1284 Bobcat Circle, Orange, TX 77632
MLS# 91364240Listed by: RE/MAX PRO $37,000Active4 beds 1 baths1,638 sq. ft.
711 Rein Avenue, Orange, TX 77630
MLS# 94284565Listed by: JLA REALTY $549,900Pending4 beds 4 baths2,594 sq. ft.
21903 Georgia Hackberry Way, Cypress, TX 77433
MLS# 77873657Listed by: PERRY HOMES REALTY, LLC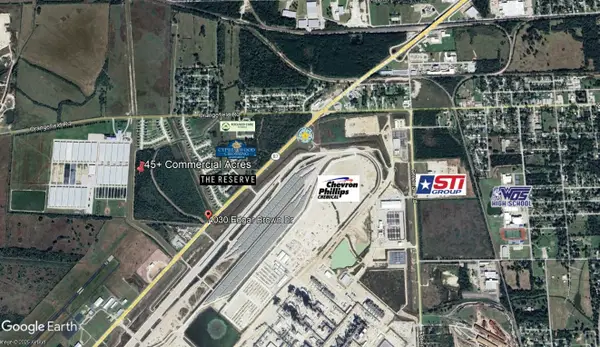 $1,800,000Active47 Acres
4030 Edgar Brown Drive, Orange, TX 77630
MLS# 85950524Listed by: REGENCY REAL ESTATE PROFESSIONALS $115,000Pending2 beds 1 baths1,160 sq. ft.
650 Center Street, Orange, TX 77630
MLS# 5107546Listed by: RIVER REALTY $145,000Active3 beds 2 baths1,566 sq. ft.
2901 23rd Street, Orange, TX 77630
MLS# 11938182Listed by: EXTENSIVE REALTY GROUP $125,000Active3 beds 1 baths1,272 sq. ft.
2807 Dowling Street, West Orange, TX 77630
MLS# 35562504Listed by: EXTENSIVE REALTY GROUP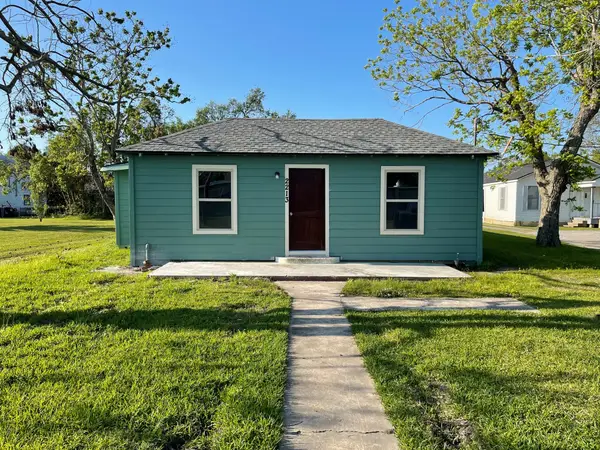 $120,000Active3 beds 2 baths1,230 sq. ft.
2213 Western Avenue, Orange, TX 77630
MLS# 43957223Listed by: EXTENSIVE REALTY GROUP $238,000Pending3 beds 2 baths1,762 sq. ft.
1115 Little Cypress Loop, Orange, TX 77632
MLS# 24724303Listed by: COLDWELL BANKER SOUTHERN HOMES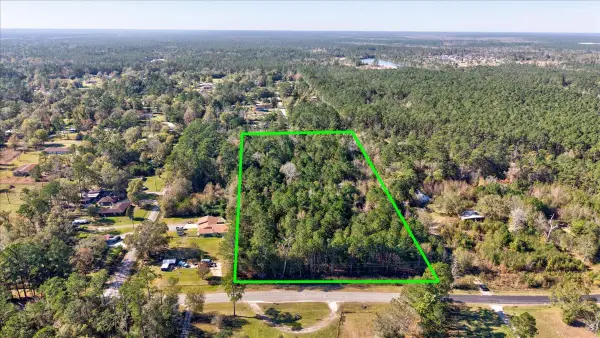 $69,900Pending7 Acres
10545 Old Hwy 87, Orange, TX 77632
MLS# 95538155Listed by: AMERICAN REAL ESTATE ORANGE $345,000Pending3 beds 5 baths2,627 sq. ft.
2810 Chasse Ridge Drive, Orange, TX 77632
MLS# 87182077Listed by: 2011 AMERICAN REAL ESTATE CO. LLC $249,000Active3 beds 2 baths1,792 sq. ft.
3361 Little Cypress Drive, Orange, TX 77632
MLS# 1930644Listed by: RED DOOR REALTY $26,800Active0.48 Acres
1110 N 13th Street, Orange, TX 77630
MLS# 93597809Listed by: HOMESMART $244,065Active3 beds 2 baths1,618 sq. ft.
6895 Arbor Way, Orange, TX 77630
MLS# 13081896Listed by: REGENCY REAL ESTATE PROFESSIONALS $260,000Pending3 beds 2 baths1,702 sq. ft.
193 Donald Street, Bridge City, TX 77611
MLS# 93084646Listed by: JLA REALTY $379,000Active4 beds 2 baths2,356 sq. ft.
186 Poinsetta Street, Bridge City, TX 77611
MLS# 51047489Listed by: AMERICAN REAL ESTATE MIDCOUNTY $34,999Active2 beds 1 baths1,722 sq. ft.
1170 S Timberlane Street, Vidor, TX 77662
MLS# 73594976Listed by: 1ST TEXAS REALTY SERVICES $399,900Active4 beds 2 baths2,261 sq. ft.
621 Pioneer, Bridge City, TX 77611
MLS# 91972622Listed by: RE/MAX ONE $180,000Active11.94 Acres
8370 Queen Lane, Orange, TX 77632
MLS# 3691624Listed by: COLDWELL BANKER SOUTHERN HOMES $15,000Active0.45 Acres
0 Byley Boulevard, Orange, TX 77630
MLS# 10705269Listed by: PATHWAY TO HOME REALTY $8,500Active0.17 Acres
00 South, Orange, TX 77630
MLS# 42167245Listed by: PATHWAY TO HOME REALTY $12,000Active3 Acres
00 Holly Drive, Orange, TX 77630
MLS# 56240466Listed by: PATHWAY TO HOME REALTY $164,000Active3 beds 2 baths1,210 sq. ft.
245 N Clover Street, Bridge City, TX 77611
MLS# 65829963Listed by: COLDWELL BANKER SOUTHERN HOMES $319,000Active3 beds 2 baths2,030 sq. ft.
260 Lawrence Lane, Vidor, TX 77662
MLS# 53678302Listed by: COLDWELL BANKER SOUTHERN HOMES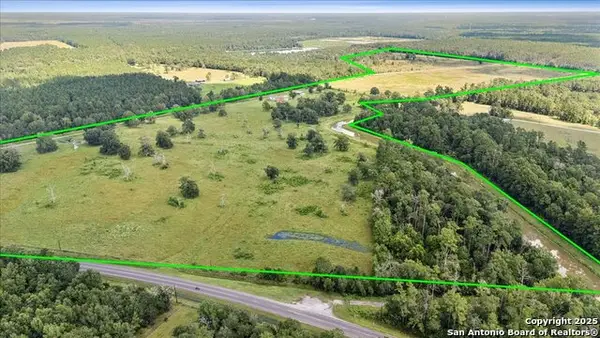 $2,250,000Active3 beds 4 baths4,200 sq. ft.
6900 Meyers Rd, Orange, TX 77632
MLS# 1928961Listed by: RED DOOR REALTY $349,900Active4 beds 3 baths2,750 sq. ft.
2208 Spring Oak Lane, Orange, TX 77632
MLS# 47996998Listed by: COLDWELL BANKER SOUTHERN HOMES $275,000Active3 beds 2 baths996 sq. ft.
3535 Peveto Rd Old, Orange, TX 77632
MLS# 29096472Listed by: EPIQUE REALTY LLC $258,990Pending3 beds 2 baths1,848 sq. ft.
6745 Ashby Way, Orange, TX 77630
MLS# 15539151Listed by: REGENCY REAL ESTATE PROFESSIONALS $257,990Pending3 beds 2 baths1,848 sq. ft.
6810 Arbor Way, Orange, TX 77630
MLS# 11556855Listed by: REGENCY REAL ESTATE PROFESSIONALS $244,990Pending3 beds 2 baths1,656 sq. ft.
1485 Little Cypress Loop, Orange, TX 77632
MLS# 73728068Listed by: REGENCY REAL ESTATE PROFESSIONALS $5,000Active0.08 Acres
1510 N 3rd Street, Orange, TX 77630
MLS# 69757467Listed by: FYI REALTY - HUMBLE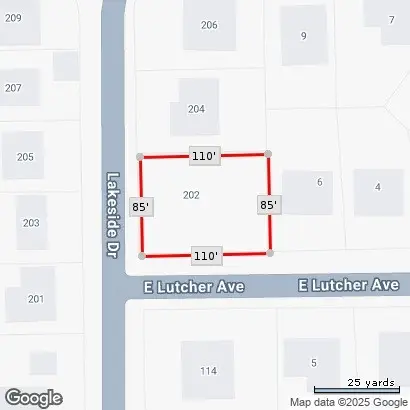 $30,000Active0.2 Acres
202 Lakeside Drive, Orange, TX 77630
MLS# 91854126Listed by: URBAN ACCESS PROPERTIES $139,000Active3 beds 2 baths1,272 sq. ft.
1330 Hwy 1131, Vidor, TX 77662
MLS# 1024219Listed by: CONNECT REALTY.COM $317,593Pending4 beds 2 baths2,204 sq. ft.
319 Finch Court, Bridge City, TX 77611
MLS# 44855302Listed by: REGENCY REAL ESTATE PROFESSIONALS $259,990Pending3 beds 2 baths1,848 sq. ft.
1540 Little Cypress Loop, Orange, TX 77632
MLS# 76770268Listed by: REGENCY REAL ESTATE PROFESSIONALS $124,990Active3 beds 1 baths1,246 sq. ft.
413 Gardenia Avenue, Orange, TX 77630
MLS# 46138654Listed by: NEWFOUND REAL ESTATE $400,000Active5 beds 3 baths
165 Thurman Avenue, Bridge City, TX 77611
MLS# 25288426Listed by: HACIENDA'S REALTY $449,800Active3 beds 2 baths1,076 sq. ft.
5718 Pat Drive, Orange, TX 77630
MLS# 13145221Listed by: COLDWELL BANKER SOUTHERN HOMES $139,900Active2 beds 2 baths1,488 sq. ft.
423 Newton Street, Orange, TX 77630
MLS# 64096332Listed by: 2011 AMERICAN REAL ESTATE CO. LLC $150,000Pending3 beds 2 baths1,224 sq. ft.
3261 Sherwood Drive, Orange, TX 77632
MLS# 37578603Listed by: AMADA AGENCY REAL ESTATE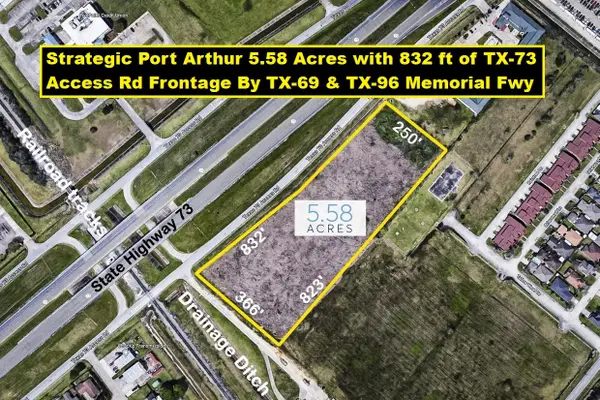 $1,200,000Active5.58 Acres
4400 Highway 73, Port Arthur, TX 77642
MLS# 65448394Listed by: KELLER WILLIAMS REALTY METROPOLITAN $503,900Active4 beds 4 baths2,594 sq. ft.
21927 Georgia Hackberry Way, Cypress, TX 77433
MLS# 34269396Listed by: PERRY HOMES REALTY, LLC $302,535Active3 beds 2 baths1,925 sq. ft.
317 Dove Court, Bridge City, TX 77611
MLS# 16301846Listed by: REGENCY REAL ESTATE PROFESSIONALS $229,900Pending3 beds 2 baths1,808 sq. ft.
6604 Lancaster, Orange, TX 77632
MLS# 59534008Listed by: RE/MAX ONE $169,900Active3 beds 2 baths1,296 sq. ft.
3244 Brent Drive, Orange, TX 77632
MLS# 7696050Listed by: COLDWELL BANKER SOUTHERN HOMES $314,990Pending4 beds 2 baths2,204 sq. ft.
323 Dove Court, Bridge City, TX 77611
MLS# 34673940Listed by: REGENCY REAL ESTATE PROFESSIONALS $139,900Active3 beds 2 baths2,498 sq. ft.
1108 W Park Avenue, Orange, TX 77630
MLS# 89270460Listed by: 2011 AMERICAN REAL ESTATE CO. LLC $99,900Pending2 beds 1 baths766 sq. ft.
865 Turner Drive, Bridge City, TX 77611
MLS# 81937811Listed by: KIRBY SMITH REALTY GROUP $130,000Active2 beds 2 baths
117 Henrietta Street, West Orange, TX 77630
MLS# 35941611Listed by: NB ELITE REALTY $244,900Active3 beds 2 baths1,624 sq. ft.
1470 Little Cypress Loop, Orange, TX 77632
MLS# 21616487Listed by: REGENCY REAL ESTATE PROFESSIONALS $380,000Active4 beds 5 baths4,183 sq. ft.
3805 Huntwick Drive, Orange, TX 77632
MLS# 21755381Listed by: CONNECT REALTY.COM $375,000Pending3 beds 2 baths
3670 Lakeview Cutoff Street, Orange, TX 77662
MLS# 79686070Listed by: LANGE REALTY GROUP $749,900Pending4 beds 3 baths2,979 sq. ft.
130 Peachleaf Drive, Krugerville, TX 76227
MLS# 21163252Listed by: LGI HOMES $211,500Pending4 beds 3 baths2,181 sq. ft.
2725 E Railroad Street, Vidor, TX 77662
MLS# 90611499Listed by: RE/MAX PRO $165,000Active4 beds 2 baths1,382 sq. ft.
1732 Greenbriar Avenue, Orange, TX 77632
MLS# 43895167Listed by: EXTENSIVE REALTY GROUP $55,000Active1.62 Acres
2950 Old Highway 90 E, Vidor, TX 77662
MLS# 13280902Listed by: RE/MAX ONE $125,000Active3 beds 1 baths1,204 sq. ft.
409 Bridal Wreath Avenue, Orange, TX 77630
MLS# 65068226Listed by: EXTENSIVE REALTY GROUP $225,000Active3 beds 3 baths1,500 sq. ft.
4031 Fairview Drive, Orange, TX 77630
MLS# 76046825Listed by: LPT REALTY, LLC $264,091Active3 beds 2 baths1,848 sq. ft.
1295 Little Cypress Loop, Orange, TX 77632
MLS# 32208517Listed by: REGENCY REAL ESTATE PROFESSIONALS $2,250,000Active3 beds 4 baths4,200 sq. ft.
6900 Meyers Rd, Orange, TX 77632
MLS# 1911667Listed by: RED DOOR REALTY $249,900Pending3 beds 3 baths2,088 sq. ft.
11 Regency, Orange, TX 77630
MLS# 1910892Listed by: RED DOOR REALTY $275,000Pending4 beds 2 baths2,736 sq. ft.
1916 W Sunset Drive, Orange, TX 77630
MLS# 64774603Listed by: MARTINDALE REAL ESTATE INVESTMENTS $22,000Pending1 beds 1 baths936 sq. ft.
1245 Rainbow Lane, Vidor, TX 77662
MLS# 59883395Listed by: LPT REALTY, LLC $319,900Active3 beds 3 baths2,618 sq. ft.
6355 Chasse Gardens Drive, Orange, TX 77632
MLS# 89789307Listed by: COLDWELL BANKER SOUTHERN HOMES $200,000Active20.45 Acres
3665 E Railroad, Vidor, TX 77662
MLS# 95759297Listed by: PINNACLE REALTY ADVISORS $199,900Active3 beds 1 baths
13950 Hwy 12, Orange, TX 77632
MLS# 65430249Listed by: COLDWELL BANKER COMMERCIAL ARNOLD AND ASSOCIATES $109,440Pending4 beds 2 baths1,800 sq. ft.
701 Sherrill Street, Orange, TX 77630
MLS# 75786658Listed by: COLDWELL BANKER SOUTHERN HOMES $299,000Pending4 beds 3 baths2,765 sq. ft.
310 Medford Street, Vidor, TX 77662
MLS# 60932607Listed by: RE/MAX ONE $155,900Active3 beds 1 baths1,402 sq. ft.
41 Bruce, Orange, TX 77630
MLS# 40435798Listed by: RE/MAX ONE $134,900Active3 beds 2 baths1,113 sq. ft.
2208 Norwood Drive, Orange, TX 77630
MLS# 57005517Listed by: FATHOM REALTY $69,800Active2 beds 1 baths784 sq. ft.
811 Flint Street, Orange, TX 77630
MLS# 24892686Listed by: COLDWELL BANKER SOUTHERN HOMES $599,900Active4 beds 2 baths3,828 sq. ft.
10885 Fm 1130, Orange, TX 77632
MLS# 40334101Listed by: RE/MAX ONE $9,750,000Active216 Acres
TBD Neches River Drive, Orange, TX 77651
MLS# 21038606Listed by: KELLER WILLIAMS REALTY $499,900Active4 beds 2 baths3,680 sq. ft.
9010 Terry Estates Drive, Orange, TX 77630
MLS# 84441367Listed by: COLDWELL BANKER SOUTHERN HOMES $165,000Pending3 beds 2 baths1,680 sq. ft.
5442 Woodland Drive, Orange, TX 77632
MLS# 43588422Listed by: KELLER WILLIAMS SUMMIT $299,900Active27.8 Acres
00 Rebel, Vidor, TX 77662
MLS# 10862125Listed by: RE/MAX PRO $69,900Active3 beds 1 baths1,034 sq. ft.
3656 Hemlock St, Orange, TX 77630
MLS# 73853621Listed by: RE/MAX ONE $262,095Active4 beds 2 baths1,906 sq. ft.
6770 Arbor Way, Orange, TX 77630
MLS# 11516479Listed by: REGENCY REAL ESTATE PROFESSIONALS $119,000Active3 beds 2 baths1,324 sq. ft.
2325 Butler Drive, Orange, TX 77630
MLS# 18739771Listed by: DAVID BROWN PROPERTIES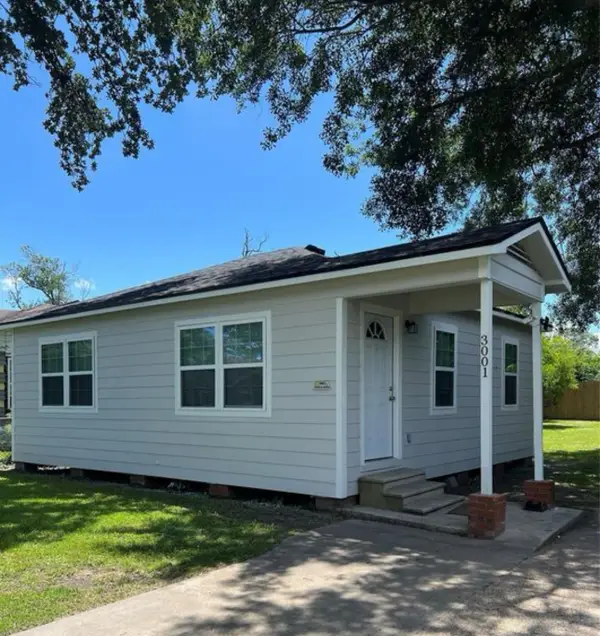 $139,000Active2 beds 1 baths672 sq. ft.
3001 Austin Street, Orange, TX 77630
MLS# 85478097Listed by: COLDWELL BANKER SOUTHERN HOMES $227,990Pending3 beds 2 baths1,409 sq. ft.
3420 Canvasback, Orange, TX 77632
MLS# 63861527Listed by: D.R. HORTON $227,990Pending3 beds 2 baths1,409 sq. ft.
5655 Spoonbill, Orange, TX 77632
MLS# 4061176Listed by: D.R. HORTON $180,000Active4 beds 3 baths4,543 sq. ft.
8265 Maple Street, Orange, TX 77632
MLS# 50806671Listed by: WALZEL PROPERTIES - CORPORATE OFFICE- $119,900Pending2 beds 2 baths1,482 sq. ft.
1802 29th Street, Orange, TX 77630
MLS# 70202179Listed by: 2011 AMERICAN REAL ESTATE CO. LLC  $295,000Pending4 beds 2 baths2,623 sq. ft.
425 Lawrence Lane, Vidor, TX 77662
MLS# 94600081Listed by: RE/MAX PRO $125,249Active3 beds 2 baths1,412 sq. ft.
270 Triangle Drive, Vidor, TX 77662
MLS# 52001889Listed by: 1ST TEXAS REALTY SERVICES $23,000Active0.17 Acres
6 Regency Place, Orange, TX 77630
MLS# 36987846Listed by: JLA REALTY $224,900Pending3 beds 2 baths1,871 sq. ft.
3042 Parish Cemetery Road, Orange, TX 77632
MLS# 43665063Listed by: AMERICAN REAL ESTATE ORANGE $220,000Active4 beds 2 baths1,861 sq. ft.
160 E Darby Street, Bridge City, TX 77611
MLS# 93894123Listed by: IDG REALTY $253,995Active3 beds 2 baths1,765 sq. ft.
6740 Arbor Way, Orange, TX 77630
MLS# 12696522Listed by: REGENCY REAL ESTATE PROFESSIONALS $299,500Pending3 beds 3 baths2,640 sq. ft.
5250 Highlander Drive, Orange, TX 77630
MLS# 51963104Listed by: HOMESMART $289,500Active3 beds 3 baths2,545 sq. ft.
5270 Highlander Drive, Orange, TX 77630
MLS# 79909869Listed by: HOMESMART $150,000Active7.9 Acres
0000 E Round Bunch Road, Bridge City, TX 77611
MLS# 70399764Listed by: BRAND REALTY, LLC $274,990Pending4 beds 2 baths1,778 sq. ft.
5710 Canvasback Drive, Orange, TX 77632
MLS# 45405437Listed by: TURNER MANGUM,LLC $69,999Active4.96 Acres
195 Greathouse Street, Vidor, TX 77662
MLS# 35401793Listed by: 1ST TEXAS REALTY SERVICES $161,499Active3 beds 2 baths1,121 sq. ft.
718 Westbury Street, West Orange, TX 77630
MLS# 40065088Listed by: 1ST TEXAS REALTY SERVICES $69,999Active2 beds 2 baths902 sq. ft.
911 7th Street, Orange, TX 77630
MLS# 75656704Listed by: 1ST TEXAS REALTY SERVICES $125,000Active3 beds 1 baths1,360 sq. ft.
3615 Edgemont, Orange, TX 77630
MLS# 5269930Listed by: PREMIER HAUS REALTY, LLC $230,910Pending4 beds 2 baths1,778 sq. ft.
3365 Mallard Lake, Orange, TX 77632
MLS# 77323323Listed by: TURNER MANGUM,LLC $2,300,000Active3 beds -- baths
306-308 Old Timers Road, Orange, TX 77630
MLS# 10436115Listed by: EXP REALTY LLC $29,999Active0.52 Acres
0 Eva Street, Orange, TX 77632
MLS# 62834321Listed by: SACHIN JAIN $165,000Active3 beds 2 baths1,691 sq. ft.
2017 5th Street, Orange, TX 77630
MLS# 15173078Listed by: REAL BROKER, LLC $784,800Active5 beds 6 baths5,926 sq. ft.
145 Greenhead Point Drive, Orange, TX 77630
MLS# 64060254Listed by: COLDWELL BANKER SOUTHERN HOMES $37,049Pending1.54 Acres
0 School Road, Vidor, TX 77662
MLS# 75181290Listed by: 1ST TEXAS REALTY SERVICES $674,900Active5 beds 5 baths4,368 sq. ft.
302 Waterwood Drive, Orange, TX 77630
MLS# 29950457Listed by: COLDWELL BANKER SOUTHERN HOMES $109,649Active3 beds 2 baths1,734 sq. ft.
2890 Fm 1131, Vidor, TX 77662
MLS# 45471482Listed by: 1ST TEXAS REALTY SERVICES $151,499Active2 beds 2 baths2,181 sq. ft.
422 Texla Road, Vidor, TX 77662
MLS# 24840513Listed by: 1ST TEXAS REALTY SERVICES $151,499Active3 beds 2 baths1,509 sq. ft.
5403 Old State Hwy 87, Orange, TX 77632
MLS# 82046310Listed by: 1ST TEXAS REALTY SERVICES $49,149Active0 Acres
0 Caney Creek, Vidor, TX 77662
MLS# 68221369Listed by: 1ST TEXAS REALTY SERVICES $31,999Active0.83 Acres
1900 Link Avenue, Orange, TX 77630
MLS# 59516465Listed by: 1ST TEXAS REALTY SERVICES $47,499Active0.87 Acres
785 Young Street, Bridge City, TX 77611
MLS# 16331390Listed by: 1ST TEXAS REALTY SERVICES $108,149Active3.74 Acres
8105 Kestrel Road, Orange, TX 77632
MLS# 85749946Listed by: 1ST TEXAS REALTY SERVICES $34,900Active1.24 Acres
1.24 ac Circle 5, Orange, TX 77632
MLS# 9165048Listed by: 2011 AMERICAN REAL ESTATE CO. LLC $16,500Active0.34 Acres
0 Paricia Street, Orange, TX 77632
MLS# 77237528Listed by: BEYCOME BROKERAGE REALTY, LLC $75,000Active0 Acres
4029 W Roundbunch Road, Orange, TX 77632
MLS# 22354542Listed by: COLDWELL BANKER SOUTHERN HOMES $1,613,700Active489 Acres
0 Highway 12/ Linscomb Road, Vidor, TX 77662
MLS# 24059808Listed by: HOMELAND PROPERTIES, INC $49,000Pending5 beds 3 baths2,429 sq. ft.
720 Birch, Vidor, TX 77662
MLS# 5106247Listed by: SOUTHEAST TEXAS 1ST REALTY $339,900Active4 beds 2 baths3,047 sq. ft.
6401 Steeple Chasse Drive, Orange, TX 77632
MLS# 14965751Listed by: AMERICAN REAL ESTATE ORANGE $44,500Pending2 beds 1 baths900 sq. ft.
9221 Oliver Road, Orange, TX 77632
MLS# 5105223Listed by: SOUTHEAST TEXAS 1ST REALTY $220,435Pending3 beds 2 baths1,409 sq. ft.
5650 Wood Duck Drive, Orange, TX 77632
MLS# 35546385Listed by: TURNER MANGUM,LLC $275,000Active6 beds 3 baths3,194 sq. ft.
2800 Country Club Drive, Orange, TX 77630
MLS# 66194145Listed by: IDG REALTY $110,000Active3 beds 1 baths1,533 sq. ft.
510 W Decatur Avenue, Orange, TX 77630
MLS# 94884058Listed by: IDG REALTY $110,000Active3 beds 1 baths1,038 sq. ft.
1112 8th Street #A, Orange, TX 77630
MLS# 34046038Listed by: KELLER WILLIAMS ADVANTAGE REALTY $75,000Active0.3 Acres
445 Blueberry Street, Bridge City, TX 77611
MLS# 57102068Listed by: REALTY AMERICA INC. $75,000Active0.44 Acres
435 Blueberry Street, Bridge City, TX 77611
MLS# 79879057Listed by: REALTY AMERICA INC. $174,000Active3 beds 2 baths1,320 sq. ft.
9743 Westbend, Orange, TX 77632
MLS# 26921598Listed by: IDG REALTY $28,999Active3 beds 2 baths1,571 sq. ft.
2241 Cross Lane, Orange, TX 77630
MLS# 14690392Listed by: 1ST TEXAS REALTY SERVICES $47,999Active2 beds 1 baths1,704 sq. ft.
2006 2nd Street, Orange, TX 77630
MLS# 5937024Listed by: 1ST TEXAS REALTY SERVICES $119,874Active3 beds 2 baths1,767 sq. ft.
4401 Kitty Chapin Avenue, Orange, TX 77632
MLS# 64993866Listed by: 1ST TEXAS REALTY SERVICES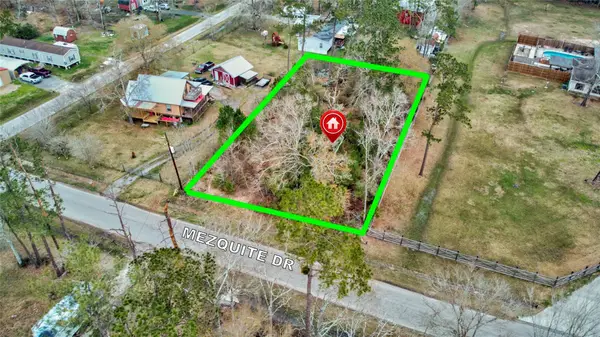 $29,900Pending0.46 Acres
5948 Mesquite Drive, Orange, TX 77632
MLS# 55628772Listed by: VIVE REALTY LLC $190,000Active3 beds 2 baths1,578 sq. ft.
416 Nancy Drive, Bridge City, TX 77611
MLS# 25480365Listed by: IDG REALTY $232,050Active39 Acres
2 Fm 2802, Vidor, TX 77662
MLS# 19532112Listed by: HOMELAND PROPERTIES, INC $232,050Active39 Acres
1 Fm 2802, Vidor, TX 77662
MLS# 49148617Listed by: HOMELAND PROPERTIES, INC $74,900Active8.27 Acres
000 Thurman Ave, Bridge City, TX 77611
MLS# 79178257Listed by: KIRBY SMITH REALTY GROUP $199,900Active16.5 Acres
2303 Duhon, Orange, TX 77632
MLS# 13541575Listed by: RE/MAX ONE $41,799Active0.54 Acres
1150 S Timberlane Street, Vidor, TX 77662
MLS# 85316613Listed by: 1ST TEXAS REALTY SERVICES $99,499Active3 beds 2 baths1,668 sq. ft.
3960 Hale Street, Vidor, TX 77662
MLS# 25048042Listed by: 1ST TEXAS REALTY SERVICES $1,798,500Active545 Acres
0 Fm 1136, Orange, TX 77632
MLS# 41364226Listed by: HOMELAND PROPERTIES, INC $536,250Active195 Acres
0 Fm 1132, Vidor, TX 77662
MLS# 93970706Listed by: HOMELAND PROPERTIES, INC $1,023,000Active310 Acres
0 Ellis Lane, Vidor, TX 77662
MLS# 55361633Listed by: HOMELAND PROPERTIES, INC $216,630Pending3 beds 2 baths1,409 sq. ft.
5695 Wood Duck Drive, Orange, TX 77632
MLS# 4056123Listed by: D.R. HORTON $23,500Pending0.47 Acres
6386 Mesquite, Orange, TX 77632
MLS# 10133532Listed by: RE/MAX ONE $149,900Active3 beds 2 baths1,595 sq. ft.
9108 Highway 87 N #OLD, Orange, TX 77632
MLS# 22285050Listed by: LAS LOMAS REALTY ELITE $45,999Active3 beds 2 baths1,655 sq. ft.
7128 Panther Run, Orange, TX 77632
MLS# 73045575Listed by: 1ST TEXAS REALTY SERVICES $63,555Active3.62 Acres
2651 Claire Drive, Orange, TX 77630
MLS# 38621130Listed by: 1ST TEXAS REALTY SERVICES $59,349Active3 beds 1 baths948 sq. ft.
803 Chester Street, West Orange, TX 77630
MLS# 48599147Listed by: 1ST TEXAS REALTY SERVICES $24,000Active1 Acres
00 Cleo, Orange, TX 77632
MLS# 85879075Listed by: RED DOOR REALTY & ASSOCIATES
Local realty services provided by:CENTURY 21 Lucky Money Real Estate, CENTURY 21 Judge Fite Company, CENTURY 21 Gold Coat Realtors, CENTURY 21 Cota Realty
Copyright 2026, Houston Realtors Information Service, Inc. All information provided is deemed reliable but is not guaranteed and should be independently verified. IDX information is provided exclusively for consumers' personal, non-commercial use, it may not be used for any purpose other than to identify prospective properties consumers may be interested in purchasing, and the data is deemed reliable but is not guaranteed accurate by the MLS.
Information provided, in part, by North Texas Real Estate Information Systems, Inc. Last Updated March 31, 2026 Listings with the NTREIS logo are listed by brokerages other than CENTURY 21 Gold Coat Realtors.
Popular searches near Orange County, TX
Popular neighborhoods near Orange County, TX
- Acorn, Beaumont homes for sale
- Averill, Beaumont homes for sale
- Beverly Hills, Sulphur homes for sale
- Cable, Beaumont homes for sale
- Calder Place, Beaumont homes for sale
- Caldwood Ana, Beaumont homes for sale
- Charlton Pollard, Beaumont homes for sale
- College Corridor, Beaumont homes for sale
- Dowlen West, Beaumont homes for sale
- Gold Hill, Beaumont homes for sale
- Graywood, Lake Charles homes for sale
- Hidden Valley, Beaumont homes for sale
- Maplewood, Sulphur homes for sale
- MLK, Beaumont homes for sale
- North End, Beaumont homes for sale
- Pinecrest, Beaumont homes for sale
- Stonegate Manor, Port Arthur homes for sale
- The Old Town Oaks, Beaumont homes for sale
- Willow Creek, Beaumont homes for sale
- Woodland Acres, Beaumont homes for sale
Zip codes near Orange County, TX
- 70631 homes for sale
- 70668 homes for sale
- 77611 homes for sale
- 77615 homes for sale
- 77619 homes for sale
- 77627 homes for sale
- 77630 homes for sale
- 77632 homes for sale
- 77640 homes for sale
- 77642 homes for sale
- 77651 homes for sale
- 77657 homes for sale
- 77662 homes for sale
- 77701 homes for sale
- 77702 homes for sale
- 77703 homes for sale
- 77705 homes for sale
- 77706 homes for sale
- 77707 homes for sale
- 77708 homes for sale
Protect your home and budget from life's surprises with an Assurant Home Warranty, backed by a partner that supports you through every step of homeownership. Explore Plans.
©2026 Century 21 Real Estate LLC. All rights reserved. CENTURY 21®, the CENTURY 21 Logo and C21® are service marks owned by Century 21 Real Estate LLC. Century 21 Real Estate LLC fully supports the principles of the Fair Housing Act and the Equal Opportunity Act. Each office is independently owned and operated. Listing information is deemed reliable but not guaranteed accurate.