- Barnstable homes for sale
- Barnstable Town homes for sale
- Centerville homes for sale
- Cotuit homes for sale
- East Falmouth homes for sale
- East Sandwich homes for sale
- Forestdale homes for sale
- Hyannis homes for sale
- Hyannis Port homes for sale
- Marstons Mills homes for sale
- Mashpee homes for sale
- Mashpee Neck homes for sale
- New Seabury homes for sale
- Osterville homes for sale
- Sandwich town homes for sale
- Seabrook homes for sale
- South Yarmouth homes for sale
- West Barnstable homes for sale
- West Yarmouth homes for sale
- Yarmouth homes for sale
02655, MA - homes for sale
51 of 51 results displayed
 $3,100,000Pending4 beds 5 baths2,752 sq. ft.
125 Wianno Circle, Osterville, MA 02655
MLS# 22601054Listed by: SOTHEBY'S INTERNATIONAL REALTY- Open Sat, 12 to 1:30pmNew
 $949,900Active3 beds 3 baths2,050 sq. ft.
177 Bayview Circle, Osterville, MA 02655
MLS# 22601044Listed by: BERKSHIRE HATHAWAY HOMESERVICES ROBERT PAUL PROPERTIES - New
 $1,600,000Active3 beds 3 baths2,459 sq. ft.
92 Wianno Circle, Osterville, MA 02655
MLS# 22601032Listed by: NEW SEABURY SOTHEBY'S INTERNATIONAL REALTY - New
 $995,000Active3 beds 3 baths2,000 sq. ft.
60 Linden Lane, Barnstable, MA 02655
MLS# 73492826Listed by: Kinlin Grover Compass  $1,175,000Pending3 beds 3 baths1,775 sq. ft.
48 Bayview Circle, Osterville, MA 02655
MLS# 22601016Listed by: KINLIN GROVER COMPASS- New
 $1,175,000Active3 beds 3 baths1,775 sq. ft.
48 Bayview Cir, Barnstable, MA 02655
MLS# 73492618Listed by: Kinlin Grover Compass - New
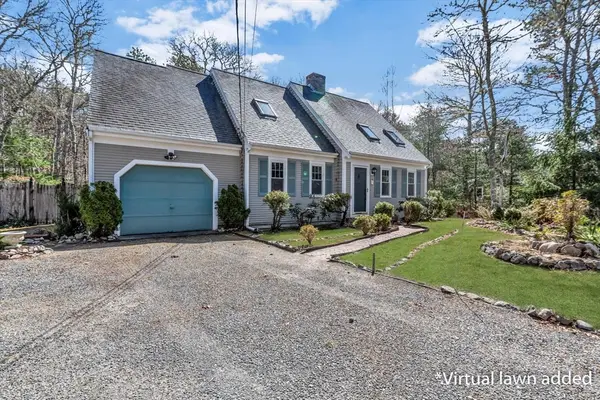 $875,000Active3 beds 2 baths1,497 sq. ft.
5 Briar Patch Rd, Barnstable, MA 02655
MLS# 73492454Listed by: Berkshire Hathaway HomeServices Robert Paul Properties - Open Sat, 11am to 1pmNew
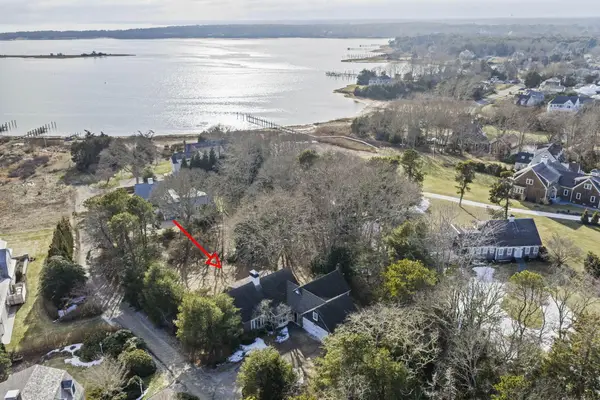 $2,999,000Active3 beds 3 baths3,055 sq. ft.
18 Winfield Lane, Osterville, MA 02655
MLS# 22600993Listed by: SILVERSTONE CAPESIDE REALTY GROUP  $835,000Pending2 beds 2 baths1,667 sq. ft.
64 Falling Leaf Lane, Osterville, MA 02655
MLS# 22600855Listed by: SOTHEBY'S INTERNATIONAL REALTY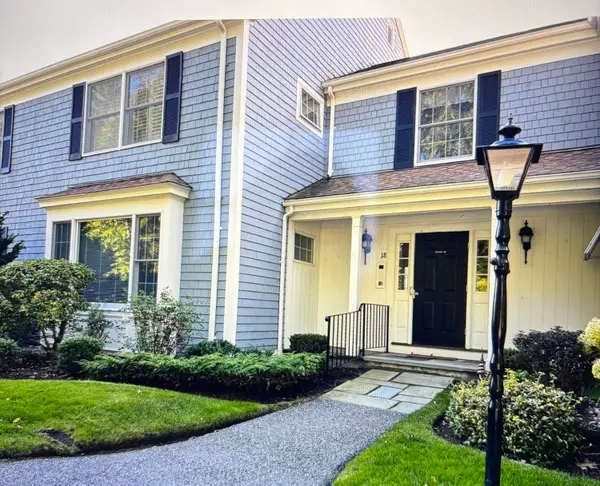 $659,000Pending2 beds 2 baths1,278 sq. ft.
39 Tower Hill Road, Osterville, MA 02655
MLS# 22600901Listed by: THE FOLEY COMPANY $2,200,000Pending3 beds 4 baths3,118 sq. ft.
199 E Bay Road, Osterville, MA 02655
MLS# 22600859Listed by: BERKSHIRE HATHAWAY HOMESERVICES ROBERT PAUL PROPERTIES- Open Sat, 11am to 1pm
 $3,100,000Active3 beds 4 baths5,008 sq. ft.
34 Farm Valley Road, Osterville, MA 02655
MLS# 22600746Listed by: WILLIAM RAVEIS REAL ESTATE & HOME SERVICES 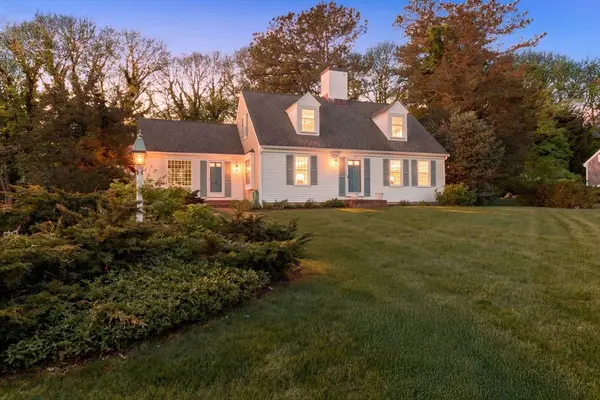 $1,195,000Active3 beds 2 baths1,740 sq. ft.
53 Spice Ln, Barnstable, MA 02655
MLS# 73487219Listed by: Compass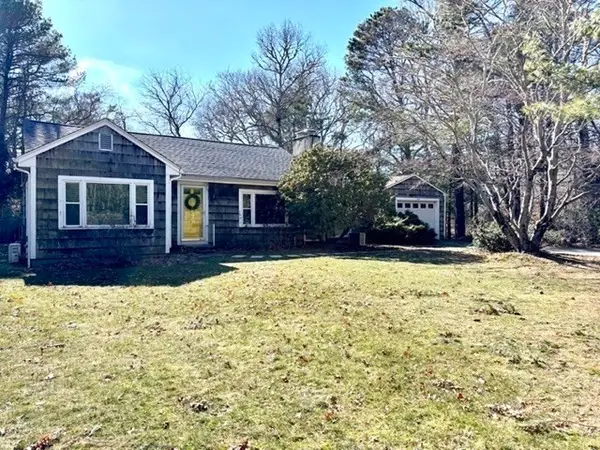 $744,900Active3 beds 1 baths1,008 sq. ft.
351 Swift Ave, Barnstable, MA 02655
MLS# 73487320Listed by: EXIT Cape Realty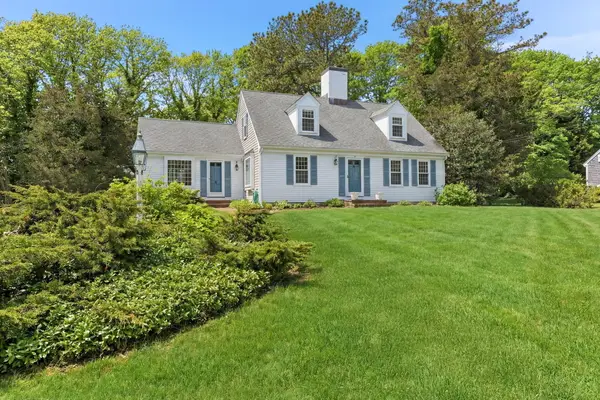 $1,195,000Pending3 beds 2 baths1,740 sq. ft.
53 Spice Lane, Osterville, MA 02655
MLS# 22600764Listed by: COMPASS MASSACHUSETTS, LLC $3,499,999Active10 beds 8 baths6,905 sq. ft.
414 Eel, Barnstable, MA 02655
MLS# 73486853Listed by: SMP Real Estate Investments and Development Co.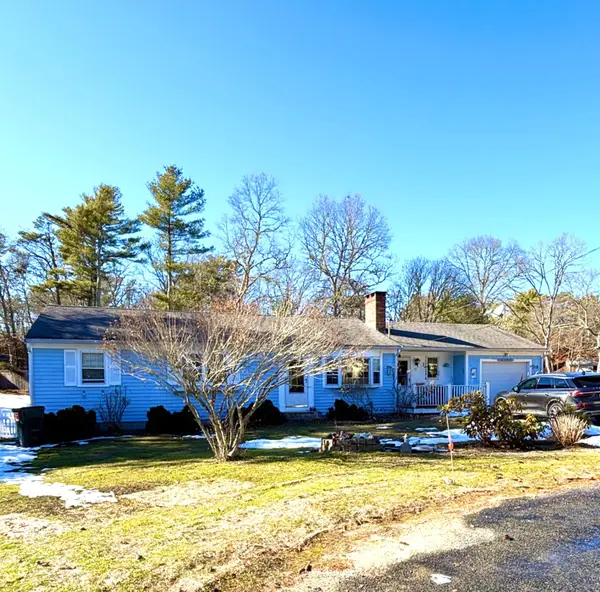 $599,000Pending3 beds 3 baths1,940 sq. ft.
31 Galahad Circle, Osterville, MA 02655
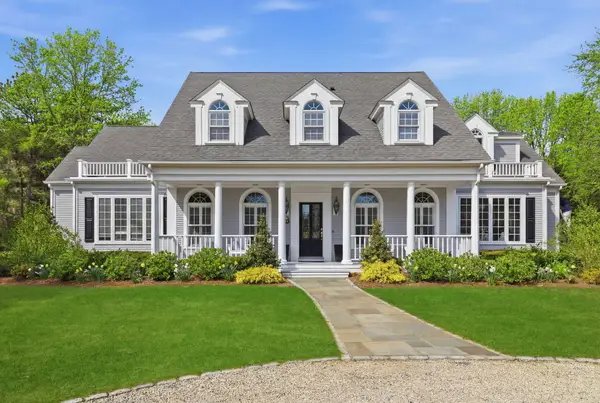
MLS# 22600677Listed by: TODAY REAL ESTATE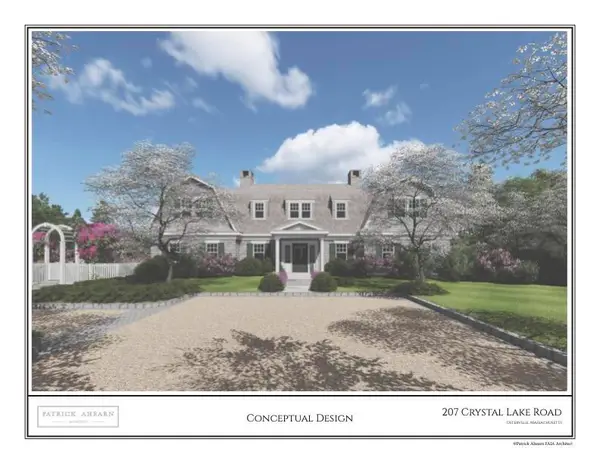 $8,750,000Active8 beds 6 baths6,500 sq. ft.
207 Crystal Lake Road, Osterville, MA 02655
MLS# 22600636Listed by: FRANK A SULLIVAN REAL ESTATE $1,095,000Active2 beds 3 baths1,564 sq. ft.
16 Second Ave #4, Barnstable, MA 02655
MLS# 73473486Listed by: Compass $1,095,000Active2 beds 3 baths1,564 sq. ft.
16 Second Avenue, Osterville, MA 02655
MLS# 22600296Listed by: COMPASS MASSACHUSETTS, LLC $1,950,000Pending4 beds 4 baths2,999 sq. ft.
67 Fire Station Road, Osterville, MA 02655
MLS# 22600241Listed by: WILLIAM RAVEIS REAL ESTATE & HOME SERVICES $599,900Pending2 beds 2 baths1,320 sq. ft.
39 Blossom Avenue, Osterville, MA 02655
MLS# 22600198Listed by: GREER REAL ESTATE, LLC $2,650,000Active3 beds 4 baths2,696 sq. ft.
146 Scudder Rd, Barnstable, MA 02655
MLS# 73470550Listed by: Sotheby's International Realty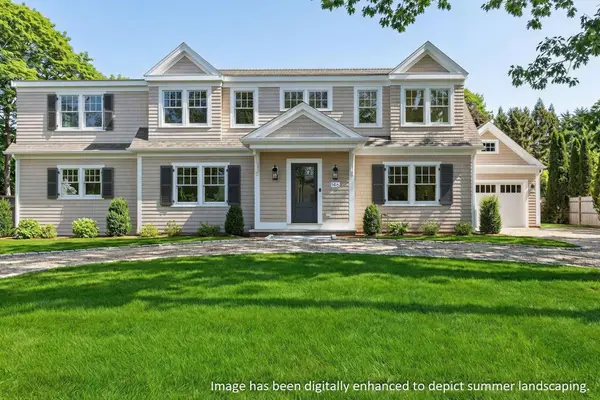 $2,650,000Active3 beds 4 baths2,650 sq. ft.
146 Scudder Road, Osterville, MA 02655
MLS# 22600195Listed by: SOTHEBY'S INTERNATIONAL REALTY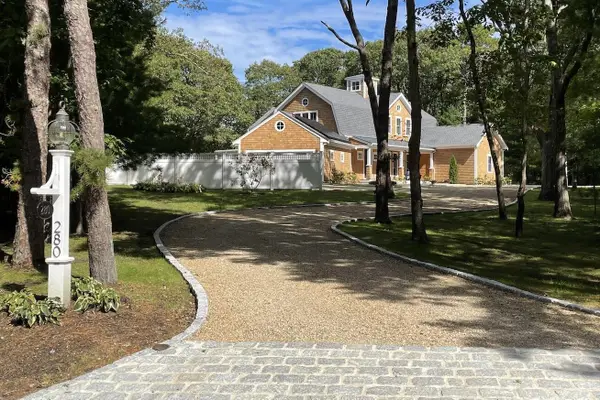 $4,595,000Active4 beds 7 baths3,557 sq. ft.
280 Ice Valley Road, Osterville, MA 02655
MLS# 22600029Listed by: BERKSHIRE HATHAWAY HOMESERVICES ROBERT PAUL PROPERTIES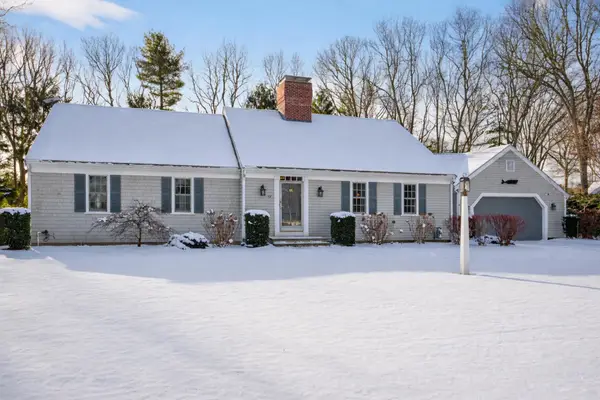 $1,595,000Pending3 beds 2 baths1,872 sq. ft.
117 Parsley Lane, Osterville, MA 02655
MLS# 22600042Listed by: SOTHEBY'S INTERNATIONAL REALTY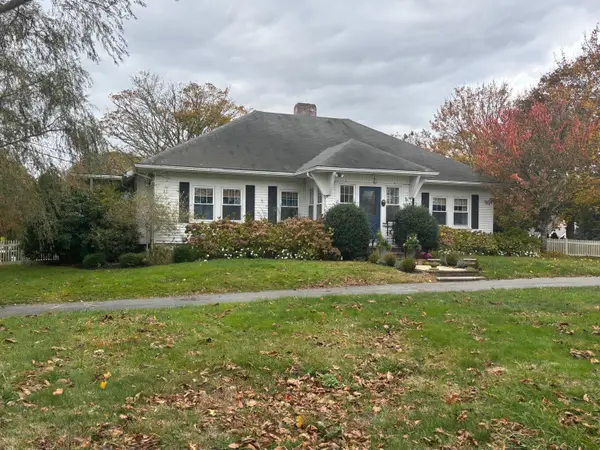 $1,599,000Pending3 beds 3 baths1,686 sq. ft.
33 Sunset Lane, Osterville, MA 02655
MLS# 22505728Listed by: KINLIN GROVER COMPASS $1,100,000Active4 beds 2 baths1,775 sq. ft.
40 Waterfield Road, Osterville, MA 02655
MLS# 22505336Listed by: KELLER WILLIAMS REALTY $649,000Pending3 beds 2 baths1,152 sq. ft.
369 Bumps River Road, Osterville, MA 02655
MLS# 22505019Listed by: KELLER WILLIAMS REALTY $615,000Pending2 beds 2 baths1,150 sq. ft.
920 Main Street, Osterville, MA 02655
MLS# 22504517Listed by: KELLER WILLIAMS REALTY $7,950,000Active8 beds 9 baths7,350 sq. ft.
850 Sea View Avenue, Osterville, MA 02655
MLS# 22504438Listed by: SOTHEBY'S INTERNATIONAL REALTY $1,349,000Active4 beds 3 baths2,326 sq. ft.
77 Robbins St, Barnstable, MA 02655
MLS# 73426806Listed by: Berkshire Hathaway HomeServices Robert Paul Properties $9,850,000Active5 beds 5 baths3,087 sq. ft.
14 Indian Trail, Osterville, MA 02655
MLS# 22503092Listed by: BERKSHIRE HATHAWAY HOMESERVICES ROBERT PAUL PROPERTIES $7,750,000Active7 beds 11 baths11,546 sq. ft.
440 Grand Island Dr, Barnstable, MA 02655
MLS# 73383981Listed by: Berkshire Hathaway HomeServices Robert Paul Properties $7,750,000Active7 beds 11 baths11,546 sq. ft.
440 Grand Island Drive, Osterville, MA 02655
MLS# 22502682Listed by: BERKSHIRE HATHAWAY HOMESERVICES ROBERT PAUL PROPERTIES $3,100,000Active2.3 Acres
Lot 288 Seapuit River Rd A, Barnstable, MA 02655
MLS# 73379751Listed by: Berkshire Hathaway HomeServices Robert Paul Properties $3,000,000Active2.08 Acres
Lot 289 Seapuit River Road B, Barnstable, MA 02655
MLS# 73379752Listed by: Berkshire Hathaway HomeServices Robert Paul Properties $3,125,000Active2.01 Acres
Lot 290 0 Indian Trail, Barnstable, MA 02655
MLS# 73379753Listed by: Berkshire Hathaway HomeServices Robert Paul Properties $3,100,000Active2.3 Acres
Lot 288 Seapuit River A Road, Osterville, MA 02655
MLS# 22502532Listed by: BERKSHIRE HATHAWAY HOMESERVICES ROBERT PAUL PROPERTIES $3,000,000Active2.08 Acres
Lot 289 Seapuit River B Road, Osterville, MA 02655
MLS# 22502533Listed by: BERKSHIRE HATHAWAY HOMESERVICES ROBERT PAUL PROPERTIES $3,125,000Active2.01 Acres
Lot 290 0 Indian Trail, Osterville, MA 02655
MLS# 22502535Listed by: BERKSHIRE HATHAWAY HOMESERVICES ROBERT PAUL PROPERTIES $2,395,000Active3 beds 2 baths1,194 sq. ft.
51 Wianno Circle, Osterville, MA 02655
MLS# 22502488Listed by: SOTHEBY'S INTERNATIONAL REALTY $8,995,000Active5 beds 6 baths7,565 sq. ft.
168 Garrison Lane, Osterville, MA 02655
MLS# 22505080Listed by: BERKSHIRE HATHAWAY HOMESERVICES ROBERT PAUL PROPERTIES $12,250,000Active5 beds 6 baths5,747 sq. ft.
71 Sand Pt, Barnstable, MA 02655
MLS# 73342640Listed by: Berkshire Hathaway HomeServices Robert Paul Properties $12,250,000Active5 beds 6 baths5,747 sq. ft.
71 Sand Point, Osterville, MA 02655
MLS# 22500873Listed by: BERKSHIRE HATHAWAY HOMESERVICES ROBERT PAUL PROPERTIES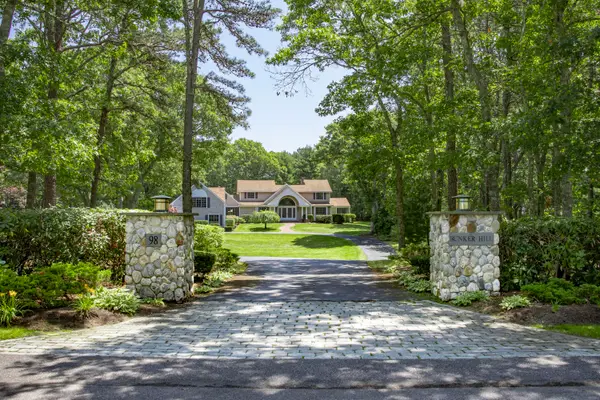 $2,879,000Pending5 beds 5 baths4,715 sq. ft.
98 Bunker Hill Road, Osterville, MA 02655
MLS# 22500407Listed by: FRANK A SULLIVAN REAL ESTATE $9,950,000Active6 beds 9 baths8,203 sq. ft.
501 Eel River Road, Osterville, MA 02655
MLS# 22404283Listed by: BERKSHIRE HATHAWAY HOMESERVICES ROBERT PAUL PROPERTIES $3,499,999Active10 beds 8 baths6,905 sq. ft.
414 Eel River Road, Osterville, MA 02655
MLS# 22600750Listed by: SMP REALTY DEVELOPMENT CO. LLC $679,000Active3 beds 2 baths1,284 sq. ft.
9 Gunstock Rd, Barnstable, MA 02655
MLS# 73178426Listed by: Berkshire Hathaway HomeServices Robert Paul Properties $8,850,000Active4 beds 5 baths3,877 sq. ft.
200 North Bay, Barnstable, MA 02655
MLS# 73156550Listed by: LandVest, Inc. $3,250,000Active2.45 Acres
30 Indian Trail, Osterville, MA 02655
MLS# 22502536Listed by: BERKSHIRE HATHAWAY HOMESERVICES ROBERT PAUL PROPERTIES
Local realty services provided by:CENTURY 21 North East, CENTURY 21 Shawmut Properties
Popular searches near 02655
Popular neighborhoods near 02655
- Blackstone, Providence homes for sale
- Cape Cod and Islands, Cotuit homes for sale
- Darlington, Pawtucket homes for sale
- East Side, Providence homes for sale
- Edgewood, Providence homes for sale
- Fox Point, Providence homes for sale
- Lower Main Street, Hingham homes for sale
- Main Street, Hingham homes for sale
- Oak Hill, Pawtucket homes for sale
- Pine Crest, Pawtucket homes for sale
- Pleasant View, Pawtucket homes for sale
- Quality Hill, Pawtucket homes for sale
- South Coast, New Bedford homes for sale
- South Elmwood, Providence homes for sale
- South Shore, Duxbury homes for sale
- The Pinehills, Plymouth homes for sale
- The Ridge at the Pinehills, Plymouth homes for sale
- Upper Main Street, Hingham homes for sale
- Washington Park, Providence homes for sale
- Wayland, Providence homes for sale
Counties near Osterville, 02655
- Barnstable County homes for sale
- Bristol County homes for sale
- Bristol County homes for sale
- Dukes County homes for sale
- Essex County homes for sale
- Kent County homes for sale
- Middlesex County homes for sale
- Nantucket County homes for sale
- New London County homes for sale
- Newport County homes for sale
- Norfolk County homes for sale
- Northeastern Connecticut County homes for sale
- Plymouth County homes for sale
- Providence County homes for sale
- Southeastern Connecticut County homes for sale
- Suffolk County homes for sale
- Washington County homes for sale
- Windham County homes for sale
- Worcester County homes for sale
Protect your home and budget from life's surprises with an Assurant Home Warranty, backed by a partner that supports you through every step of homeownership. Explore Plans.
©2026 Century 21 Real Estate LLC. All rights reserved. CENTURY 21®, the CENTURY 21 Logo and C21® are service marks owned by Century 21 Real Estate LLC. Century 21 Real Estate LLC fully supports the principles of the Fair Housing Act and the Equal Opportunity Act. Each office is independently owned and operated. Listing information is deemed reliable but not guaranteed accurate.