Smithwick, SD - homes for sale
4 of 4 results displayed
 $300,000Active3 beds 2 baths1,674 sq. ft.
322 4th, Smithwick, SD 57782
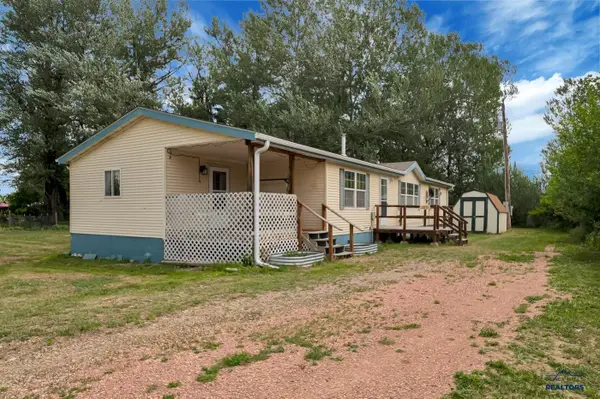
MLS# 179292Listed by: COLDWELL BANKER BLACK HILLS LEGACY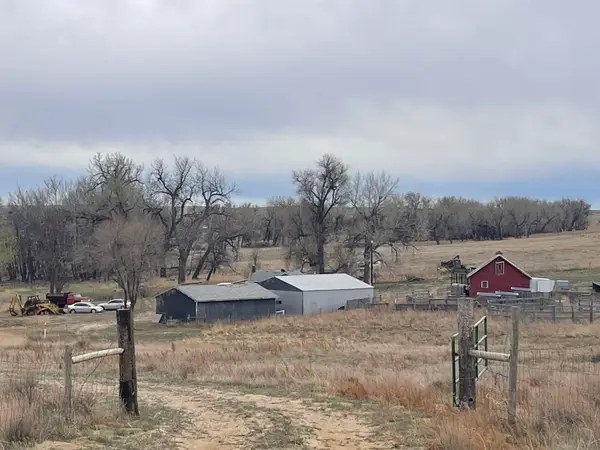 $295,000Active1 beds 1 baths873 sq. ft.
14227 Smithwick Road, Smithwick, SD 57782
MLS# 88326Listed by: HEARTLAND REAL ESTATE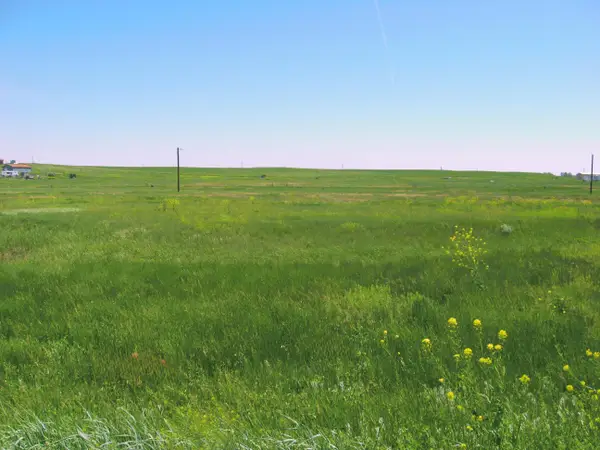 $39,900Active4.04 Acres
Lot 60 Gobbler Lane, Smithwick, SD 57782
MLS# 87566Listed by: BLACK HILLS BEST REALTY $39,900Active4.1 Acres
Lot 58 Gobbler Lane, Smithwick, SD 57782
MLS# 86029Listed by: BLACK HILLS BEST REALTY
Local realty services provided by:CENTURY 21 ClearView Realty, CENTURY 21 Stevens and Associates, Inc.
Protect your home and budget from life's surprises with an Assurant Home Warranty, backed by a partner that supports you through every step of homeownership. Explore Plans.
©2026 Century 21 Real Estate LLC. All rights reserved. CENTURY 21®, the CENTURY 21 Logo and C21® are service marks owned by Century 21 Real Estate LLC. Century 21 Real Estate LLC fully supports the principles of the Fair Housing Act and the Equal Opportunity Act. Each office is independently owned and operated. Listing information is deemed reliable but not guaranteed accurate.