- Bath Beach, Brooklyn homes for sale
- Bensonhurst, Brooklyn homes for sale
- Borough Park, Brooklyn homes for sale
- Brighton Beach, Brooklyn homes for sale
- Coney Island, Brooklyn homes for sale
- Ditmas Park, Brooklyn homes for sale
- Flatbush, Brooklyn homes for sale
- Flatlands, Brooklyn homes for sale
- Gerritsen Beach, Brooklyn homes for sale
- Gravesend, Brooklyn homes for sale
- Homecrest, Brooklyn homes for sale
- Kensington, Brooklyn homes for sale
- Madison, Brooklyn homes for sale
- Manhattan Beach, Brooklyn homes for sale
- Marine Park, Brooklyn homes for sale
- Midwood, Brooklyn homes for sale
- Mill Basin, Brooklyn homes for sale
- Sea Gate, Brooklyn homes for sale
- Sheepshead Bay, Brooklyn homes for sale
- Southeastern Brooklyn, Brooklyn homes for sale
Southern Brooklyn, Brooklyn, NY - homes for sale
300 of 1,267 results displayed
- New
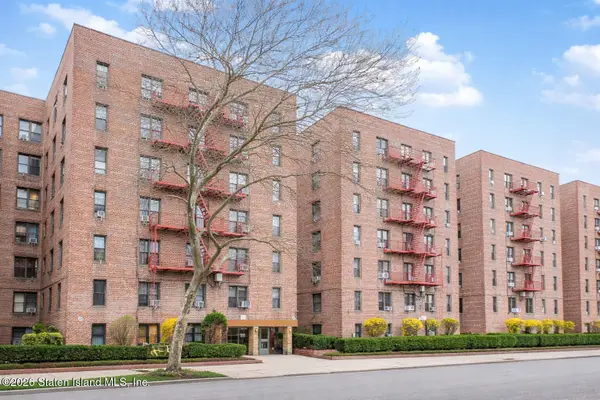 $374,998Active2 beds 1 baths925 sq. ft.
2400 E 3rd Street E #607, Brooklyn, NY 11223
MLS# 2601731Listed by: HOMES R US REALTY OF NY, INC. - New
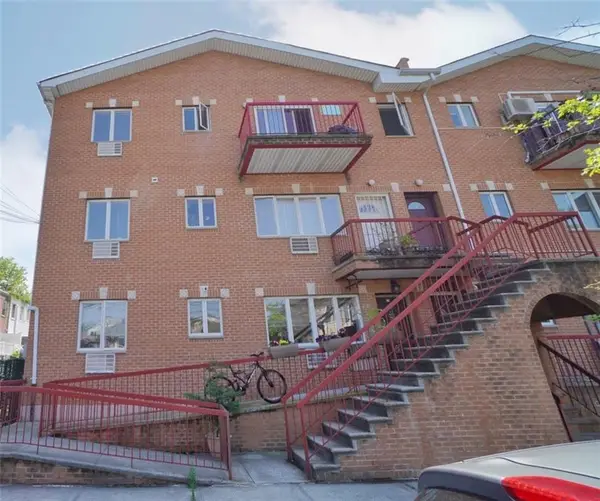 $579,000Active2 beds 2 baths872 sq. ft.
2801 East 28th Street #2A, Brooklyn, NY 11235
MLS# 500186Listed by: UNITED NATIONAL REALTY - New
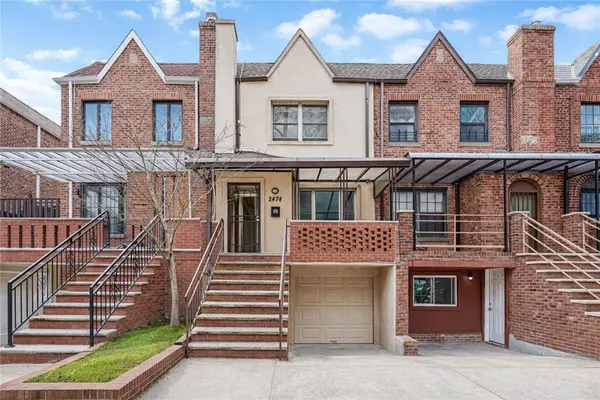 $1,038,000Active2 beds 3 baths1,452 sq. ft.
2474 East 18th Street, Brooklyn, NY 11235
MLS# 500199Listed by: RE/MAX REAL ESTATE PROFESSIONA - New
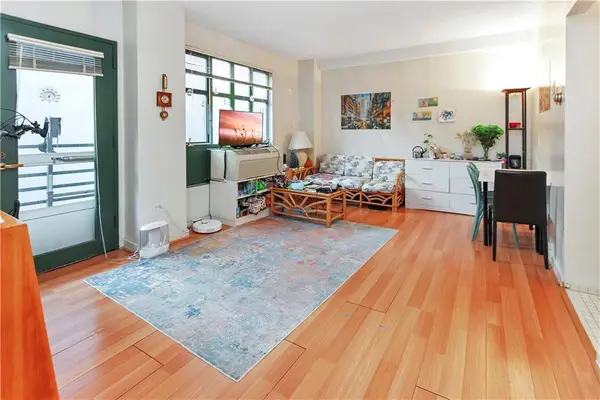 $480,000Active1 beds 1 baths589 sq. ft.
1720 East 14 Street #4B, Brooklyn, NY 11229
MLS# 500202Listed by: RE/MAX EDGE - New
 $849,000Active3 beds 2 baths1,165 sq. ft.
601 Surf Ave Avenue #8G, Brooklyn, NY 11224
MLS# 500206Listed by: J. SIKAR REALTY - New
 $229,000Active1 beds 1 baths750 sq. ft.
2675 Ocean Avenue #5P, Brooklyn, NY 11229
MLS# 500168Listed by: REAL BROKER NY LLC - Open Sat, 1 to 2pmNew
 $1,380,000Active-- beds 3 baths1,600 sq. ft.
1966 West 8th Street, Brooklyn, NY 11223
MLS# 500171Listed by: E HOUSE REALTY & MGT. INC - New
 $1,480,000Active7 beds 5 baths3,300 sq. ft.
1867 West 12th Street, Brooklyn, NY 11223
MLS# 500177Listed by: RE/MAX EDGE - New
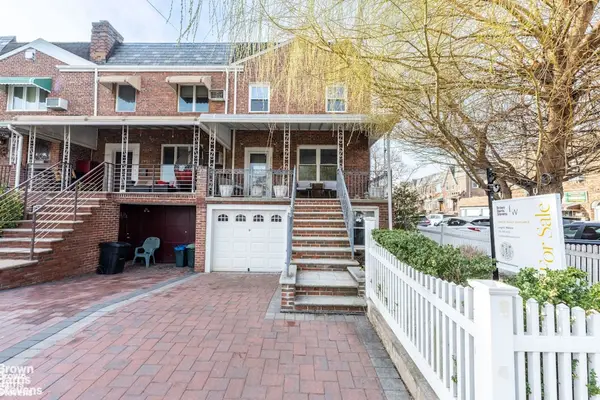 $895,000Active5 beds 3 baths2,700 sq. ft.
2954 Ave R, Brooklyn, NY 11229
MLS# RLS20079976Listed by: BROWN HARRIS STEVENS BROOKLYN LLC
- New
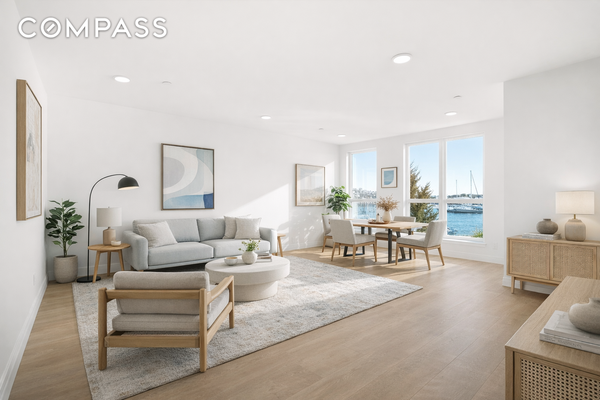
 $499,000Active1 beds 1 baths691 sq. ft.
3112 Emmons Avenue #205, Brooklyn, NY 11235
MLS# RLS20079980Listed by: COMPASS - New
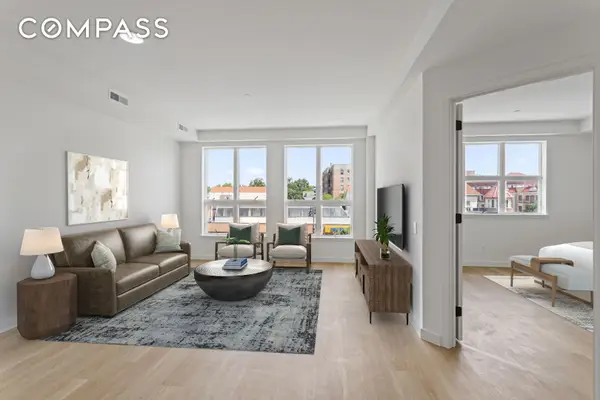
 $1,299,000Active3 beds 2 baths2,200 sq. ft.
3112 Emmons Avenue #3132-2, Brooklyn, NY 11235
MLS# RLS20079984Listed by: COMPASS - New
 $1,695,000Active5 beds 4 baths736 sq. ft.
1225 East 29th Street, Brooklyn, NY 11210
MLS# 500158Listed by: BEHFAR TEAM, LLC - New
 $168,000Active-- beds 1 baths450 sq. ft.
393 Avenue S #6G, Brooklyn, NY 11223
MLS# 500155Listed by: DREAMLIFE REALTY NEW YORK LLC - New
 $898,800Active4 beds 3 baths1,375 sq. ft.
2969 Brighton 1st Street #PH4, Brooklyn, NY 11235
MLS# 500143Listed by: AMERIHOMES REALTY OF NY, INC - New
 $649,900Active3 beds 2 baths1,400 sq. ft.
2800 Coyle Street #622, Brooklyn, NY 11235
MLS# 978521Listed by: PROPERTY PROFESSIONALS REALTY - New
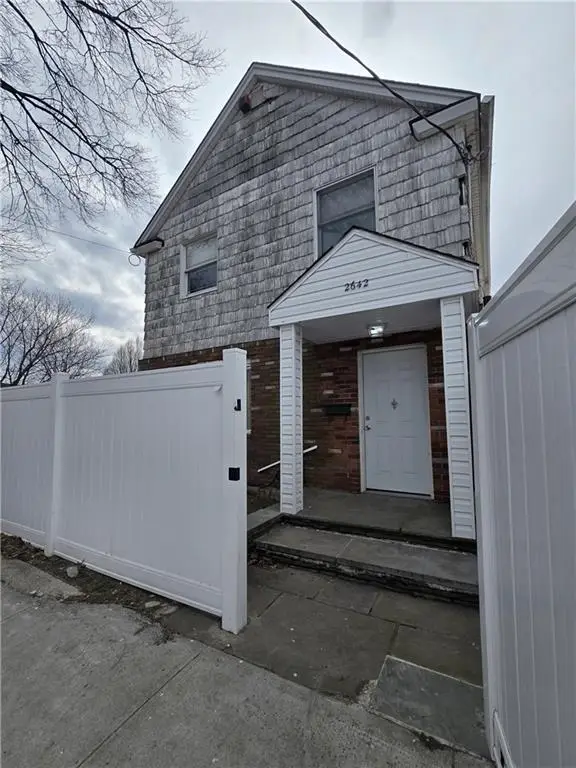
 $849,000Active2 beds 2 baths1,176 sq. ft.
2642 Coyle Street, Brooklyn, NY 11235
MLS# 500100Listed by: CENTURY 21 HOMEFRONT REALTY - New
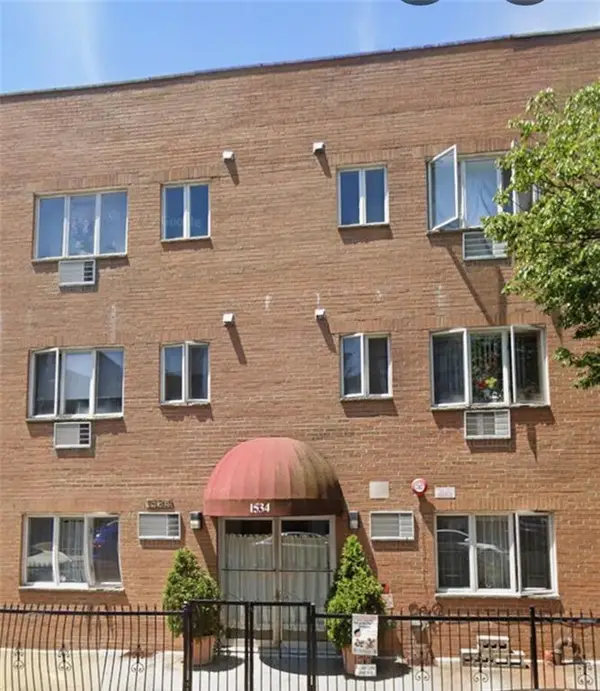 $450,000Active2 beds 1 baths690 sq. ft.
1534 West 7th Street #3B, Brooklyn, NY 11204
MLS# 500126Listed by: BHHS FILLMORE R.E. - New
 $1,850,000Active3 beds 3 baths2,772 sq. ft.
65 Amherst Street, Brooklyn, NY 11235
MLS# 500120Listed by: AMERIHOMES REALTY OF NY, INC - New
 $479,000Active2 beds 1 baths950 sq. ft.
1360 Ocean Parkway #6J, Brooklyn, NY 11230
MLS# 500113Listed by: DIAMOND REAL INC - New
 $918,000Active-- beds 2 baths1,809 sq. ft.
2618 East 7 Street, Brooklyn, NY 11235
MLS# 500110Listed by: HIGH CLASS REALTY SB LLC. - New
 $1,750,000Active6 beds 4 baths2,362 sq. ft.
2404 84th Street, Brooklyn, NY 11214
MLS# 978604Listed by: COLDWELL BANKER ADVANTAGE - New
 $599,000Active2 beds 1 baths943 sq. ft.
601 Surf Avenue #18J, Brooklyn, NY 11224
MLS# 500109Listed by: MILL REALTY GROUP INC. - New
 $1,998,800Active6 beds 4 baths2,480 sq. ft.
2184 East 9th Street, Brooklyn, NY 11223
MLS# 500105Listed by: NEW WORLD REALTY GROUP LLC - Open Sun, 11:30am to 12:30pmNew
 $399,000Active2 beds 1 baths1,100 sq. ft.
1802 Ocean Parkway #D18, Brooklyn, NY 11223
MLS# 978503Listed by: MYNY RESIDENTIAL - New
 $948,000Active4 beds 1 baths1,946 sq. ft.
2559 East 27th Street, Brooklyn, NY 11235
MLS# 500020Listed by: REMAX TOP NEST REAL ESTATE - New
 $330,000Active1 beds 1 baths800 sq. ft.
444 Neptune Avenue #10N, Brooklyn, NY 11224
MLS# 500083Listed by: AZBEL REAL ESTATE INC - New
 $999,000Active-- beds 2 baths
2652 Hubbard Street, Brooklyn, NY 11235
MLS# 500096Listed by: ASHFORD HOMES LLC  $695,000Pending2 beds 2 baths1,100 sq. ft.
2408 Ocean Avenue #4, Brooklyn, NY 11229
MLS# 2601621Listed by: MARK INTERNATIONAL REAL ESTATE- New
 $1,990,000Active8 beds 4 baths3,300 sq. ft.
1202 Avenue I, Brooklyn, NY 11230
MLS# 500072Listed by: RE/MAX EDGE - New
 $938,000Active-- beds -- baths2,600 sq. ft.
4205 Sea Gate Avenue, Brooklyn, NY 11224
MLS# 978156Listed by: RE/MAX EDGE - New
 $3,199,998Active7 beds 5 baths4,350 sq. ft.
105 Kensington Street, Brooklyn, NY 11235
MLS# 500066Listed by: RE/MAX EDGE - New
 $899,000Active3 beds 3 baths1,533 sq. ft.
63 Brighton 2nd Place #4B, Brooklyn, NY 11235
MLS# 500065Listed by: RE/MAX EDGE - New
 $1,298,000Active3 beds 3 baths2,106 sq. ft.
20 Corbin Place, Brooklyn, NY 11235
MLS# 500062Listed by: MAXIMILLION REALTY, INC. - New
 $899,900Active8 beds 3 baths2,961 sq. ft.
3028 Brighton 8th Street, Brooklyn, NY 11235
MLS# 500039Listed by: TOM MARCO REAL ESTATE - New
 $2,180,000Active3 beds 4 baths2,268 sq. ft.
3199 Bedford Avenue, Brooklyn, NY 11210
MLS# 500061Listed by: EXP REALTY BKNY - New
 $299,000Active1 beds 1 baths850 sq. ft.
3080 Voorhies Avenue #6F, Brooklyn, NY 11235
MLS# 500044Listed by: BRIGHT HORIZONS REALTY - New
 $1,098,000Active3 beds 2 baths1,320 sq. ft.
33 Kings Place, Brooklyn, NY 11223
MLS# 500056Listed by: TALK OF THE TOWN REALTY CORP. - New
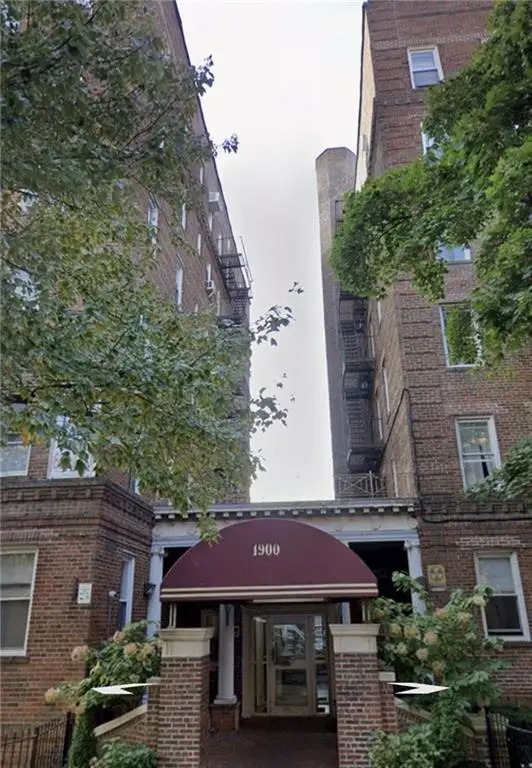 $257,000Active-- beds 1 baths650 sq. ft.
1900 Quentin Road #F5, Brooklyn, NY 11229
MLS# 500049Listed by: GOLDEN REAL - Open Fri, 1 to 2pmNew
 $459,900Active1 beds 1 baths534 sq. ft.
2218 Ocean Avenue #5G, Brooklyn, NY 11229
MLS# 500042Listed by: RE/MAX EDGE - New
 $769,000Active3 beds 3 baths1,654 sq. ft.
3105 Emmons Avenue #1A, Brooklyn, NY 11235
MLS# 500036Listed by: KORR REALTY - New
 $775,000Active2 beds 2 baths1,200 sq. ft.
1120 Banner Avenue, Brooklyn, NY 11235
MLS# 975372Listed by: PULLINI REALTY CORP - New
 $999,000Active3 beds 2 baths1,675 sq. ft.
2637 Hubbard Street, Brooklyn, NY 11235
MLS# 975775Listed by: PULLINI REALTY CORP - New
 $2,480,000Active9 beds 4 baths3,780 sq. ft.
2315 82nd Street, Brooklyn, NY 11214
MLS# 500010Listed by: TIGER REALTY - Open Sun, 2 to 4pmNew
 $809,000Active4 beds 2 baths1,560 sq. ft.
12 Webers Court, Brooklyn, NY 11235
MLS# 500026Listed by: ATLANTIC PROPERTIES REALTY INC - New
 $329,000Active1 beds 1 baths950 sq. ft.
1289 E 19th Street #C1, Brooklyn, NY 11230
MLS# RLS20079821Listed by: RE MAX EDGE GROUP - New
 $998,000Active3 beds 2 baths1,264 sq. ft.
3035 Avenue T, Brooklyn, NY 11220
MLS# 500024Listed by: RE/MAX EDGE - New
 $5,400,000Active-- beds 4 baths1,799 sq. ft.
2350 East 2nd Street, Brooklyn, NY 11223
MLS# 500022Listed by: SARDELL REALTY LLC - New
 $325,000Active1 beds 1 baths750 sq. ft.
2785 Ocean Parkway #3J, Brooklyn, NY 11235
MLS# 500021Listed by: BROOKLYN RESIDENTIAL R E SERV - New
 $269,000Active1 beds 1 baths750 sq. ft.
394 Avenue S #4A, Brooklyn, NY 11223
MLS# 500018Listed by: BHHS FILLMORE R.E. - Open Sat, 12 to 3pmNew
 $871,000Active2 beds 2 baths770 sq. ft.
2286 Cropsey Avenue #21H, Brooklyn, NY 11214
MLS# 500019Listed by: MOMENTUM REAL ESTATE LLC - New
 $978,000Active2 beds 3 baths1,589 sq. ft.
2427 East 17th Street, Brooklyn, NY 11235
MLS# 499908Listed by: TIGER REALTY - New
 $1,050,000Active3 beds 3 baths2,222 sq. ft.
4334 Bedford Avenue, Brooklyn, NY 11229
MLS# 499977Listed by: BEHFAR TEAM, LLC - New
 $1,348,000Active3 beds 2 baths1,618 sq. ft.
1925 East 16th Street, Brooklyn, NY 11229
MLS# 499999Listed by: BEN BAY REALTY CO OF BAY RIDGE - Open Sun, 11am to 12pmNew
 $1,928,000Active-- beds -- baths4,432 sq. ft.
1213 Desmond Court, Brooklyn, NY 11235
MLS# 976898Listed by: RE/MAX EDGE - Open Sun, 1 to 2pmNew
 $558,000Active2 beds 1 baths745 sq. ft.
4300 Atlantic Avenue #7, Brooklyn, NY 11224
MLS# 976797Listed by: RE/MAX EDGE - New
 $950,000Active3 beds 3 baths1,728 sq. ft.
150 Bay 40th Street, Brooklyn, NY 11214
MLS# 499995Listed by: RE/MAX EDGE - New
 $349,000Active2 beds 1 baths1,000 sq. ft.
2555 Batchelder Street #6B, Brooklyn, NY 11235
MLS# 499996Listed by: KORR REALTY - New
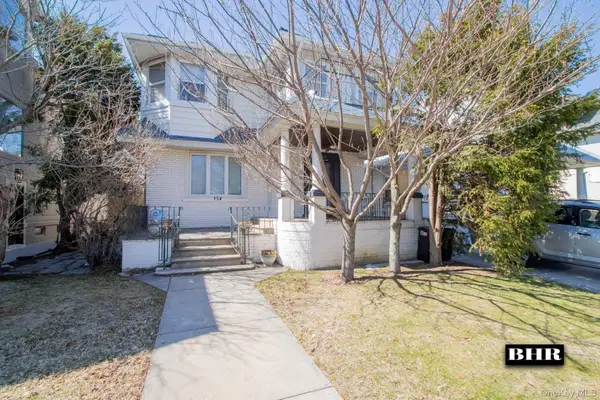 $1,750,000Active3 beds 4 baths1,932 sq. ft.
154 Beaumont Street, Brooklyn, NY 11235
MLS# 976538Listed by: BRIGHT HORIZONS REALTY INC - New
 $1,149,000Active3 beds 4 baths2,700 sq. ft.
2556 East 26th Street, Brooklyn, NY 11235
MLS# 499989Listed by: RE/MAX EDGE - New
 $875,000Active3 beds 2 baths1,456 sq. ft.
1570 West 10th Street #3A, Brooklyn, NY 11204
MLS# 499957Listed by: ILITE REALTY INC - New
 $850,000Active3 beds 2 baths1,800 sq. ft.
2665 E 6th Street #1, Brooklyn, NY 11235
MLS# RLS20079371Listed by: ENGEL & VOLKERS BROWNSTONE BROOKLYN - New
 $1,550,000Active6 beds 3 baths2,292 sq. ft.
1858 West 5th Street, Brooklyn, NY 11223
MLS# 499946Listed by: RE/MAX ADVISORS - New
 $475,000Active2 beds 2 baths1,150 sq. ft.
2944 West 5th Street #23C, Brooklyn, NY 11224
MLS# 499971Listed by: J. SIKAR REALTY - New
 $200,000Active2 beds 1 baths900 sq. ft.
2212 Brigham Street #5D, Brooklyn, NY 11229
MLS# 499972Listed by: PEERLESS PROPERTIES CORP. - New
 $1,249,000Active6 beds 3 baths2,142 sq. ft.
2076 Coyle Street, Brooklyn, NY 11229
MLS# 499973Listed by: ROBERT DEFALCO REALTY - New
 $448,990Active2 beds 2 baths1,200 sq. ft.
1625 East 13th Street #5H, Brooklyn, NY 11229
MLS# 499974Listed by: RE/MAX EDGE - Open Sat, 1 to 3pmNew
 $2,199,000Active9 beds 4 baths4,224 sq. ft.
46 Bay 37th Street, Brooklyn, NY 11214
MLS# 499882Listed by: RE/MAX EDGE - Open Sun, 3 to 4pmNew
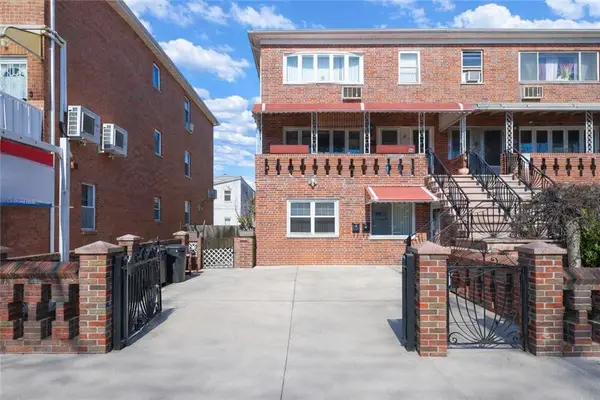
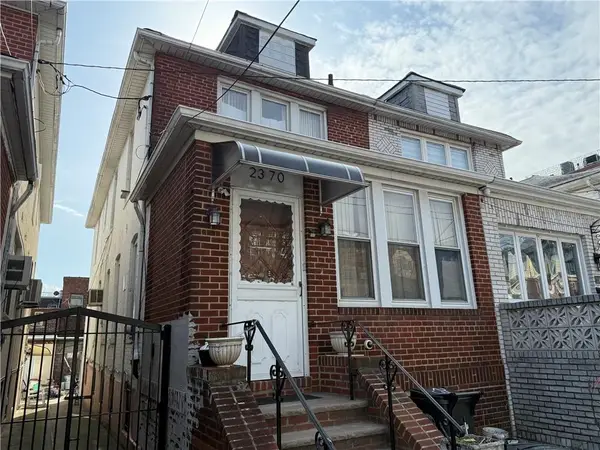 $1,550,000Active7 beds 4 baths1,920 sq. ft.
2370 85th Street, Brooklyn, NY 11214
MLS# 499970Listed by: BEN BAY REALTY CO - Open Sun, 1 to 3pmNew
 $669,000Active2 beds 2 baths965 sq. ft.
2517 Voorhies Avenue #1C, Brooklyn, NY 11235
MLS# 499776Listed by: RE/MAX EDGE - New
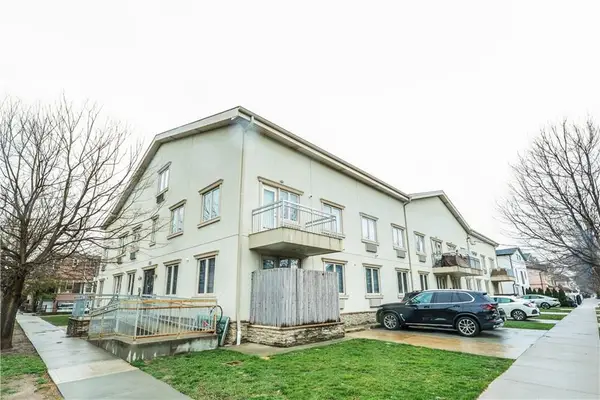
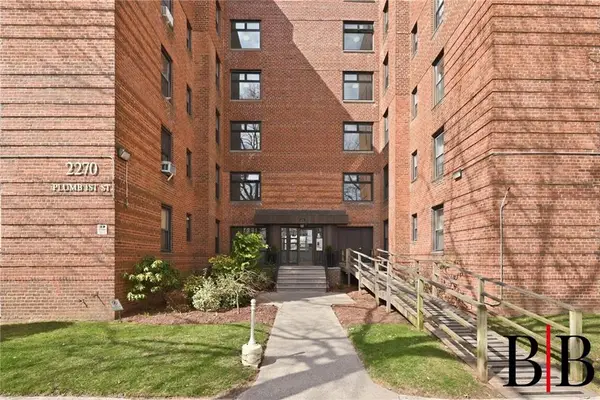 $239,000Active2 beds 1 baths950 sq. ft.
2270 Plumb 1st Street #2D, Brooklyn, NY 11229
MLS# 499900Listed by: BERGEN BASIN REALTY LLC - New
 $1,098,000Active10 beds 7 baths4,540 sq. ft.
4215 Atlantic Avenue, Brooklyn, NY 11224
MLS# 499938Listed by: COMPASS GREATER NY, LLC - New
 $2,850,000Active3 beds 3 baths1,500 sq. ft.
1930 Homecrest Avenue, Brooklyn, NY 11229
MLS# 975777Listed by: GREENE REALTY GROUP - Open Sat, 11am to 12pmNew
 $429,000Active2 beds 1 baths949 sq. ft.
1717 E 18th Street #2T, Brooklyn, NY 11229
MLS# RLS20079169Listed by: COLDWELL BANKER WARBURG - New
 $1,535,000Active5 beds 2 baths2,000 sq. ft.
4319 Bedford Avenue, Brooklyn, NY 11229
MLS# RLS20079118Listed by: HOWARD HANNA NYC - New
 $1,098,000Active10 beds 7 baths4,540 sq. ft.
4215 Atlantic Avenue, Brooklyn, NY 11224
MLS# RLS20073418Listed by: COMPASS - New
 $288,000Active1 beds 1 baths800 sq. ft.
2375 Ocean Avenue #1J, Brooklyn, NY 11229
MLS# 499844Listed by: RE/MAX EDGE - New
 $1,190,000Active4 beds 3 baths1,852 sq. ft.
2464 East 28th Street, Brooklyn, NY 11235
MLS# 499873Listed by: RE/MAX EDGE - New
 $1,349,000Active5 beds 4 baths2,251 sq. ft.
2663 Haring Street, Brooklyn, NY 11235
MLS# 499922Listed by: WINZONE REALTY INC - New
 $490,000Active2 beds 1 baths950 sq. ft.
35 Seacoast Terrace #2V, Brooklyn, NY 11235
MLS# 499923Listed by: CONTINENT REALTY LLC - New
 $425,000Active2 beds 1 baths987 sq. ft.
1289 E 19th Street #B3, Brooklyn, NY 11230
MLS# RLS20078933Listed by: RE MAX EDGE GROUP - New
 $438,000Active2 beds 1 baths975 sq. ft.
1625 Emmons Avenue #DD, Brooklyn, NY 11235
MLS# 499906Listed by: RE/MAX EDGE - New
 $1,299,000Active3 beds 3 baths656 sq. ft.
2329 E 21st Street, Brooklyn, NY 11229
MLS# RLS20078808Listed by: CORCORAN GROUP - New
 $899,000Active6 beds 2 baths1,248 sq. ft.
1 Aster Court, Brooklyn, NY 11229
MLS# 499891Listed by: RELIABLE SELL & BUY REALTY INC - New
 $799,000Active3 beds 3 baths1,400 sq. ft.
407 Oceanview Avenue #PH, Brooklyn, NY 11235
MLS# RLS20078735Listed by: COMPASS  $300,000Active0.04 Acres
8 Bevy Court, Brooklyn, NY 11229
MLS# 499681Listed by: DOREEN GREENWOOD INC.- Open Sun, 2:30 to 3:30pm
 $499,000Active1 beds 2 baths744 sq. ft.
2943 Brighton 4th Street #2D, Brooklyn, NY 11235
MLS# 499865Listed by: HIGH CLASS REALTY SB LLC.  $998,000Active5 beds 4 baths2,053 sq. ft.
3735 Oceanic Avenue, Brooklyn, NY 11224
MLS# 499859Listed by: COMPASS GREATER NY, LLC- Coming Soon
 $1,200,000Coming Soon5 beds 2 baths
2230 E 17th Street, Brooklyn, NY 11229
MLS# 974670Listed by: CENTURY HOMES REALTY GROUP LLC  $389,000Active1 beds 1 baths750 sq. ft.
2944 West 5th Street #11O, Brooklyn, NY 11224
MLS# 499853Listed by: J. SIKAR REALTY $3,299,000Active4 beds 5 baths3,594 sq. ft.
4094 Ocean Avenue, Brooklyn, NY 11235
MLS# 499822Listed by: MADISONESTATES SOTHEBYS REALTY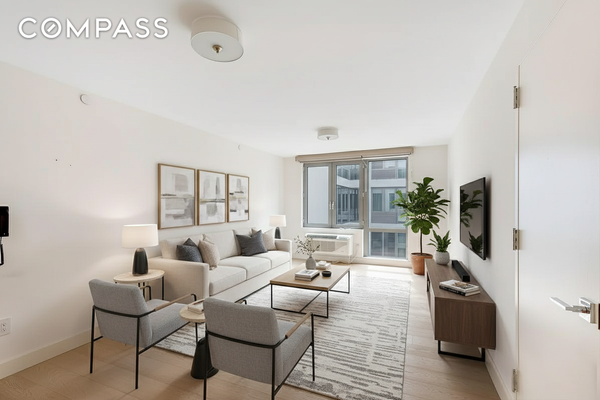 $575,000Active1 beds 1 baths664 sq. ft.
2128 Ocean Avenue #8C, Brooklyn, NY 11229
MLS# RLS20078474Listed by: COMPASS $318,000Active1 beds 1 baths800 sq. ft.
1625 Emmons Avenue #3A, Brooklyn, NY 11235
MLS# 499842Listed by: SUPERIOR REALTY SERVICE $1,650,000Active0.09 Acres
881 East 23rd Street, Brooklyn, NY 11210
MLS# 499817Listed by: BEHFAR TEAM, LLC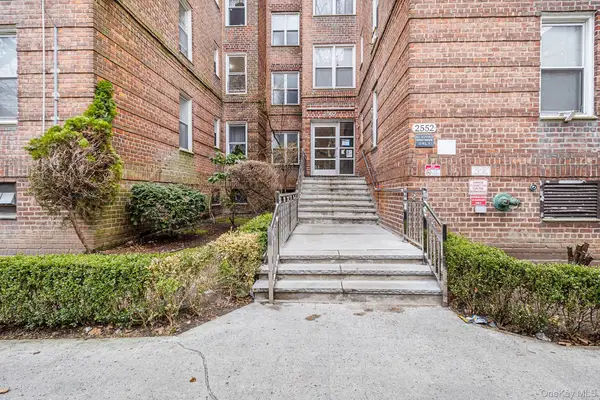 $399,000Active2 beds 1 baths
2552 E 7th Street #2J, Brooklyn, NY 11235
MLS# 973295Listed by: REDFIN REAL ESTATE $2,250,000Active4 beds 4 baths1,728 sq. ft.
2611 Avenue S, Brooklyn, NY 11229
MLS# 499819Listed by: BEHFAR TEAM, LLC $499,000Active3 beds 2 baths1,200 sq. ft.
1200 Gravesend Neck Road #4C, Brooklyn, NY 11229
MLS# 499825Listed by: RE/MAX EDGE $399,000Active2 beds 1 baths1,000 sq. ft.
2483 West 16th Street #8E, Brooklyn, NY 11214
MLS# 499826Listed by: RE/MAX EDGE $2,150,000Active7 beds 5 baths2,240 sq. ft.
3 Parkway Court, Brooklyn, NY 11223
MLS# 499810Listed by: CENTURY 21 MK REALTY $800,000Active2 beds 2 baths1,104 sq. ft.
2805 Ocean Parkway #3A, Brooklyn, NY 11235
MLS# 499672Listed by: ILITE REALTY INC $2,999,000Active7 beds 6 baths
882 East 10th Street, Brooklyn, NY 11230
MLS# 499803Listed by: BEHFAR TEAM, LLC $2,300,000Active6 beds 4 baths2,480 sq. ft.
1466 East 19th Street, Brooklyn, NY 11230
MLS# 499808Listed by: CENTURY 21 MK REALTY $778,000Active3 beds 2 baths1,200 sq. ft.
116 Gain Court, Brooklyn, NY 11229
MLS# 499809Listed by: MADISONESTATES SOTHEBYS REALTY- $999,999Active0.07 Acres
320 Avenue P, Brooklyn, NY 11204
MLS# 973878Listed by: PREMIER SOUTH SHORE REALTY LLC  $1,488,000Active10 beds 4 baths
52 28th Avenue, Brooklyn, NY 11214
MLS# 973883Listed by: KEYSTONE REALTY USA CORP $285,000Active1 beds 1 baths720 sq. ft.
1289 East 19th Street #C2, Brooklyn, NY 11230
MLS# 499709Listed by: J. SIKAR REALTY $1,199,000Active3 beds 2 baths1,510 sq. ft.
1735 West 11th Street, Brooklyn, NY 11223
MLS# 499718Listed by: GEORGE L CLARK INC $399,998Pending2 beds 1 baths1,000 sq. ft.
2680 East 19th Street #5O, Brooklyn, NY 11235
MLS# 499799Listed by: RE/MAX EDGE $1,499,000Active3 beds 3 baths2,300 sq. ft.
1725 East 26th Street, Brooklyn, NY 11229
MLS# 499780Listed by: MAXIMILLION REALTY, INC. $259,000Active1 beds 1 baths700 sq. ft.
1802 Ocean Parkway #C9, Brooklyn, NY 11235
MLS# 499777Listed by: MAXIMILLION REALTY, INC.- Open Sat, 2:30 to 4:30pm
 $360,000Active2 beds 1 baths1,000 sq. ft.
1935 Shore Parkway #1F, Brooklyn, NY 11214
MLS# 499758Listed by: MADISONESTATES SOTHEBYS REALTY  $2,500,000Active-- beds 5 baths1,760 sq. ft.
2078 East 22nd Street, Brooklyn, NY 11229
MLS# 499772Listed by: CENTURY 21 MK REALTY $1,588,000Active4 beds 3 baths1,800 sq. ft.
8113 23rd Avenue, Brooklyn, NY 11214
MLS# 499774Listed by: JABOUR REALTY COMPANY $899,000Active3 beds 2 baths1,344 sq. ft.
1116 Banner Avenue, Brooklyn, NY 11235
MLS# 973332Listed by: RE/MAX EDGE- $295,000Pending1 beds 1 baths
915 E 17th Street #111, Brooklyn, NY 11230
MLS# RLS20077871Listed by: 74 WEST REAL ESTATE  $350,000Pending1 beds 1 baths750 sq. ft.
2925 West 5th Street #21H, Brooklyn, NY 11224
MLS# 499763Listed by: MAXIMILLION REALTY, INC. $1,995,000Active5 beds 3 baths1,408 sq. ft.
1368 East 23rd Street, Brooklyn, NY 11210
MLS# 499765Listed by: BEHFAR TEAM, LLC $1,995,000Active5 beds 3 baths1,408 sq. ft.
1374 East 23rd Street, Brooklyn, NY 11210
MLS# 499766Listed by: BEHFAR TEAM, LLC $569,000Active2 beds 2 baths792 sq. ft.
2560 Stillwell Avenue #2B, Brooklyn, NY 11223
MLS# 973302Listed by: RE/MAX EDGE $195,000Active-- beds 1 baths475 sq. ft.
2665 Homecrest Avenue #1H, Brooklyn, NY 11235
MLS# 499686Listed by: RE MAX TEAM $350,000Active1 beds 1 baths850 sq. ft.
2 West End Avenue #5P, Brooklyn, NY 11235
MLS# 499754Listed by: RE/MAX EDGE $649,000Active2 beds 1 baths800 sq. ft.
1756 Ocean Avenue #6D, Brooklyn, NY 11230
MLS# RLS20077753Listed by: COMPASS $530,000Active3 beds 2 baths850 sq. ft.
1653 West 7th Street #1F, Brooklyn, NY 11223
MLS# 499741Listed by: E HOUSE REALTY & MGT. INC $955,000Active3 beds 2 baths1,601 sq. ft.
105 Kings Highway #4C, Brooklyn, NY 11214
MLS# 499727Listed by: RE/MAX EDGE $1,100,000Active4 beds 3 baths2,242 sq. ft.
2747 East 26th Street #101, Brooklyn, NY 11235
MLS# 499732Listed by: MAXIMILLION REALTY, INC. $2,679,000Active3 beds 2 baths2,533 sq. ft.
1730 East 4th Street, Brooklyn, NY 11223
MLS# 499723Listed by: CENTURY 21 MK REALTY $969,999Active4 beds 3 baths2,556 sq. ft.
4400 Atlantic Avenue, Brooklyn, NY 11224
MLS# 970993Listed by: BERKSHIRE HATHAWAY $289,000Active1 beds 1 baths800 sq. ft.
2711 Avenue X #6D, Brooklyn, NY 11235
MLS# 968434Listed by: COLDWELL BANKER RELIABLE R E- Open Sat, 1 to 3pm
 $988,000Active3 beds 2 baths2,114 sq. ft.
2357 84th Street #1a, Brooklyn, NY 11214
MLS# 2601342Listed by: RELIANCE REALTY ONE  $460,000Active2 beds 1 baths900 sq. ft.
1350 Ocean Parkway #3F, Brooklyn, NY 11230
MLS# 499115Listed by: BEHFAR TEAM, LLC $329,998Active1 beds 1 baths852 sq. ft.
100 Avenue P #4K, Brooklyn, NY 11204
MLS# 499705Listed by: RE/MAX EDGE $199,998Pending1 beds 1 baths550 sq. ft.
3235 Emmons Avenue #315, Brooklyn, NY 11235
MLS# 499693Listed by: RE/MAX EDGE $1,247,000Pending5 beds 3 baths2,251 sq. ft.
2640 Brown Street, Brooklyn, NY 11235
MLS# 499701Listed by: GOLDEN REAL $1,375,000Active3 beds 3 baths1,280 sq. ft.
2221 East 21st Street, Brooklyn, NY 11229
MLS# 499674Listed by: CENTURY 21 MK REALTY $1,499,000Active8 beds 3 baths2,736 sq. ft.
452 Avenue Y, Brooklyn, NY 11223
MLS# 499675Listed by: RE/MAX EDGE $209,000Active1 beds 1 baths625 sq. ft.
2615 Avenue O #5M, Brooklyn, NY 11210
MLS# 499658Listed by: ILITE REALTY INC- Open Sun, 12 to 4pm
 $856,000Active2 beds 2 baths770 sq. ft.
2286 Cropsey Avenue #19H, Brooklyn, NY 11214
MLS# 499652Listed by: BAYVIEW MARKETING GROUP LLC - Open Sun, 12 to 4pm
 $775,000Active2 beds 2 baths770 sq. ft.
2286 Cropsey Avenue #8H, Brooklyn, NY 11214
MLS# 499653Listed by: BAYVIEW MARKETING GROUP LLC - Open Sun, 12 to 4pm
 $839,000Active2 beds 2 baths889 sq. ft.
2286 Cropsey Avenue #8B, Brooklyn, NY 11214
MLS# 499654Listed by: BAYVIEW MARKETING GROUP LLC - Open Sun, 12 to 4pm
 $930,000Active2 beds 2 baths948 sq. ft.
2286 Cropsey Avenue #7E, Brooklyn, NY 11214
MLS# 499656Listed by: BAYVIEW MARKETING GROUP LLC - Open Sun, 12 to 4pm
 $918,000Active2 beds 2 baths946 sq. ft.
2286 Cropsey Avenue #6F, Brooklyn, NY 11214
MLS# 499657Listed by: BAYVIEW MARKETING GROUP LLC  $798,300Active2 beds 2 baths893 sq. ft.
2819 West 17th Street #1B, Brooklyn, NY 11224
MLS# 499633Listed by: E HOUSE REALTY & MGT. INC. $1,071,000Active2 beds 2 baths948 sq. ft.
2286 Cropsey Avenue #21E, Brooklyn, NY 11214
MLS# 499638Listed by: RE/MAX EDGE $906,000Active2 beds 2 baths889 sq. ft.
2286 Cropsey Avenue #15A, Brooklyn, NY 11214
MLS# 499635Listed by: RE/MAX EDGE $906,000Active2 beds 2 baths889 sq. ft.
2286 Cropsey Avenue #15B, Brooklyn, NY 11214
MLS# 499636Listed by: RE/MAX EDGE $1,590,000Active4 beds 3 baths1,756 sq. ft.
2286 Cropsey Avenue #4R, Brooklyn, NY 11214
MLS# 499637Listed by: RE/MAX EDGE- Open Sun, 12 to 2pm
 $1,630,000Active5 beds 3 baths2,161 sq. ft.
3133 Nostrand Avenue, Brooklyn, NY 11229
MLS# 499578Listed by: MOMENTUM REAL ESTATE LLC  $2,495,000Active6 beds 3 baths2,368 sq. ft.
303 Avenue N, Brooklyn, NY 11230
MLS# 499613Listed by: BROOKLYN RESIDENTIAL R E SERV $319,000Active1 beds 1 baths900 sq. ft.
1200 Gravesend Neck Road #4E, Brooklyn, NY 11229
MLS# 499607Listed by: EXP REALTY BKNY $409,000Active1 beds 1 baths900 sq. ft.
1213 Avenue Z #B38, Brooklyn, NY 11235
MLS# 971045Listed by: COLDWELL BANKER RELIABLE R E $1,599,000Active11 beds 6 baths5,042 sq. ft.
2503 East 19th Street, Brooklyn, NY 11235
MLS# 499583Listed by: RE/MAX EDGE $500,000Active2 beds 1 baths1,349 sq. ft.
22 Nova Court, Brooklyn, NY 11229
MLS# 971200Listed by: ISLAND ADVANTAGE REALTY LLC $875,000Pending3 beds 2 baths1,182 sq. ft.
50 Bay 37th Street #3-A, Brooklyn, NY 11214
MLS# RLS20076923Listed by: ALEPH REALTY BROKERAGE LLC $280,000Active1 beds 1 baths795 sq. ft.
735 Avenue W #3L, Brooklyn, NY 11223
MLS# 969138Listed by: KELLER WILLIAMS LANDMARK II $1,250,000Active3 beds 3 baths1,300 sq. ft.
1844 East 19th Street, Brooklyn, NY 11229
MLS# 499588Listed by: BEHFAR TEAM, LLC $1,199,000Active7 beds 4 baths2,920 sq. ft.
2540 East 11th Street, Brooklyn, NY 11235
MLS# 499592Listed by: RE/MAX EDGE $299,000Active1 beds 1 baths860 sq. ft.
2727 Ocean Parkway #B10, Brooklyn, NY 11235
MLS# 499561Listed by: EXP REALTY BKNY- Open Sun, 3 to 5pm
 $1,048,000Active2 beds 2 baths1,033 sq. ft.
1501 Voorhies Avenue #27D, Brooklyn, NY 11235
MLS# 499571Listed by: WINZONE REALTY INC  $689,000Active2 beds 2 baths1,087 sq. ft.
3015 Brighton 6th Street #9B, Brooklyn, NY 11235
MLS# 499580Listed by: HIGH CLASS REALTY SB LLC.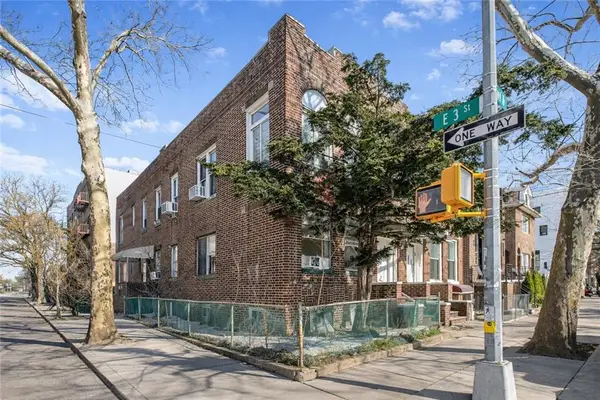 $2,495,000Active7 beds 2 baths2,560 sq. ft.
301 Avenue N, Brooklyn, NY 11230
MLS# 499447Listed by: ES REALTY EVA SHAMMAH LLC $1,150,000Active4 beds 3 baths2,052 sq. ft.
2739 Brown Street, Brooklyn, NY 11235
MLS# 499452Listed by: RE/MAX EDGE $1,890,000Active4 beds 3 baths1,620 sq. ft.
2177 West 7th Street, Brooklyn, NY 11223
MLS# 499553Listed by: EXIT REALTY PROFESSIONALS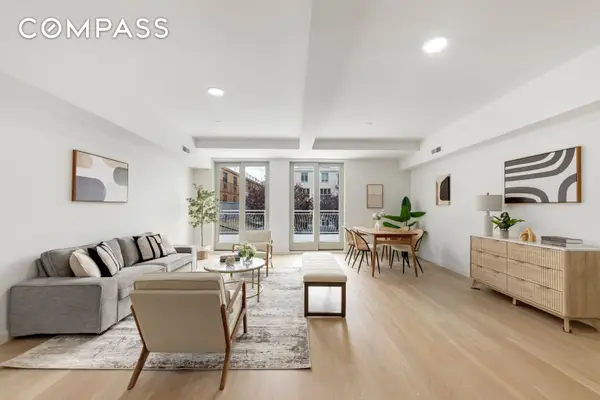 $1,085,000Active2 beds 2 baths1,580 sq. ft.
3112 Emmons Avenue #106, Brooklyn, NY 11235
MLS# RLS20076709Listed by: COMPASS $1,789,000Active8 beds 5 baths2,420 sq. ft.
2524 West Street, Brooklyn, NY 11223
MLS# 970741Listed by: COLDWELL BANKER RELIABLE R E $399,000Active1 beds 1 baths827 sq. ft.
1401 Ocean Avenue #12B, Brooklyn, NY 11230
MLS# 970685Listed by: RE/MAX CITY SQUARE- Open Sat, 1 to 3pm
 $1,338,000Active-- beds 3 baths1,920 sq. ft.
2419 West 3rd Street, Brooklyn, NY 11223
MLS# 499555Listed by: TIGER REALTY  $355,000Active2 beds 1 baths890 sq. ft.
394 Avenue S #3D, Brooklyn, NY 11223
MLS# 499565Listed by: DREAMLIFE REALTY NEW YORK LLC $1,275,000Active4 beds 3 baths2,249 sq. ft.
4388 Bedford Avenue, Brooklyn, NY 11229
MLS# 499503Listed by: RE MAX TEAM $1,250,000Active11 beds 6 baths5,040 sq. ft.
2180 East 13th Street, Brooklyn, NY 11229
MLS# 499461Listed by: HARVEY HEINO REALTY CORP. $1,399,000Active-- beds 3 baths2,496 sq. ft.
40 Southgate Court, Brooklyn, NY 11223
MLS# 499509Listed by: WOLF PROPERTIES INC $299,000Active2 beds 1 baths950 sq. ft.
3021 Avenue Z #4A, Brooklyn, NY 11235
MLS# 499511Listed by: MADISONESTATES SOTHEBYS REALTY $950,000Active2 beds 2 baths1,568 sq. ft.
2277 East 28th Street, Brooklyn, NY 11229
MLS# 499532Listed by: RE/MAX EDGE $368,000Active1 beds 1 baths900 sq. ft.
2035 East 7th Street #3J, Brooklyn, NY 11223
MLS# 499539Listed by: BHHS FILLMORE R.E. $759,000Active2 beds 1 baths921 sq. ft.
601 Surf Avenue #18E, Brooklyn, NY 11224
MLS# 499548Listed by: MAXIMILLION REALTY, INC. $295,000Active1 beds 1 baths800 sq. ft.
2475 West 16th Street #5A, Brooklyn, NY 11214
MLS# 499551Listed by: DREAMLIFE REALTY NEW YORK LLC $2,190,000Active7 beds 6 baths3,025 sq. ft.
154 Bay 32nd Street, Brooklyn, NY 11214
MLS# 499554Listed by: TIGER REALTY $7,299,000Active-- beds 3 baths
1899 East 3rd Street, Brooklyn, NY 11223
MLS# 499507Listed by: WOLF PROPERTIES INC $499,000Active2 beds 1 baths778 sq. ft.
1489 East 8th Street #C2, Brooklyn, NY 11230
MLS# 499528Listed by: RE/MAX EDGE $847,000Active2 beds 2 baths1,075 sq. ft.
2752 Ocean Avenue #6A, Brooklyn, NY 11229
MLS# 499527Listed by: GOLDEN REAL $479,000Active1 beds 1 baths684 sq. ft.
4300 Atlantic Avenue #P8, Brooklyn, NY 11224
MLS# 970043Listed by: EXP REALTY $1,788,888Active8 beds 4 baths2,646 sq. ft.
56 Bay 40th Street, Brooklyn, NY 11214
MLS# 499501Listed by: PROBASE REAL ESTATE $828,000Active2 beds 2 baths819 sq. ft.
2218 Ocean Avenue #5A, Brooklyn, NY 11229
MLS# 499393Listed by: REMAX TOP NEST REAL ESTATE $305,000Active-- beds 1 baths700 sq. ft.
110 Shore Boulevard #5A, Brooklyn, NY 11235
MLS# 499466Listed by: AMERIHOMES REALTY OF NY, INC. $165,000Active1 beds 1 baths750 sq. ft.
2271 Knapp Street #2A, Brooklyn, NY 11229
MLS# 499498Listed by: BRP ASSOCIATES INC $389,999Active2 beds 1 baths1,100 sq. ft.
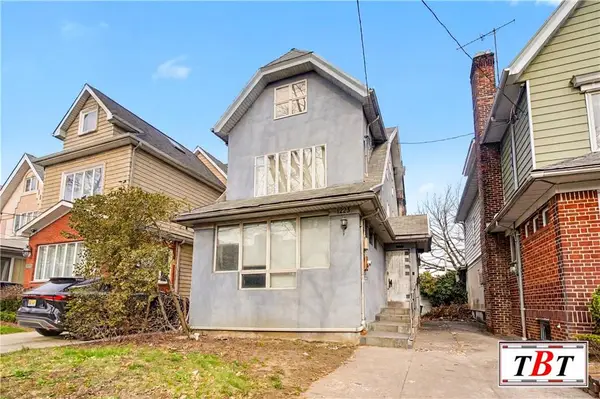
3901 Nostrand Ave Apt 4b #4B, Brooklyn, NY 11235
MLS# 969741Listed by: MINT HOMES LI LLC $195,000Active-- beds 1 baths500 sq. ft.
2665 Homecrest Avenue #1W, Brooklyn, NY 11235
MLS# 499062Listed by: RE/MAX EDGE $929,000Active5 beds 3 baths1,912 sq. ft.
3724 Laurel Avenue, Brooklyn, NY 11224
MLS# 499479Listed by: WINZONE REALTY INC $719,000Active2 beds 2 baths856 sq. ft.
2518 Ocean Avenue #301, Brooklyn, NY 11229
MLS# 499444Listed by: COMPASS GREATER NY, LLC $519,000Active1 beds 1 baths628 sq. ft.
2518 Ocean Avenue #302, Brooklyn, NY 11229
MLS# 499451Listed by: COMPASS GREATER NY, LLC $1,895,000Active6 beds 3 baths2,220 sq. ft.
2821 Avenue N, Brooklyn, NY 11210
MLS# 499474Listed by: REVIVED RESIDENTIAL- Open Sun, 2:30 to 4pm
 $1,400,000Active5 beds 2 baths1,952 sq. ft.
1902 West 11th Street, Brooklyn, NY 11223
MLS# 499469Listed by: TIGER REALTY  $2,400,000Active8 beds 6 baths5,350 sq. ft.
2283 65th Street, Brooklyn, NY 11204
MLS# RLS20067838Listed by: COMPASS $639,000Active2 beds 2 baths723 sq. ft.
1549 W 3rd Street #2, Brooklyn, NY 11204
MLS# 968979Listed by: WINZONE REALTY INC $899,000Active3 beds 2 baths1,621 sq. ft.
3912 Lyme Avenue, Brooklyn, NY 11224
MLS# 969018Listed by: RE/MAX EDGE $265,000Active1 beds 1 baths800 sq. ft.
2940 Ocean Avenue #A11, Brooklyn, NY 11235
MLS# 499434Listed by: CONTINENT REALTY LLC $255,000Active1 beds 1 baths795 sq. ft.
735 Avenue W #6M, Brooklyn, NY 11223
MLS# 962660Listed by: BLUE SKYLINE REALTY BRKRG LLC- Open Sun, 11am to 12pm
 $1,025,000Active3 beds 3 baths
1854 West 7th Street, Brooklyn, NY 11223
MLS# 499429Listed by: RELIABLE SELL & BUY REALTY INC  $339,000Active3 beds 1 baths1,056 sq. ft.
2209 Knapp Street #1F, Brooklyn, NY 11229
MLS# 499307Listed by: DOREEN GREENWOOD INC. $325,000Active1 beds 1 baths
1801 Ocean Avenue #4D, Brooklyn, NY 11230
MLS# RLS20075761Listed by: DOUGLAS ELLIMAN REAL ESTATE $1,699,000Pending7 beds 4 baths
1537 West 12th Street, Brooklyn, NY 11204
MLS# 499333Listed by: BEN BAY REALTY CO OF BAY RIDGE $369,888Active1 beds 1 baths800 sq. ft.
1625 Emmons Avenue #3A, Brooklyn, NY 11235
MLS# 499428Listed by: LOMBARDO HOMES & ESTATES $345,000Active1 beds 1 baths800 sq. ft.
1840 East 13th Street #6S, Brooklyn, NY 11229
MLS# 499427Listed by: RE/MAX EDGE $549,000Active1 beds 1 baths645 sq. ft.
1917 Avenue X #5A, Brooklyn, NY 11235
MLS# 499412Listed by: RE/MAX REAL ESTATE PROFESSIONA $559,000Pending2 beds 2 baths1,250 sq. ft.
2650 Ocean Parkway #6N, Brooklyn, NY 11235
MLS# 499410Listed by: J. SIKAR REALTY $2,250,000Pending-- beds 4 baths2,520 sq. ft.
1664 East 4th Street, Brooklyn, NY 11230
MLS# 499407Listed by: CALEMINE & CO. REAL ESTATE, LL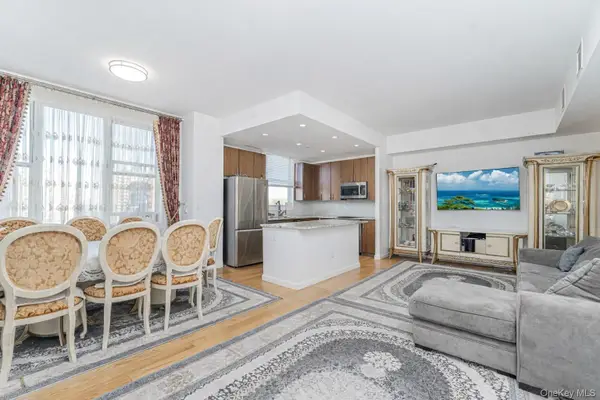 $999,000Active2 beds 2 baths1,259 sq. ft.
50 Oceana Drive W #8D, Brooklyn, NY 11235
MLS# 968420Listed by: ROBERT DEFALCO REALTY INC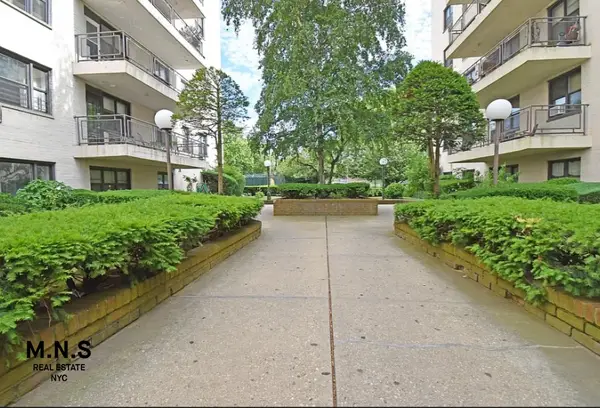 $215,000Active-- beds 1 baths
3090 Voorhies Avenue #3-M, Brooklyn, NY 11235
MLS# RLS20075594Listed by: MNS- Open Sat, 1 to 2:30pm
 $738,000Active2 beds 2 baths820 sq. ft.
339 Avenue P #2a, Brooklyn, NY 11204
MLS# 2601156Listed by: PROBASE REAL ESTATE 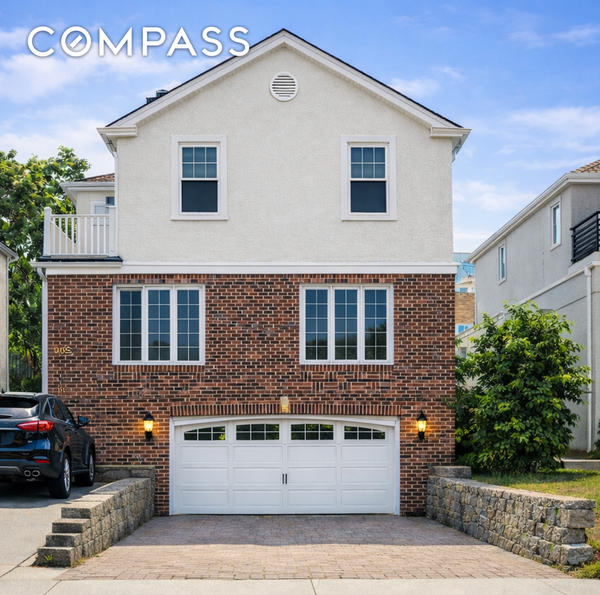 $1,895,000Active6 beds 5 baths4,000 sq. ft.
238 W End Avenue, Brooklyn, NY 11235
MLS# RLS20072153Listed by: COMPASS $1,099,000Pending4 beds 3 baths1,534 sq. ft.
1739 W 9th Street, Brooklyn, NY 11223
MLS# 967965Listed by: KELLER WILLIAMS REALTY GREATER- Open Sat, 1 to 3pm
 $1,599,000Active4 beds 3 baths3,064 sq. ft.
6322 23rd Avenue, Brooklyn, NY 11204
MLS# 499369Listed by: RE/MAX EDGE  $399,000Pending1 beds 2 baths900 sq. ft.
35 Ebony Court, Brooklyn, NY 11229
MLS# 499365Listed by: ROBERT DEFALCO REALTY $1,369,000Active6 beds 3 baths2,256 sq. ft.
2529 East 22nd Street, Brooklyn, NY 11235
MLS# 499459Listed by: ROBERT DEFALCO REALTY $270,000Active1 beds 1 baths850 sq. ft.
3130 Brighton 6th Street #6L, Brooklyn, NY 11235
MLS# 499363Listed by: SUPERIOR REALTY SERVICE $643,000Active3 beds 2 baths920 sq. ft.
2934 Brighton 4th Street #A, Brooklyn, NY 11235
MLS# 2601131Listed by: EXP REALTY $359,000Active3 beds 1 baths1,200 sq. ft.
3021 Avenue Z #2H, Brooklyn, NY 11235
MLS# 499354Listed by: KORR REALTY $624,000Active2 beds 2 baths1,120 sq. ft.
81 Dictum Ct., Brooklyn, NY 11229
MLS# 499338Listed by: RE/MAX EDGE $1,895,000Active5 beds 3 baths2,300 sq. ft.
1384 E 29th Street, Brooklyn, NY 11210
MLS# RLS20063678Listed by: COMPASS $489,000Active2 beds 1 baths1,000 sq. ft.
2260 Benson Avenue #3A, Brooklyn, NY 11214
MLS# 499262Listed by: TWOREALESTATE LLC $1,169,000Pending3 beds 2 baths1,056 sq. ft.
1951A West 9th Street, Brooklyn, NY 11223
MLS# 499318Listed by: DITOMMASO REAL ESTATE $1,799,000Active7 beds 3 baths2,897 sq. ft.
2516 Cropsey Avenue, Brooklyn, NY 11214
MLS# 499303Listed by: RE/MAX EDGE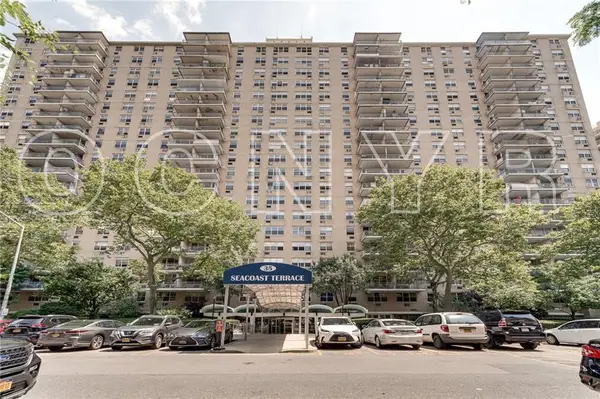 $759,000Active2 beds 2 baths1,250 sq. ft.
35 Seacoast Terrace #14C, Brooklyn, NY 11235
MLS# 499309Listed by: OCEAN COAST OF NEW YORK REALTY $1,525,000Active4 beds 3 baths2,547 sq. ft.
2249 78th Street, Brooklyn, NY 11214
MLS# 499313Listed by: TIGER REALTY- Open Sat, 11am to 12:30pm
 $1,888,888Active6 beds 4 baths4,800 sq. ft.
1770 East 12th Street, Brooklyn, NY 11229
MLS# 499397Listed by: RE/MAX EDGE  $1,499,000Active12 beds 6 baths5,544 sq. ft.
8619 23rd Avenue, Brooklyn, NY 11214
MLS# 499274Listed by: RE/MAX EDGE $735,000Active3 beds 2 baths1,200 sq. ft.
1749 East 16th Street #3A, Brooklyn, NY 11229
MLS# 499278Listed by: WILK REAL ESTATE I LLC. $615,000Active2 beds 2 baths1,087 sq. ft.
4050 Nostrand Avenue #1D, Brooklyn, NY 11235
MLS# 499284Listed by: GOLDEN REAL $859,000Pending3 beds 3 baths1,647 sq. ft.
59 Frank Court, Brooklyn, NY 11229
MLS# 499263Listed by: BHHS FILLMORE R.E. $340,000Active1 beds 1 baths875 sq. ft.
3101 Ocean Parkway #5C, Brooklyn, NY 11234
MLS# 499260Listed by: TWOREALESTATE LLC $1,969,000Active7 beds 5 baths2,432 sq. ft.
1468 East 27th Street, Brooklyn, NY 11210
MLS# 499257Listed by: BROOKLYN RESIDENTIAL R E SERV $259,999Active1 beds 1 baths650 sq. ft.
1170 Ocean Parkway #11L, Brooklyn, NY 11230
MLS# 499255Listed by: RE/MAX EDGE $599,900Active3 beds 2 baths1,300 sq. ft.
2964 Brighton 6th Street #6B, Brooklyn, NY 11235
MLS# 965106Listed by: LIBERTY CHATEAU REALTY INC $1,080,000Active2 beds 2 baths1,200 sq. ft.
2805 Ocean Parkway #8a, Brooklyn, NY 11235
MLS# 2601000Listed by: KELLER WILLIAMS REALTY STATEN ISLAND $1,299,000Pending4 beds 3 baths1,998 sq. ft.
2314 60th Street, Brooklyn, NY 11204
MLS# 499244Listed by: RE/MAX EDGE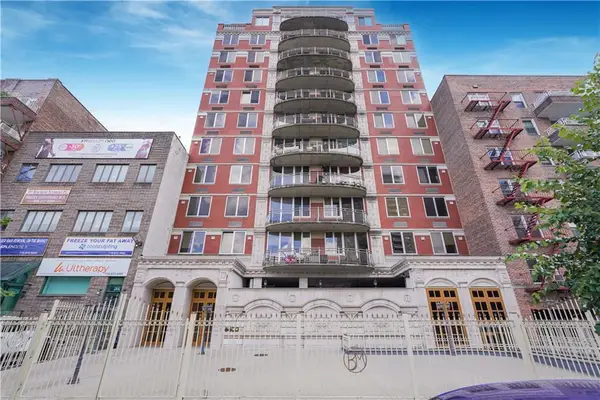 $1,080,000Active2 beds 2 baths1,200 sq. ft.
2805 Ocean Parkway #8A, Brooklyn, NY 11235
MLS# 499246Listed by: KELLER WILLIAMS REALTY STATEN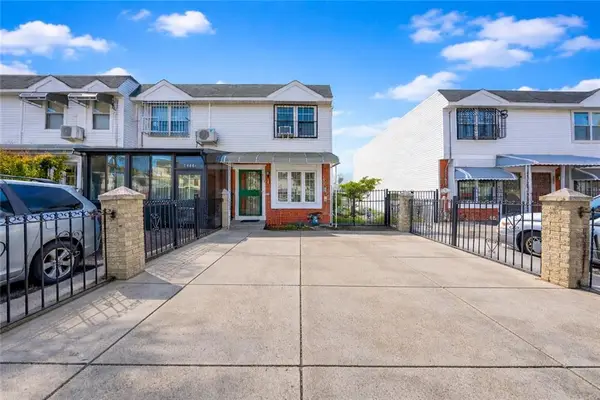 $749,000Active3 beds 2 baths1,460 sq. ft.
2842 West 27th Street, Brooklyn, NY 11224
MLS# 499243Listed by: RE/MAX EDGE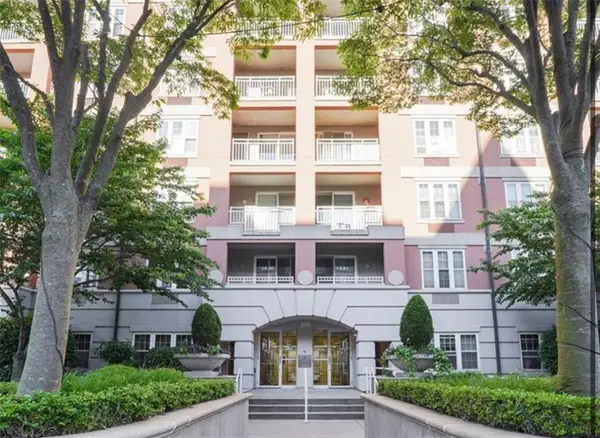 $797,000Active2 beds 1 baths900 sq. ft.
100 Oceana Drive West #4J, Brooklyn, NY 11235
MLS# 499242Listed by: GOLDEN REAL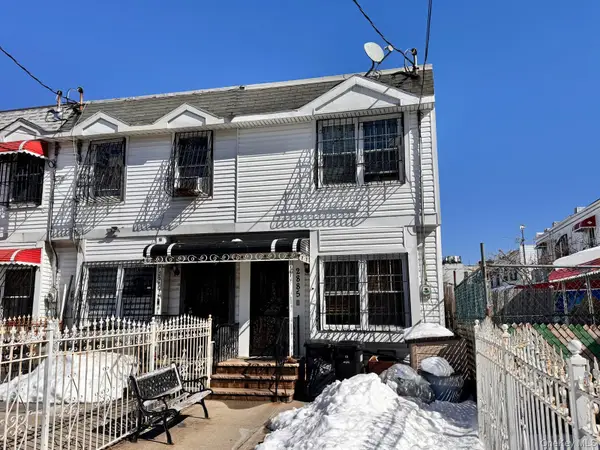 $675,000Pending3 beds 2 baths1,356 sq. ft.
2885 W 23rd Street, Brooklyn, NY 11224
MLS# 965794Listed by: CENTURY 21 MONTICELLO REALTY $349,000Active2 beds 1 baths840 sq. ft.
3235 Emmons Avenue #620, Sheepshead Bay, NY 11235
MLS# 499233Listed by: BOROUGHS REALTY, LLC. $289,000Active1 beds 1 baths667 sq. ft.
3235 Emmons Avenue #409, Brooklyn, NY 11235
MLS# 499238Listed by: BOROUGHS REALTY, LLC.- $2,249,000Active10 beds 5 baths4,000 sq. ft.
1874 E 27th Street, Brooklyn, NY 11229
MLS# RLS20074059Listed by: REAVIS DEVELOPMENT MARKETING LLC  $675,000Pending2 beds 1 baths1,000 sq. ft.
501 Surf Avenue #6R, Brooklyn, NY 11224
MLS# 499055Listed by: MAXIMILLION REALTY, INC. $335,000Active1 beds 1 baths750 sq. ft.
367 Avenue S #4F, Brooklyn, NY 11223
MLS# 499213Listed by: DREAMLIFE REALTY NEW YORK LLC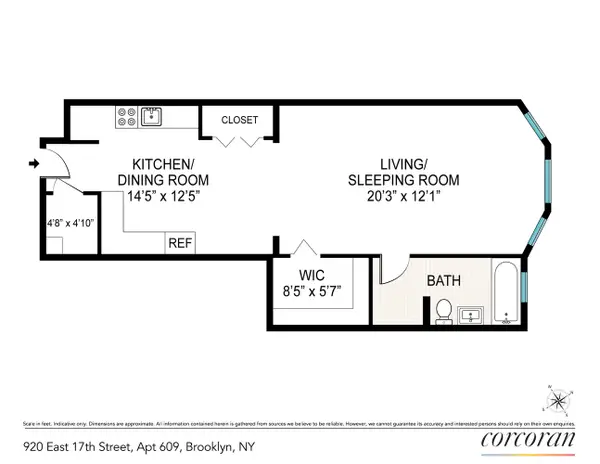 $295,000Active-- beds 1 baths
920 E 17th Street #609, Brooklyn, NY 11230
MLS# RLS20073871Listed by: CORCORAN GROUP $1,400,000Active3 beds 3 baths2,328 sq. ft.
3126 Emmons Avenue #PH1, Brooklyn, NY 11229
MLS# 499182Listed by: ILITE REALTY INC $207,000Active1 beds 1 baths750 sq. ft.
2922 Nostrand Avenue #6A, Brooklyn, NY 11229
MLS# 499207Listed by: BROOKLYN RESIDENTIAL R E SERV $199,000Active-- beds 1 baths520 sq. ft.
1530 East 8th Street #1J, Brooklyn, NY 11230
MLS# 499204Listed by: CENTURY 21 MK REALTY $449,999Active2 beds 1 baths1,100 sq. ft.
440 Neptune Avenue #4C, Brooklyn, NY 11224
MLS# 499195Listed by: AZBEL REAL ESTATE INC $749,000Active2 beds 1 baths856 sq. ft.
8629 Bay Parkway #3F, Brooklyn, NY 11214
MLS# 499183Listed by: RE/MAX EDGE $319,000Pending1 beds 1 baths864 sq. ft.
3235 Emmons Avenue #702, Brooklyn, NY 11235
MLS# 499187Listed by: BOROUGHS REALTY, LLC. $1,288,000Pending-- beds 3 baths2,812 sq. ft.
2540 West 2nd Street, Brooklyn, NY 11223
MLS# 499190Listed by: REAL BROKER NY LLC $399,900Pending2 beds 1 baths950 sq. ft.
2310 Ocean Parkway #2B, Brooklyn, NY 11223
MLS# 499065Listed by: CENTURY 21 HOMEFRONT REALTY $768,000Active2 beds 2 baths779 sq. ft.
8629 Bay Parkway #1A, Brooklyn, NY 11214
MLS# 499173Listed by: REAL BROKER NY LLC $329,000Active1 beds 1 baths850 sq. ft.
1610 Avenue P #4A, Brooklyn, NY 11229
MLS# 499175Listed by: REMAX TOP NEST REAL ESTATE $264,900Active1 beds 1 baths761 sq. ft.
3069 Brighton 6th Street #C4, Brooklyn, NY 11235
MLS# 499164Listed by: NEW YORK WEALTH REALTY LLC $949,000Pending3 beds 3 baths1,360 sq. ft.
1921 Haring Street, Brooklyn, NY 11229
MLS# 499138Listed by: BEN BAY REALTY CO $238,888Active2 beds 1 baths950 sq. ft.
2140 Knapp Street #1G, Brooklyn, NY 11229
MLS# 964567Listed by: COLDWELL BANKER RELIABLE R E $779,000Pending2 beds 2 baths1,650 sq. ft.
35 Keen Court, Brooklyn, NY 11229
MLS# 499090Listed by: RELIABLE SELL & BUY REALTY INC $260,000Active1 beds 1 baths800 sq. ft.
3235 Emmons Avenue #612, Brooklyn, NY 11235
MLS# 499148Listed by: RE/MAX EDGE $1,299,000Active2 beds 2 baths1,268 sq. ft.
50 Oceana Drive West #4B, Brooklyn, NY 11235
MLS# 499145Listed by: GOLDEN REAL $310,000Active1 beds 1 baths850 sq. ft.
2645 Homecrest Avenue #4C, Brooklyn, NY 11234
MLS# RLS20073395Listed by: LIVING NEW YORK $235,000Active-- beds 1 baths480 sq. ft.
1580 East 13th Street #1D, Brooklyn, NY 11230
MLS# 499105Listed by: HIGH CLASS REALTY SB LLC. $1,300,000Active6 beds 4 baths1,855 sq. ft.
2601 Avenue X, Brooklyn, NY 11235
MLS# 499128Listed by: MOMENTUM REAL ESTATE LLC $2,475,000Active8 beds 5 baths3,288 sq. ft.
2369 West Street, Brooklyn, NY 11223
MLS# 499131Listed by: CENTURY 21 MK REALTY $395,000Active2 beds 1 baths1,100 sq. ft.
2685 East 7th Street #6M, Brooklyn, NY 11235
MLS# 499134Listed by: MAXIMILLION REALTY, INC. $1,129,000Active4 beds 3 baths2,070 sq. ft.
2729 Brown Street, Brooklyn, NY 11235
MLS# 499123Listed by: ILITE REALTY INC $790,000Active3 beds 2 baths1,376 sq. ft.
8895 26th Avenue #5A, Brooklyn, NY 11214
MLS# 499114Listed by: TIGER REALTY $949,000Pending3 beds 2 baths1,776 sq. ft.
2011 East 27th Street, Brooklyn, NY 11229
MLS# 499110Listed by: KORR REALTY $1,099,000Active3 beds 2 baths1,064 sq. ft.
1819 West 3rd Street, Brooklyn, NY 11223
MLS# 499096Listed by: AVENUE REALTY NY LLC $999,000Active2 beds 2 baths1,259 sq. ft.
50 Oceana Drive E #8d, Brooklyn, NY 11235
MLS# 2600897Listed by: ROBERT DEFALCO REALTY, INC. $1,699,000Active3 beds 3 baths1,734 sq. ft.
50 Oceana Drive W #3d, Brooklyn, NY 11235
MLS# 2600894Listed by: ROBERT DEFALCO REALTY, INC. $879,000Active2 beds 2 baths1,069 sq. ft.
70 Oceana Drive West #5E, Brooklyn, NY 11235
MLS# 499093Listed by: GOLDEN REAL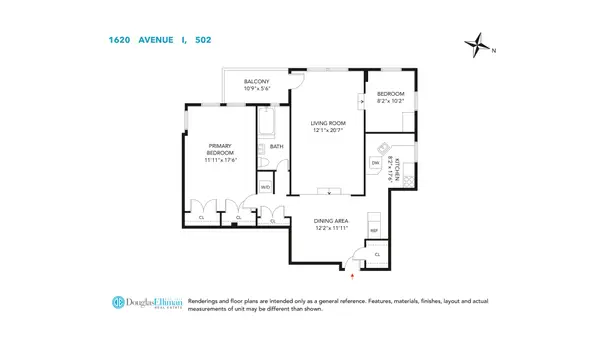 $439,000Active2 beds 1 baths
1620 Ave I #502, Brooklyn, NY 11230
MLS# RLS20072921Listed by: DOUGLAS ELLIMAN REAL ESTATE $475,000Pending2 beds 1 baths
2915 W 5th Street #20F, Brooklyn, NY 11224
MLS# RLS20072896Listed by: CORCORAN GROUP $495,000Active2 beds 1 baths
920 E 17th Street #212, Brooklyn, NY 11230
MLS# RLS20072837Listed by: 74 WEST REAL ESTATE $1,395,000Active2 beds 2 baths1,660 sq. ft.
1401 Ocean Avenue #11A, Brooklyn, NY 11230
MLS# 499072Listed by: BEHFAR TEAM, LLC $1,699,000Active3 beds -- baths2,900 sq. ft.
123 Avenue J, Brooklyn, NY 11230
MLS# 499079Listed by: OSTPRO REALTY LLC $2,750,000Active-- beds 3 baths3,481 sq. ft.
1460 East 4th Street, Brooklyn, NY 11230
MLS# 498996Listed by: TIGER REALTY $1,200,000Active8 beds 4 baths2,737 sq. ft.
3711 Sea Gate Avenue, Brooklyn, NY 11224
MLS# 499057Listed by: ILITE REALTY INC $979,000Active2 beds 2 baths1,238 sq. ft.
60 Oceana Drive West #5B, Brooklyn, NY 11235
MLS# 499074Listed by: GOLDEN REAL- New
 $389,000Active3 beds 1 baths1,020 sq. ft.
3105 Brighton 3rd Street #1K, Brooklyn, NY 11235
MLS# 499883Listed by: RELIABLE SELL & BUY REALTY INC  $459,000Active2 beds 1 baths1,100 sq. ft.
2425 Kings Highway #E10, Brooklyn, NY 11229
MLS# 499027Listed by: PECORARO REALTY OF NYC, LLC $449,000Active2 beds 1 baths990 sq. ft.
14 Cass Place #3A, Brooklyn, NY 11235
MLS# 499059Listed by: EXP REALTY BKNY $195,000Pending-- beds 1 baths500 sq. ft.
14 Cass Place #6E, Brooklyn, NY 11235
MLS# 499052Listed by: BRIGHT HORIZONS REALTY $229,000Active1 beds 1 baths800 sq. ft.
3100 Brighton 3rd Street #6F, Brooklyn, NY 11235
MLS# 499049Listed by: DIAMOND REAL INC $1,699,000Active6 beds 4 baths2,453 sq. ft.
1049 East 18th Street, Brooklyn, NY 11230
MLS# 499048Listed by: ACCORD REAL ESTATE GROUP $425,000Active2 beds 2 baths1,100 sq. ft.
2942 West 5th Street #2J, Brooklyn, NY 11224
MLS# 499043Listed by: J. SIKAR REALTY $699,000Pending2 beds 2 baths800 sq. ft.
2684 East 12th Street, Brooklyn, NY 11235
MLS# 499036Listed by: CENTURY 21 MK REALTY- Open Sat, 1 to 3pm
 $420,000Active1 beds 1 baths684 sq. ft.
3034 Brighton 1st Street #1, Brooklyn, NY 11235
MLS# 499039Listed by: EQUITY ESSENTIALS LLC - $299,000Pending1 beds 1 baths
1530 E 8th Street #6F, Brooklyn, NY 11230
MLS# RLS20072320Listed by: CORCORAN GROUP  $199,000Active-- beds 1 baths510 sq. ft.
1478 East 28th Street #1P, Brooklyn, NY 11210
MLS# 499034Listed by: REAL BROKER NY LLC $479,998Pending2 beds 2 baths1,119 sq. ft.
448 Neptune Avenue #16K, Brooklyn, NY 11224
MLS# RLS20072269Listed by: COMPASS $2,299,000Pending9 beds 6 baths
1324 Avenue N, Brooklyn, NY 11230
MLS# 499026Listed by: BEHFAR TEAM, LLC $799,000Pending3 beds 2 baths1,227 sq. ft.
1440 W 4th Street #3C, Brooklyn, NY 11204
MLS# RLS20072208Listed by: CORCORAN GROUP $3,650,000Active4 beds 4 baths2,482 sq. ft.
1815 East 3rd Street, Brooklyn, NY 11223
MLS# 499022Listed by: CENTURY 21 MK REALTY $4,588,888Active-- beds 22 baths17,968 sq. ft.
1684 West 2nd Street, Brooklyn, NY 11223
MLS# 499020Listed by: ROBERT DEFALCO REALTY- Open Sat, 10:30 to 11am
 $1,550,000Active7 beds 3 baths3,840 sq. ft.
2487 East 21st Street, Brooklyn, NY 11235
MLS# 499008Listed by: MOMENTUM REAL ESTATE LLC  $1,550,000Active6 beds 4 baths3,840 sq. ft.
2483 East 21st Street, Brooklyn, NY 11235
MLS# 499006Listed by: MOMENTUM REAL ESTATE LLC $210,000Active-- beds 1 baths480 sq. ft.
2606 Cropsey Avenue #1A, Brooklyn, NY 11214
MLS# 498984Listed by: CONTINENT REALTY LLC $3,180,000Active-- beds 3 baths2,135 sq. ft.
15 Van Sicklen Street, Brooklyn, NY 11223
MLS# 498839Listed by: RE/MAX REAL ESTATE PROFESSIONA $619,000Active2 beds 2 baths864 sq. ft.
1838 West 13th Street, Brooklyn, NY 11223
MLS# 961342Listed by: ROBERT DEFALCO REALTY INC
Local realty services provided by:CENTURY 21 Awaye Realty, CENTURY 21 Homefront, CENTURY 21 Stoeckeler Real Estate
This information is not verified for authenticity or accuracy and is not guaranteed and may not reflect all real estate activity in the market. © 2026 The Real Estate Board of New York, Inc., All rights reserved. RLS Data display by Coldwell Banker Warburg This advertisement does not suggest that the broker has a listing in this property or properties or that any property is currently available.
Popular neighborhoods near Southern Brooklyn, Brooklyn, NY
Zip codes near Southern Brooklyn, Brooklyn, NY
- 11203 homes for sale
- 11204 homes for sale
- 11209 homes for sale
- 11210 homes for sale
- 11214 homes for sale
- 11215 homes for sale
- 11218 homes for sale
- 11219 homes for sale
- 11220 homes for sale
- 11223 homes for sale
- 11224 homes for sale
- 11225 homes for sale
- 11226 homes for sale
- 11228 homes for sale
- 11229 homes for sale
- 11230 homes for sale
- 11232 homes for sale
- 11234 homes for sale
- 11235 homes for sale
- 11236 homes for sale
Counties near Southern Brooklyn, Brooklyn, NY
- Bergen County homes for sale
- Bronx County homes for sale
- Essex County homes for sale
- Hudson County homes for sale
- Hunterdon County homes for sale
- Kings County homes for sale
- Mercer County homes for sale
- Middlesex County homes for sale
- Monmouth County homes for sale
- Morris County homes for sale
- Nassau County homes for sale
- New York County homes for sale
- Passaic County homes for sale
- Queens County homes for sale
- Richmond County homes for sale
- Rockland County homes for sale
- Somerset County homes for sale
- Sussex County homes for sale
- Union County homes for sale
- Westchester County homes for sale
Protect your home and budget from life's surprises with an Assurant Home Warranty, backed by a partner that supports you through every step of homeownership. Explore Plans.
©2026 Century 21 Real Estate LLC. All rights reserved. CENTURY 21®, the CENTURY 21 Logo and C21® are service marks owned by Century 21 Real Estate LLC. Century 21 Real Estate LLC fully supports the principles of the Fair Housing Act and the Equal Opportunity Act. Each office is independently owned and operated. Listing information is deemed reliable but not guaranteed accurate.