- Apple Hollow, Clarksville homes for sale
- Bordeaux, Nashville homes for sale
- Brick Church Bellshire, Whites Creek homes for sale
- Connell, Goodlettsville homes for sale
- Enchanted Hills, Nashville homes for sale
- Farmington, Clarksville homes for sale
- Haynes Area, Nashville homes for sale
- Historic Old Hickory Village, Old Hickory homes for sale
- Holly Point, Clarksville homes for sale
- Joelton, Joelton homes for sale
- Madison, Madison homes for sale
- Marrowbone, Joelton homes for sale
- Parkwood, Goodlettsville homes for sale
- Poplar Hill, Clarksville homes for sale
- Scottsboro, Nashville homes for sale
- Stones Manor, Clarksville homes for sale
- The Legacy, Springfield homes for sale
- Treefield Woods, Clarksville homes for sale
- Treppard Heights, Nashville homes for sale
- Trinity RV Park, Nashville homes for sale
Springfield, TN - homes for sale
196 of 196 results displayed
- Coming Soon
 $299,000Coming Soon2 beds 2 baths
110 Dimaggio Dr, Springfield, TN 37172
MLS# 3247157Listed by: SIXONEFIVE REAL ESTATE ADVISORS - New
 $334,900Active3 beds 3 baths1,300 sq. ft.
795 19th Ave W, Springfield, TN 37172
MLS# 3247250Listed by: COPE ASSOCIATES REALTY & AUCTION, LLC - New
 $184,900Active2 beds 1 baths720 sq. ft.
223 4th Ave E, Springfield, TN 37172
MLS# 3247252Listed by: COPE ASSOCIATES REALTY & AUCTION, LLC - Coming Soon
 $384,000Coming Soon3 beds 3 baths
174 Fieldstone Ln, Springfield, TN 37172
MLS# 3247275Listed by: VISION REALTY PARTNERS, LLC - New
 $395,990Active2 beds 3 baths2,056 sq. ft.
482 W Foxrun, Springfield, TN 37172
MLS# 3246990Listed by: DSLD HOMES (SOUTHEAST), LLC - New
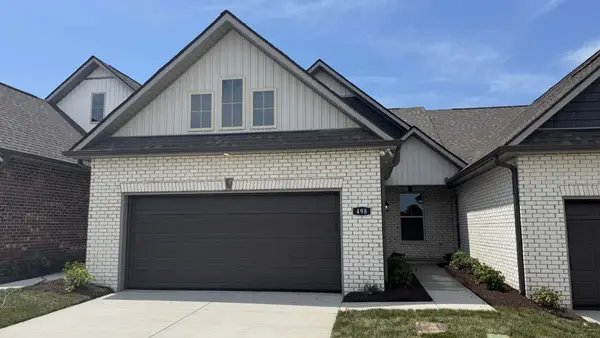 $349,990Active3 beds 2 baths1,580 sq. ft.
498 W Foxrun, Springfield, TN 37172
MLS# 3246992Listed by: DSLD HOMES (SOUTHEAST), LLC - New
 $349,990Active3 beds 2 baths1,580 sq. ft.
504 W Foxrun, Springfield, TN 37172
MLS# 3247006Listed by: DSLD HOMES (SOUTHEAST), LLC - New
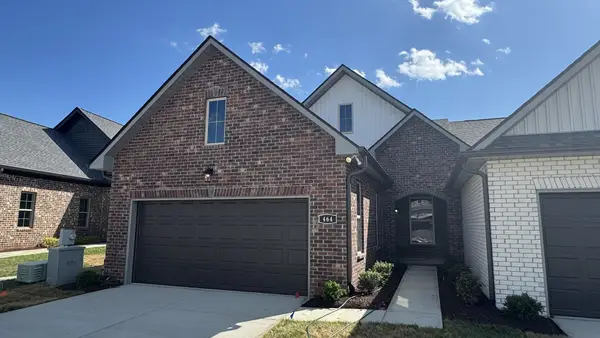 $384,990Active2 beds 3 baths2,056 sq. ft.
464 W Foxrun, Springfield, TN 37172
MLS# 3246862Listed by: DSLD HOMES (SOUTHEAST), LLC - Coming Soon
 $0Coming Soon3 beds 3 baths
4849 Kinneys School Rd, Springfield, TN 37172
MLS# 3246097Listed by: BLUEGRASS REALTY & PROPERTY MANAGEMENT, INC - New
 $459,900Active3 beds 2 baths2,216 sq. ft.
848 Sycamore Dr, Springfield, TN 37172
MLS# 3246150Listed by: LEGACY SIGNATURE PROPERTIES, LLC - New
 $265,000Active2 beds 1 baths1,016 sq. ft.
1508 S Main St, Springfield, TN 37172
MLS# 3245657Listed by: CENTURY 21 LANDMARK REALTY - New
 $318,000Active3 beds 2 baths1,270 sq. ft.
518 Polo Ln, Springfield, TN 37172
MLS# 3245442Listed by: SOUTHERN ROOTS PROPERTIES - New
 $69,900Active0.13 Acres
2089 Leota St, Springfield, TN 37172
MLS# 3245426Listed by: CENTURY 21 PREMIER - New
 $250,000Active3 beds 2 baths1,050 sq. ft.
914 16th Ave E, Springfield, TN 37172
MLS# 3243785Listed by: PURPOSE REALTY & AUCTION - New
 $299,900Active2 beds 2 baths1,498 sq. ft.
141 Dimaggio Dr, Springfield, TN 37172
MLS# 3243795Listed by: RE/MAX 1ST CHOICE - New
 $425,000Active4 beds 2 baths1,911 sq. ft.
2075 Nikki Dr, Springfield, TN 37172
MLS# 3243610Listed by: SIMPLIHOM - New
 $650,000Active3 beds 3 baths3,689 sq. ft.
1296 Lawrence Ln, Springfield, TN 37172
MLS# 3243048Listed by: THE ANDYSOLDIT TEAM KELLER WILLIAMS - Coming Soon
 $319,900Coming Soon3 beds 2 baths
3166 Burr Rd, Springfield, TN 37172
MLS# 3242891Listed by: RE/MAX 1ST CHOICE  $425,000Active4 beds 3 baths2,908 sq. ft.
1503 5th Ave W, Springfield, TN 37172
MLS# 3242060Listed by: LEGACY SIGNATURE PROPERTIES, LLC $635,000Active3 beds 3 baths3,364 sq. ft.
4319 Nicks Dr, Springfield, TN 37172
MLS# 3239785Listed by: EXIT REAL ESTATE SOLUTIONS $262,500Active3 beds 2 baths1,118 sq. ft.
314 Reeves Ct, Springfield, TN 37172
MLS# 3234773Listed by: COLDWELL BANKER CONROY, MARABLE & HOLLEMAN $259,900Active3 beds 2 baths1,296 sq. ft.
824 Pitt Ave, Springfield, TN 37172
MLS# 3234080Listed by: BERNIE GALLERANI REAL ESTATE
 $479,900Active6 beds 3 baths3,574 sq. ft.
5528 Highway 76 E, Springfield, TN 37172
MLS# 3233823Listed by: CENTURY 21 LANDMARK REALTY $575,000Active3 beds 3 baths2,996 sq. ft.
100 Macintosh Dr, Springfield, TN 37172
MLS# 3233725Listed by: THE ANDYSOLDIT TEAM KELLER WILLIAMS $332,500Active2 beds 2 baths1,452 sq. ft.
6070 Hwy 49e, Springfield, TN 37172
MLS# 3233770Listed by: RE/MAX CHOICE PROPERTIES $280,000Pending3 beds 2 baths1,165 sq. ft.
105 Brookside Pt, Springfield, TN 37172
MLS# 3232960Listed by: THE ANDYSOLDIT TEAM KELLER WILLIAMS $329,900Active3 beds 2 baths1,320 sq. ft.
1062 Berra Dr, Springfield, TN 37172
MLS# 3232592Listed by: PAUL HOLDER REALTY & AUCTION $549,900Active3 beds 2 baths2,026 sq. ft.
2094 Beverly Ct, Springfield, TN 37172
MLS# 3232523Listed by: HAVEN REAL ESTATE $460,000Pending3 beds 2 baths1,907 sq. ft.
4003 S Windsor Ct, Springfield, TN 37172
MLS# 3231863Listed by: KELLER WILLIAMS REALTY $449,900Active3 beds 2 baths1,551 sq. ft.
22153 Highway 49 E, Springfield, TN 37172
MLS# 3231679Listed by: SIMPLIHOM $365,000Active3 beds 2 baths1,459 sq. ft.
738 Sycamore Dr, Springfield, TN 37172
MLS# 3231472Listed by: SIMPLIHOM $349,900Active3 beds 3 baths1,610 sq. ft.
826 Cedar Ln, Springfield, TN 37172
MLS# 3230674Listed by: WEICHERT, REALTORS - THE ANDREWS GROUP $0Pending3 beds 2 baths2,361 sq. ft.
105 3rd Ave E, Springfield, TN 37172
MLS# 3230096Listed by: COPE ASSOCIATES REALTY & AUCTION, LLC $819,900Active3 beds 3 baths4,195 sq. ft.
1224 Hangar Rd, Springfield, TN 37172
MLS# 3230229Listed by: SIMPLIHOM $245,000Active3 beds 2 baths1,056 sq. ft.
303 15th Ave W, Springfield, TN 37172
MLS# 3229922Listed by: SIMPLIHOM $375,000Active3 beds 2 baths1,559 sq. ft.
1015 Shaylee Dr, Springfield, TN 37172
MLS# 3228417Listed by: ADVANTAGE PROPERTIES, LLC $579,900Active3 beds 2 baths2,100 sq. ft.
4323 South Garrett, Springfield, TN 37172
MLS# 3228334Listed by: COPE ASSOCIATES REALTY & AUCTION, LLC $1,495,000Active4 beds 6 baths6,153 sq. ft.
100 Qualls Ct, Springfield, TN 37172
MLS# 3225784Listed by: RE/MAX CHOICE PROPERTIES $350,000Active3 beds 2 baths2,065 sq. ft.
153 Foxrun, Springfield, TN 37172
MLS# 3225866Listed by: LEGACY SIGNATURE PROPERTIES, LLC $2,850,000Active4 beds -- baths6,682 sq. ft.
1421 Lawrence Ln, Springfield, TN 37172
MLS# 3225626Listed by: AT HOME REALTY $125,000Active3 beds 1 baths1,500 sq. ft.
852 N Brown St, Springfield, TN 37172
MLS# 3225451Listed by: INSIGHT REALTY $299,900Active3 beds 2 baths1,192 sq. ft.
1804 Park St, Springfield, TN 37172
MLS# 3225197Listed by: LPT REALTY LLC $499,000Active4 beds 3 baths2,250 sq. ft.
355 Marion Ct, Springfield, TN 37172
MLS# 3225266Listed by: RE/MAX 1ST CHOICE $384,900Active3 beds 2 baths2,076 sq. ft.
115 N Main St, Springfield, TN 37172
MLS# 3220513Listed by: COPE ASSOCIATES REALTY & AUCTION, LLC $299,000Active3 beds 2 baths1,636 sq. ft.
162 Sleepy Hollow Dr, Springfield, TN 37172
MLS# 3220022Listed by: COMPASS TENNESSEE, LLC $1,250,000Active3 beds 4 baths4,086 sq. ft.
5833 Highway 76 E, Springfield, TN 37172
MLS# 3218274Listed by: MARK SPAIN REAL ESTATE- Coming Soon
 $680,000Coming Soon3 beds 3 baths
6264 Highway 49 E, Springfield, TN 37172
MLS# 3217979Listed by: EXIT REAL ESTATE SOLUTIONS  $1,350,000Active2 beds 1 baths642 sq. ft.
721 17th Ave W, Springfield, TN 37172
MLS# 3218121Listed by: CENTURY 21 LANDMARK REALTY $1,350,000Active1 beds 1 baths712 sq. ft.
304 20th Ave E, Springfield, TN 37172
MLS# 3218122Listed by: CENTURY 21 LANDMARK REALTY $1,350,000Active2 beds 1 baths1,016 sq. ft.
1508 S Main St, Springfield, TN 37172
MLS# 3218124Listed by: CENTURY 21 LANDMARK REALTY- Coming Soon
 $297,500Coming Soon2 beds 2 baths
4355 S Garrett Rd, Springfield, TN 37172
MLS# 3217103Listed by: LEGACY SIGNATURE PROPERTIES, LLC  $289,900Active2 beds 2 baths1,760 sq. ft.
2204 Ruth St #9, Springfield, TN 37172
MLS# 3216900Listed by: COLDWELL BANKER SOUTHERN REALTY $312,000Active3 beds 3 baths1,360 sq. ft.
414 21st Ave W, Springfield, TN 37172
MLS# 3216557Listed by: GREENBRIER REALTY COMPANY $0Pending-- beds -- baths
0 Hwy 431 N, Springfield, TN 37172
MLS# 3006153Listed by: BLUEGRASS REALTY & PROPERTY MANAGEMENT, INC $249,000Active3 beds 2 baths1,156 sq. ft.
511 Hayes St, Springfield, TN 37172
MLS# 3215884Listed by: VAULT REALTY LLC $895,000Active4 beds 4 baths3,227 sq. ft.
1191 Hangar Rd, Springfield, TN 37172
MLS# 3215923Listed by: RE/MAX CHOICE PROPERTIES $379,000Active3 beds 2 baths1,525 sq. ft.
207 Walnut St N, Springfield, TN 37172
MLS# 3215140Listed by: EXIT REALTY REFINED- Open Sun, 2 to 4pm
 $339,990Active3 beds 2 baths1,580 sq. ft.
470 W Foxrun, Springfield, TN 37172
MLS# 3215165Listed by: DSLD HOMES (SOUTHEAST), LLC  $429,000Active3 beds 3 baths2,409 sq. ft.
113 N Oak St, Springfield, TN 37172
MLS# 3214633Listed by: MUTTZ REALTY, LLC $298,000Active4 beds 3 baths1,512 sq. ft.
704 Perry Dr, Springfield, TN 37172
MLS# 3214004Listed by: SOUTHERN ROOTS PROPERTIES $320,000Active3 beds 2 baths1,820 sq. ft.
2317 Woodmont Dr, Springfield, TN 37172
MLS# 3210806Listed by: CASON POINTE REAL ESTATE LLC $259,900Active3 beds 2 baths1,050 sq. ft.
1150 17th Ave E, Springfield, TN 37172
MLS# 3213441Listed by: COLDWELL BANKER CONROY, MARABLE & HOLLEMAN $609,900Active4 beds 4 baths2,840 sq. ft.
331 Tivoli Trl, Springfield, TN 37172
MLS# 3211273Listed by: COPE ASSOCIATES REALTY & AUCTION, LLC $775,000Active4 beds 5 baths5,243 sq. ft.
402 Fairway Trl, Springfield, TN 37172
MLS# 3211155Listed by: SIXONEFIVE REAL ESTATE ADVISORS $284,900Active3 beds 2 baths1,664 sq. ft.
442 Crescent Dr, Springfield, TN 37172
MLS# 3208124Listed by: SEARCY REALTY & AUCTION $1,200,000Active5.8 Acres
844 20th Ave W, Springfield, TN 37172
MLS# 3207089Listed by: RE/MAX 1ST CHOICE $325,000Active3 beds 2 baths1,285 sq. ft.
452 Golf Club Ln, Springfield, TN 37172
MLS# 3206908Listed by: ONE STOP REALTY AND AUCTION $255,000Active3 beds 2 baths1,008 sq. ft.
2607 Landrum Ct Lot 7, Springfield, TN 37172
MLS# 3198130Listed by: EXP REALTY $289,900Active2.52 Acres
5165 Highway 41 N, Springfield, TN 37172
MLS# 3191583Listed by: SOUTHERN ROOTS PROPERTIES $319,999Active3 beds 2 baths1,144 sq. ft.
2718 Driftwood Dr, Springfield, TN 37172
MLS# 3193702Listed by: REYES REAL ESTATE GROUP $329,500Active3 beds 2 baths1,700 sq. ft.
113 Brookview Ct, Springfield, TN 37172
MLS# 3193015Listed by: EXIT REAL ESTATE SOLUTIONS $438,000Active4 beds 2 baths1,743 sq. ft.
308 Walnut St, Springfield, TN 37172
MLS# 3190355Listed by: CENTURY 21 LANDMARK REALTY $369,900Active3 beds 2 baths1,540 sq. ft.
3030 Highway 41 S, Springfield, TN 37172
MLS# 3189627Listed by: COPE ASSOCIATES REALTY & AUCTION, LLC $344,899Active3 beds 2 baths1,457 sq. ft.
189 Julia Ann Ct, Springfield, TN 37172
MLS# 3186775Listed by: BENCHMARK REALTY, LLC $429,900Active3 beds 4 baths1,875 sq. ft.
211 General Forrest Dr, Springfield, TN 37172
MLS# 3186592Listed by: EXIT PRIME REALTY $299,900Active3 beds 2 baths1,300 sq. ft.
1511 Cheatham St, Springfield, TN 37172
MLS# 3185903Listed by: SOUTHERN ROOTS PROPERTIES $436,990Active3 beds 2 baths1,556 sq. ft.
2060 Beverly Ct, Springfield, TN 37172
MLS# 3186526Listed by: HAVEN REAL ESTATE $279,900Active3 beds 2 baths1,230 sq. ft.
420 Durrett St, Springfield, TN 37172
MLS# 3185879Listed by: SIMPLIHOM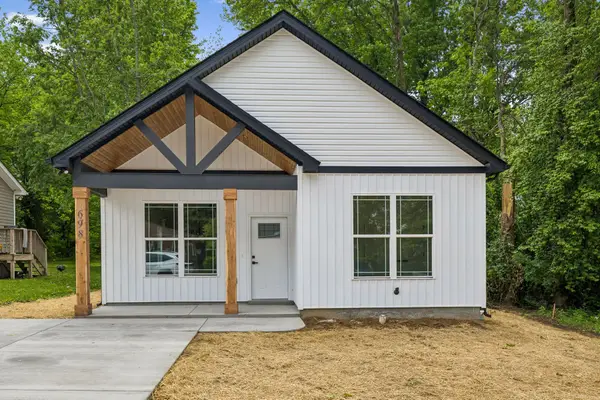 $299,900Active3 beds 2 baths1,300 sq. ft.
698 19th Ave W, Springfield, TN 37172
MLS# 3185731Listed by: SOUTHERN ROOTS PROPERTIES $215,000Pending2 beds 2 baths1,036 sq. ft.
122 Pepper Grove Dr, Springfield, TN 37172
MLS# 3185775Listed by: THE ANDYSOLDIT TEAM KELLER WILLIAMS $379,900Active3 beds 2 baths1,725 sq. ft.
210 S Sequoia Dr, Springfield, TN 37172
MLS# 3184990Listed by: EXIT REALTY GARDEN GATE TEAM $399,900Active4 beds 4 baths2,270 sq. ft.
1704 Woodside Dr, Springfield, TN 37172
MLS# 3184454Listed by: KELLER WILLIAMS REALTY $299,900Active2 beds 1 baths1,316 sq. ft.
1507 5th Ave W, Springfield, TN 37172
MLS# 3184524Listed by: AT HOME REALTY $365,000Active3 beds 2 baths1,310 sq. ft.
1180 Shaylee Dr, Springfield, TN 37172
MLS# 3184687Listed by: BENCHMARK REALTY, LLC $339,900Active3 beds 1 baths1,570 sq. ft.
703 5th Ave W, Springfield, TN 37172
MLS# 3183693Listed by: EXIT PRIME REALTY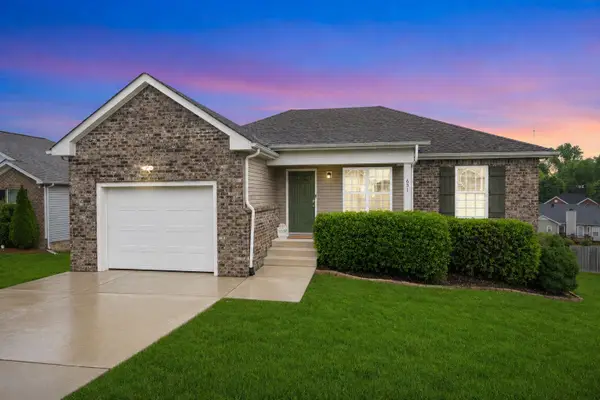 $309,900Active3 beds 2 baths1,321 sq. ft.
631 Berry Cir, Springfield, TN 37172
MLS# 3183710Listed by: SIMPLIHOM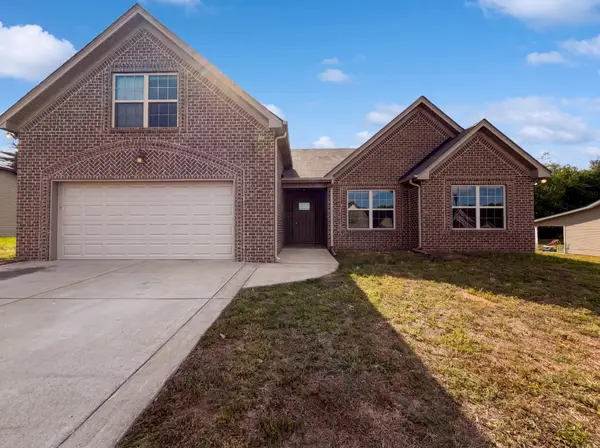 $360,000Active3 beds 2 baths2,062 sq. ft.
447 Golf Club Ln, Springfield, TN 37172
MLS# 3183406Listed by: OPENDOOR BROKERAGE, LLC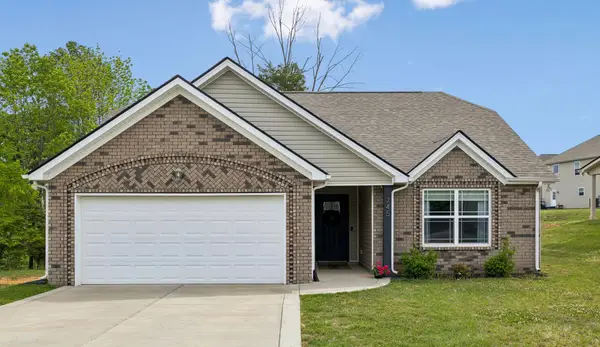 $344,000Active3 beds 2 baths1,320 sq. ft.
745 Cedar Ln, Springfield, TN 37172
MLS# 3183012Listed by: THE REAL ESTATE COLLECTIVE - COOKEVILLE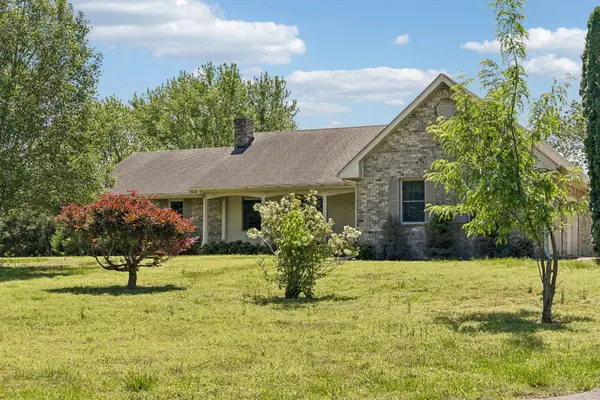 $699,500Active4 beds -- baths2,105 sq. ft.
1690 Lawrence Ln, Springfield, TN 37172
MLS# 3182049Listed by: GREENBRIER REALTY COMPANY $299,000Active3 beds 1 baths1,489 sq. ft.
201 Pleasant Hill Dr, Springfield, TN 37172
MLS# 3181730Listed by: TRISTAR ELITE REALTY $314,900Active3 beds 3 baths1,500 sq. ft.
203 22nd Ave E, Springfield, TN 37172
MLS# 3180702Listed by: GREENBRIER REALTY COMPANY $529,440Active4 beds 3 baths3,561 sq. ft.
325 Clearview Dr, Springfield, TN 37172
MLS# 3180506Listed by: HODGES AND FOOSHEE REALTY INC. $425,000Pending4 beds 3 baths2,280 sq. ft.
2074 Morgan Ct, Springfield, TN 37172
MLS# 3180489Listed by: THE ANDYSOLDIT TEAM KELLER WILLIAMS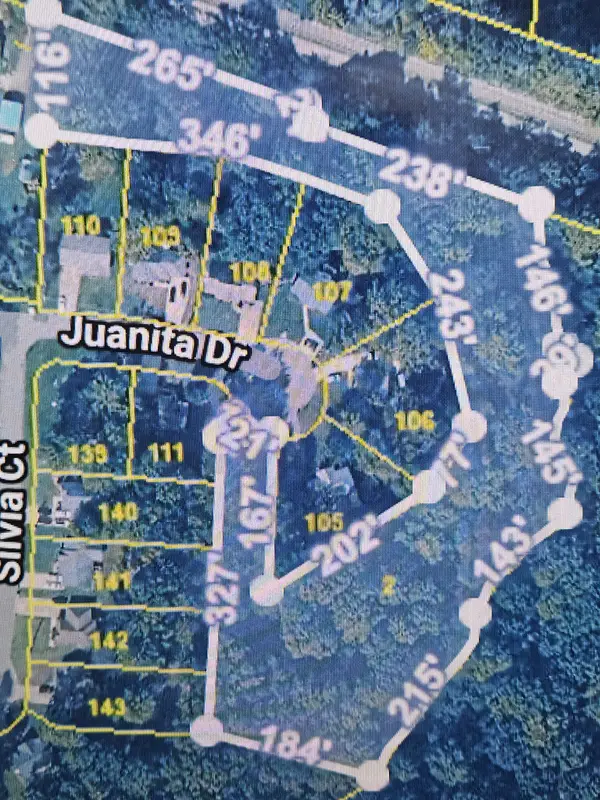 $225,000Active3.16 Acres
212 Juanita Dr, Springfield, TN 37172
MLS# 3178397Listed by: BLUEGRASS REALTY & PROPERTY MANAGEMENT, INC $315,000Active3 beds 3 baths1,658 sq. ft.
579 Faye Aly, Springfield, TN 37172
MLS# 3177866Listed by: WILLIAM WILSON HOMES $275,000Active3 beds 2 baths1,145 sq. ft.
2636 Queen Anne Ct, Springfield, TN 37172
MLS# 3176673Listed by: EXP REALTY $249,900Active3 beds 2 baths1,120 sq. ft.
2607 Landrum Ct #16, Springfield, TN 37172
MLS# 3097673Listed by: EXP REALTY $247,500Active3 beds 2 baths1,120 sq. ft.
2607 Landrum Ct #10, Springfield, TN 37172
MLS# 3117925Listed by: EXP REALTY $415,000Active3 beds 3 baths2,520 sq. ft.
217 Timberlake Dr, Springfield, TN 37172
MLS# 3175998Listed by: COMPASS $435,000Active4 beds 2 baths2,411 sq. ft.
674 Lakeside Dr, Springfield, TN 37172
MLS# 3176045Listed by: PURPOSE REALTY & AUCTION $269,900Active3 beds 1 baths1,025 sq. ft.
709 Perry Dr, Springfield, TN 37172
MLS# 3175844Listed by: EXP REALTY $335,000Active3 beds 3 baths1,793 sq. ft.
419 N Mabel St, Springfield, TN 37172
MLS# 3171117Listed by: SOUTHERN ROOTS PROPERTIES $1,189,900Active5 beds 5 baths4,756 sq. ft.
835 Savannah West Ct, Springfield, TN 37172
MLS# 3171287Listed by: COPE ASSOCIATES REALTY & AUCTION, LLC $319,900Active3 beds 1 baths1,050 sq. ft.
102 Cofer Dr, Springfield, TN 37172
MLS# 3170006Listed by: APEX VENTURES, INC. $524,999Active3 beds 2 baths2,192 sq. ft.
6716 Old Highway 431, Springfield, TN 37172
MLS# 3169342Listed by: OPTI REALTY $351,234Active2 beds 2 baths1,580 sq. ft.
565 W Foxrun, Springfield, TN 37172
MLS# 3168374Listed by: DSLD HOMES (SOUTHEAST), LLC $298,900Active3 beds 3 baths1,706 sq. ft.
129 Dimaggio Dr, Springfield, TN 37172
MLS# 3168216Listed by: BENCHMARK REALTY, LLC $415,000Active3 beds 2 baths1,662 sq. ft.
412 W Foxrun, Springfield, TN 37172
MLS# 3167017Listed by: ZACH TAYLOR REAL ESTATE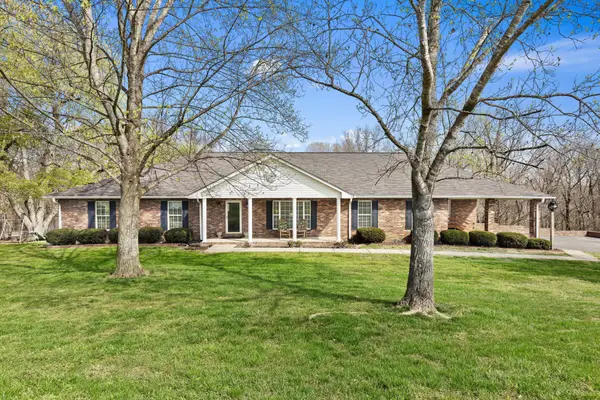 $599,900Pending3 beds 3 baths2,800 sq. ft.
7363 New Chapel Rd, Springfield, TN 37172
MLS# 3166472Listed by: APEX REALTY & AUCTION, LLC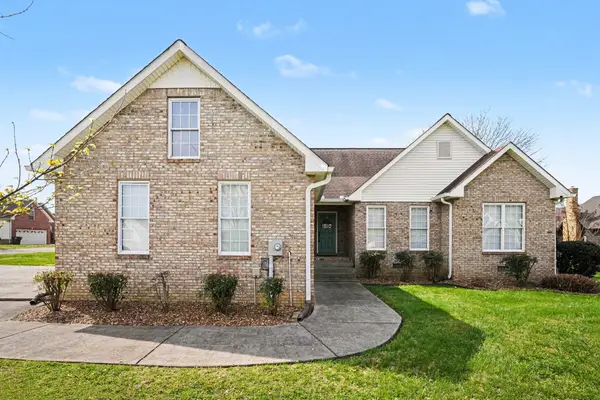 $377,500Active4 beds 3 baths2,086 sq. ft.
161 Fieldstone Ln, Springfield, TN 37172
MLS# 3166231Listed by: THE ANDYSOLDIT TEAM KELLER WILLIAMS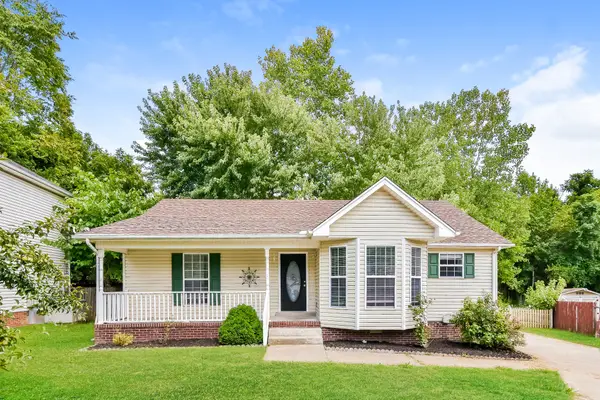 $280,000Active3 beds 2 baths1,222 sq. ft.
649 Laramie Dr, Springfield, TN 37172
MLS# 3164669Listed by: EXP REALTY $235,000Active3 beds 1 baths1,003 sq. ft.
2115 Carter St, Springfield, TN 37172
MLS# 3164189Listed by: WILLIAM WILSON HOMES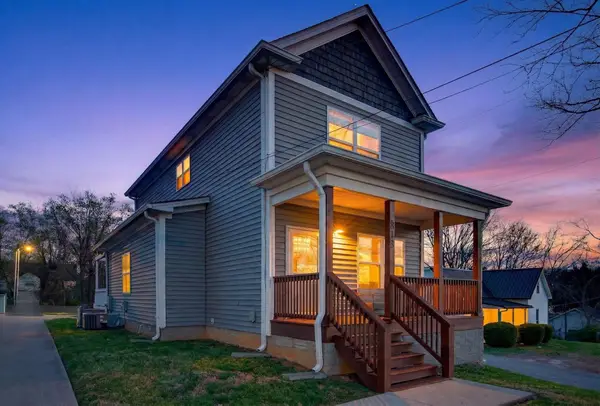 $344,900Active3 beds 2 baths1,572 sq. ft.
813 5th Ave E, Springfield, TN 37172
MLS# 3163713Listed by: ALMOST HOME REAL ESTATE SERVICES, PLLC $374,900Active3 beds 2 baths1,747 sq. ft.
317 Brandywine Ln, Springfield, TN 37172
MLS# 3159926Listed by: COMPASS $595,000Active3 beds 2 baths1,933 sq. ft.
2743 W County Farm Rd, Springfield, TN 37172
MLS# 3159226Listed by: SUNSHINE REAL ESTATE GROUP, LLC $329,900Active4 beds 3 baths1,806 sq. ft.
1800 Meadowbrook Dr, Springfield, TN 37172
MLS# 3156209Listed by: LEGACY SIGNATURE PROPERTIES, LLC $305,000Active3 beds 1 baths1,178 sq. ft.
5904 Highway 76 E, Springfield, TN 37172
MLS# 3155036Listed by: BELLSHIRE REALTY, LLC $55,000Active-- beds -- baths615 sq. ft.
2083 Bessie St, Springfield, TN 37172
MLS# 3154876Listed by: PURPOSE REALTY & AUCTION $409,500Active4 beds 2 baths2,404 sq. ft.
2302 Ruth St, Springfield, TN 37172
MLS# 3153247Listed by: G. S. MOORE & SON $196,900Active2 beds 1 baths943 sq. ft.
2115 Mockingbird Ln #A, Springfield, TN 37172
MLS# 3149186Listed by: ONE STOP REALTY AND AUCTION $389,000Active4 beds 3 baths1,835 sq. ft.
2030 Morgan Ct, Springfield, TN 37172
MLS# 3147677Listed by: HOME HUNTERS REALTY $490,000Active3 beds 3 baths3,091 sq. ft.
500 5th Ave E, Springfield, TN 37172
MLS# 3147203Listed by: AT HOME REALTY $229,900Active3 beds 2 baths1,452 sq. ft.
1309 Batts Blvd, Springfield, TN 37172
MLS# 3146273Listed by: BENCHMARK REALTY, LLC $384,000Active3 beds 2 baths2,304 sq. ft.
5977 Old Highway 431, Springfield, TN 37172
MLS# 3146000Listed by: BENCHMARK REALTY $275,000Active-- beds -- baths2,493 sq. ft.
600 5th Ave E, Springfield, TN 37172
MLS# 3145960Listed by: KELLER WILLIAMS REALTY $534,900Active3 beds 2 baths2,062 sq. ft.
2086 Beverly Ct, Springfield, TN 37172
MLS# 3139846Listed by: KELLER WILLIAMS FIRST CHOICE REALTY $347,990Active2 beds 2 baths1,580 sq. ft.
557 W Foxrun, Springfield, TN 37172
MLS# 3138482Listed by: DSLD HOMES (SOUTHEAST), LLC $1,474,000Active-- beds -- baths
0 Ra Benton, Springfield, TN 37172
MLS# 3138862Listed by: RE/MAX 1ST CHOICE $294,900Active3 beds 2 baths1,288 sq. ft.
458 Laramie Dr, Springfield, TN 37172
MLS# 3138242Listed by: EXIT PRIME REALTY $361,100Active-- beds -- baths
0 Burr Rd, Springfield, TN 37172
MLS# 3136514Listed by: RE/MAX CHOICE PROPERTIES $424,900Active3 beds 3 baths2,684 sq. ft.
200 Champions Dr, Springfield, TN 37172
MLS# 3135848Listed by: SEARCY REALTY & AUCTION $339,900Active3 beds 2 baths1,436 sq. ft.
155 Julia Ann Ct, Springfield, TN 37172
MLS# 3072113Listed by: RELIANT REALTY ERA POWERED $225,000Active3 beds 1 baths1,160 sq. ft.
213 21st Ave W, Springfield, TN 37172
MLS# 3129551Listed by: AT HOME REALTY $419,900Active3 beds 2 baths1,644 sq. ft.
4357 Airport Rd, Springfield, TN 37172
MLS# 3132935Listed by: RE/MAX 1ST CHOICE $2,137,200Active82.2 Acres
0 Owens Chapel Road, Springfield, TN 37172
MLS# 3122544Listed by: BERNIE GALLERANI REAL ESTATE $215,000Active5.02 Acres
0 Beards Chapel Road, Springfield, TN 37172
MLS# 3122191Listed by: COPE ASSOCIATES REALTY & AUCTION, LLC $460,000Pending3 beds 3 baths2,488 sq. ft.
2202 Woodmont Dr, Springfield, TN 37172
MLS# 3121763Listed by: MARK SPAIN REAL ESTATE $334,900Active3 beds 2 baths1,360 sq. ft.
232 Elder Dr, Springfield, TN 37172
MLS# 3113221Listed by: SEARCY REALTY & AUCTION $349,000Active4 beds 3 baths1,502 sq. ft.
2604 Hickory Dr, Springfield, TN 37172
MLS# 3080587Listed by: RE/MAX CHOICE PROPERTIES $299,900Active3 beds 3 baths1,428 sq. ft.
5295 Matthews Street, Springfield, TN 37172
MLS# 3097524Listed by: SOUTHERN ROOTS PROPERTIES $279,900Active3 beds 3 baths1,543 sq. ft.
409 7th Ave W, Springfield, TN 37172
MLS# 3080178Listed by: RELIANT REALTY ERA POWERED- Open Sat, 12 to 2pm
 $725,000Active4 beds 3 baths2,980 sq. ft.
5135 Hwy 41 North, Springfield, TN 37172
MLS# 3073030Listed by: SOUTHERN ROOTS PROPERTIES  $479,999Active4 beds 3 baths2,700 sq. ft.
127 Sam Davis Dr, Springfield, TN 37172
MLS# 3186840Listed by: SIXONEFIVE REAL ESTATE ADVISORS $540,000Active3 beds 2 baths2,783 sq. ft.
3608 Legacy Dr, Springfield, TN 37172
MLS# 3069440Listed by: LEGACY SIGNATURE PROPERTIES, LLC $429,000Active5 beds 2 baths2,410 sq. ft.
610 5th Ave W, Springfield, TN 37172
MLS# 3067233Listed by: MUTTZ REALTY, LLC $394,990Active2 beds 3 baths2,056 sq. ft.
558 W Foxrun, Springfield, TN 37172
MLS# 3056590Listed by: DSLD HOMES (SOUTHEAST), LLC $394,990Active2 beds 3 baths2,056 sq. ft.
563 W Foxrun, Springfield, TN 37172
MLS# 3059258Listed by: DSLD HOMES (SOUTHEAST), LLC $269,000Active3 beds 2 baths1,626 sq. ft.
415 Durrett St, Springfield, TN 37172
MLS# 3098585Listed by: PARKS COMPASS $150,000Active3 beds 2 baths1,100 sq. ft.
3020 W County Farm Rd, Springfield, TN 37172
MLS# 3045511Listed by: CENTURY 21 LANDMARK REALTY $400,000Active29.86 Acres
0 Hwy 431 N, Springfield, TN 37172
MLS# 3041301Listed by: RE/MAX 1ST CHOICE $240,000Active10.86 Acres
0 Hwy 431 N, Springfield, TN 37172
MLS# 3041304Listed by: RE/MAX 1ST CHOICE $300,000Active13.17 Acres
0 Hwy 431 N, Springfield, TN 37172
MLS# 3041306Listed by: RE/MAX 1ST CHOICE $325,000Active14.61 Acres
0 Hwy 431 N, Springfield, TN 37172
MLS# 3041307Listed by: RE/MAX 1ST CHOICE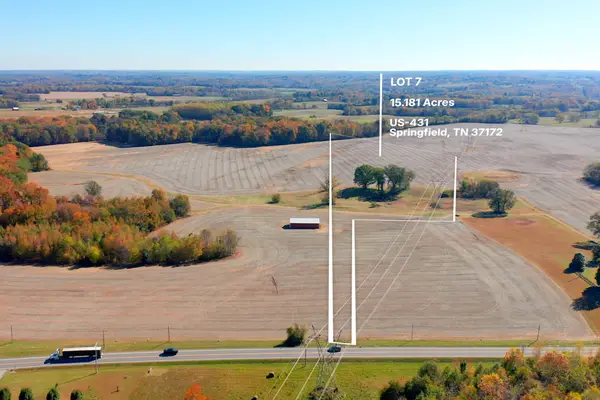 $335,000Active15.18 Acres
0 Hwy 431 N, Springfield, TN 37172
MLS# 3041310Listed by: RE/MAX 1ST CHOICE $385,000Active19.16 Acres
0 William Woodard Rd, Springfield, TN 37172
MLS# 3039817Listed by: RE/MAX 1ST CHOICE $400,000Active19.97 Acres
0 William Woodard Rd, Springfield, TN 37172
MLS# 3039819Listed by: RE/MAX 1ST CHOICE $440,000Active3 beds 2 baths2,200 sq. ft.
409 N Oak St, Springfield, TN 37172
MLS# 3030667Listed by: AT HOME REALTY $518,900Active3 beds 3 baths2,100 sq. ft.
965 Hunters Lane, Springfield, TN 37172
MLS# 3018125Listed by: DALAMAR REAL ESTATE SERVICES, LLC $387,900Active3 beds 2 baths1,400 sq. ft.
54 Hunters Lane, Springfield, TN 37172
MLS# 3018096Listed by: DALAMAR REAL ESTATE SERVICES, LLC $125,000Active5.44 Acres
0 Forest Park Rd, Springfield, TN 37172
MLS# 3002403Listed by: COPE ASSOCIATES REALTY & AUCTION, LLC $150,000Pending5.94 Acres
0 Forest Park Rd, Springfield, TN 37172
MLS# 3002408Listed by: COPE ASSOCIATES REALTY & AUCTION, LLC $549,900Active3 beds 3 baths2,272 sq. ft.
4345 S Garrett Rd, Springfield, TN 37172
MLS# 3093640Listed by: LIBERTY HOUSE REALTY, LLC $175,000Active9.22 Acres
0 Forest Park Rd, Springfield, TN 37172
MLS# 3002406Listed by: COPE ASSOCIATES REALTY & AUCTION, LLC $499,900Pending5 beds 3 baths3,688 sq. ft.
311 Walnut St, Springfield, TN 37172
MLS# 3147811Listed by: EXP REALTY $537,900Active4 beds 3 baths2,750 sq. ft.
938 Hunters Lane, Springfield, TN 37172
MLS# 2995145Listed by: DALAMAR REAL ESTATE SERVICES, LLC $410,900Active3 beds 2 baths1,740 sq. ft.
962 Hunters Lane, Springfield, TN 37172
MLS# 2995125Listed by: DALAMAR REAL ESTATE SERVICES, LLC $447,900Active3 beds 2 baths2,100 sq. ft.
958 Hunters Lane, Springfield, TN 37172
MLS# 2995126Listed by: DALAMAR REAL ESTATE SERVICES, LLC $467,900Active3 beds 3 baths2,150 sq. ft.
954 Hunters Lane, Springfield, TN 37172
MLS# 2995130Listed by: DALAMAR REAL ESTATE SERVICES, LLC $427,900Active3 beds 3 baths2,100 sq. ft.
950 Hunters Lane, Springfield, TN 37172
MLS# 2995131Listed by: DALAMAR REAL ESTATE SERVICES, LLC $387,900Active3 beds 2 baths1,400 sq. ft.
946 Hunters Lane, Springfield, TN 37172
MLS# 2995138Listed by: DALAMAR REAL ESTATE SERVICES, LLC $557,900Active3 beds 2 baths2,900 sq. ft.
942 Hunters Lane, Springfield, TN 37172
MLS# 2995141Listed by: DALAMAR REAL ESTATE SERVICES, LLC $487,900Active3 beds 2 baths2,100 sq. ft.
966 Hunters Lane, Springfield, TN 37172
MLS# 3128009Listed by: DALAMAR REAL ESTATE SERVICES, LLC $419,900Active10 Acres
3294 Burr Rd, Springfield, TN 37172
MLS# 2991466Listed by: CRYE-LEIKE, REALTORS $595,000Active-- beds -- baths
4635 Hwy 431 N, Springfield, TN 37172
MLS# 2929449Listed by: RE/MAX 1ST CHOICE $436,990Active3 beds 2 baths1,556 sq. ft.
2060 Beverly Ct, Springfield, TN 37172
MLS# 3080042Listed by: APEX REALTY & AUCTION, LLC $699,000Active3 beds 2 baths2,482 sq. ft.
5148 Hwy 49w, Springfield, TN 37172
MLS# 2898322Listed by: COPE ASSOCIATES REALTY & AUCTION, LLC $699,900Active3 beds 2 baths2,206 sq. ft.
5247 Stacy Springs Rd, Springfield, TN 37172
MLS# 2899835Listed by: VETERANS REALTY SERVICES $7,500,000Active-- beds -- baths
1 Tom Austin Hwy, Springfield, TN 37172
MLS# 2888244Listed by: RE/MAX 1ST CHOICE $350,000Active3 beds 3 baths1,617 sq. ft.
1160 Jonathan Ln, Springfield, TN 37172
MLS# 3135480Listed by: BENCHMARK REALTY, LLC $650,000Active0.68 Acres
103 Shannon Ln, Springfield, TN 37172
MLS# 2805702Listed by: TURNER & ASSOCIATES REALTY $225,000Active8.07 Acres
0 New Chapel Rd, Springfield, TN 37172
MLS# 3072173Listed by: CENTURY 21 LANDMARK REALTY $249,900Active2 beds 1 baths945 sq. ft.
109 Richland Dr, Springfield, TN 37172
MLS# 2617409Listed by: PINNACLE POINT PROPERTIES & DEVELOPMENT $264,000Active2 beds 1 baths999 sq. ft.
108 Walnut St, Springfield, TN 37172
MLS# 2613197Listed by: RE/MAX 1ST CHOICE $325,000Active3 beds 2 baths1,532 sq. ft.
506 Arabian Ln, Springfield, TN 37172
MLS# 2607086Listed by: PURPOSE REALTY & AUCTION $359,900Active3 beds 3 baths1,296 sq. ft.
133 Dimaggio Dr, Springfield, TN 37172
MLS# 2604722Listed by: BLUE SKIES REALTY, LLC $275,000Active3 beds 2 baths1,144 sq. ft.
109 Phillip Dr, Springfield, TN 37172
MLS# 2600413Listed by: BENCHMARK REALTY, LLC $325,000Pending3 beds 2 baths1,287 sq. ft.
411 Palamino Ln, Springfield, TN 37172
MLS# 2597332Listed by: THE ASHTON REAL ESTATE GROUP OF RE/MAX ADVANTAGE $143,000Active3 beds 1 baths1,432 sq. ft.
1506 S Main St, Springfield, TN 37172
MLS# 2590967Listed by: PURPOSE REALTY & AUCTION $239,900Active3 beds 1 baths980 sq. ft.
116 Walnut St, Springfield, TN 37172
MLS# 2588617Listed by: ZACH TAYLOR REAL ESTATE $269,900Active3 beds 2 baths1,478 sq. ft.
1114 10th Ave E, Springfield, TN 37172
MLS# 2582964Listed by: EXIT MASTER REALTY $289,900Active3 beds 2 baths1,296 sq. ft.
702 Perry Dr, Springfield, TN 37172
MLS# 2580882Listed by: KELLER WILLIAMS REALTY $290,000Active4 beds 1 baths1,768 sq. ft.
1000 10th Ave E, Springfield, TN 37172
MLS# 2579529Listed by: EXP REALTY $379,900Active3 beds 3 baths1,780 sq. ft.
347 Brandywine Ln, Springfield, TN 37172
MLS# 2568825Listed by: SIMPLIHOM $451,000Active2 beds 2 baths1,545 sq. ft.
13 W Foxrun, Springfield, TN 37172
MLS# 2551620Listed by: RE/MAX 1ST CHOICE $79,000Pending0.54 Acres
3147 Old New Cut Rd, Springfield, TN 37172
MLS# 2528175Listed by: COPE ASSOCIATES REALTY & AUCTION, LLC $400,000Active3 beds 1 baths1,792 sq. ft.
4360 Highway 431 N, Springfield, TN 37172
MLS# 2481705Listed by: COPE ASSOCIATES REALTY & AUCTION, LLC
Local realty services provided by:CENTURY 21 Premier
Neighborhoods near Springfield, TN
Zip codes near Springfield, TN
- 37010 homes for sale
- 37015 homes for sale
- 37032 homes for sale
- 37035 homes for sale
- 37048 homes for sale
- 37049 homes for sale
- 37072 homes for sale
- 37073 homes for sale
- 37075 homes for sale
- 37080 homes for sale
- 37115 homes for sale
- 37141 homes for sale
- 37146 homes for sale
- 37172 homes for sale
- 37188 homes for sale
- 37189 homes for sale
- 37207 homes for sale
- 37216 homes for sale
- 37218 homes for sale
- 42204 homes for sale
Popular searches near Springfield, TN
- Adams homes for sale
- Allensville homes for sale
- Cedar Hill homes for sale
- Chapmansboro homes for sale
- Coopertown homes for sale
- Cross Plains homes for sale
- Goodlettsville homes for sale
- Goodlettsville homes for sale
- Greenbrier homes for sale
- Joelton homes for sale
- Madison homes for sale
- Millersville homes for sale
- New Deal homes for sale
- Orlinda homes for sale
- Pleasant View homes for sale
- Ridgetop homes for sale
- Shackle Island homes for sale
- Walnut Grove homes for sale
- White House homes for sale
- Whites Creek homes for sale
Protect your home and budget from life's surprises with an Assurant Home Warranty, backed by a partner that supports you through every step of homeownership. Explore Plans.
©2026 Century 21 Real Estate LLC. All rights reserved. CENTURY 21®, the CENTURY 21 Logo and C21® are service marks owned by Century 21 Real Estate LLC. Century 21 Real Estate LLC fully supports the principles of the Fair Housing Act and the Equal Opportunity Act. Each office is independently owned and operated. Listing information is deemed reliable but not guaranteed accurate.