- Alma homes for sale
- Avalon homes for sale
- Bear Creek Ranch homes for sale
- Bristol homes for sale
- Desoto homes for sale
- Ennis homes for sale
- Ferris homes for sale
- Forreston homes for sale
- Garrett homes for sale
- Glenn Heights homes for sale
- Italy homes for sale
- Lancaster homes for sale
- Maypearl homes for sale
- Midlothian homes for sale
- Oak Leaf homes for sale
- Ovilla homes for sale
- Palmer homes for sale
- Red Oak homes for sale
- Waxahachie homes for sale
- Wilmer homes for sale
75165, TX - homes for sale
300 of 527 results displayed
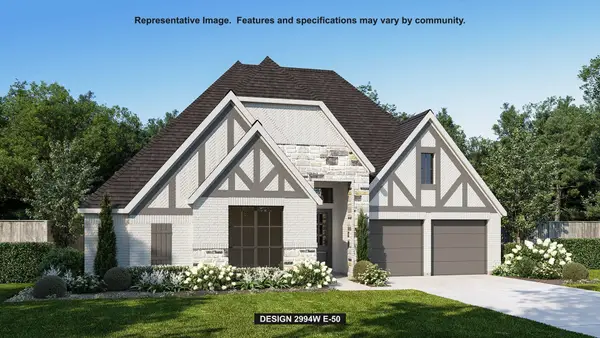
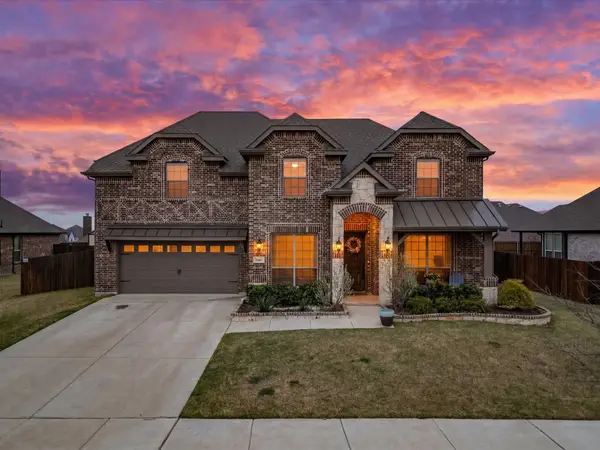
 $598,900Pending4 beds 3 baths2,994 sq. ft.
285 Rosemallow Lane, Waxahachie, TX 75165
MLS# 21246472Listed by: PERRY HOMES REALTY LLC- New
 $839,900Active4 beds 4 baths5,396 sq. ft.
230 Oak Tree Drive, Waxahachie, TX 75165
MLS# 21246542Listed by: TRILLIONAIRE REALTY - New
 $559,900Active4 beds 4 baths2,708 sq. ft.
108 Paradise Cove, Waxahachie, TX 75165
MLS# 21246639Listed by: PINNACLE REALTY ADVISORS - New
 $324,900Active4 beds 2 baths1,897 sq. ft.
205 Fairview Street, Waxahachie, TX 75165
MLS# 21243969Listed by: CENTURY 21 JUDGE FITE CO. - New
 $465,000Active3 beds 2 baths1,599 sq. ft.
302 Blue Ribbon Road, Waxahachie, TX 75165
MLS# 21243458Listed by: KELLER WILLIAMS REALTY - New
 $553,900Active4 beds 3 baths2,545 sq. ft.
237 Woodoat Road, Waxahachie, TX 75165
MLS# 21245443Listed by: PERRY HOMES REALTY LLC - New
 $299,900Active3 beds 2 baths1,424 sq. ft.
221 N Edgefield Road, Waxahachie, TX 75165
MLS# 21244479Listed by: FATHOM REALTY - New
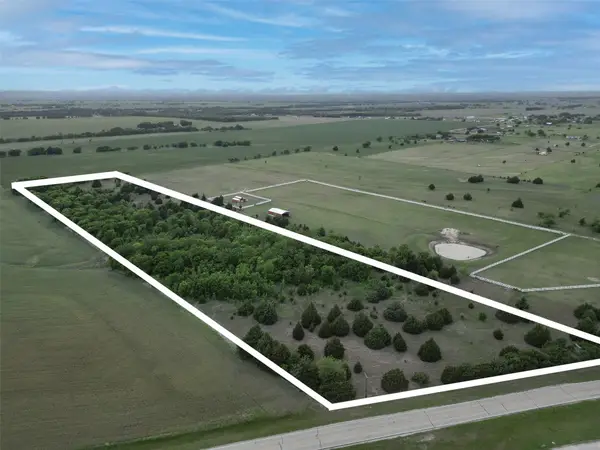
 $3,914,900Active17 Acres
000 Cantrell, Waxahachie, TX 75165
MLS# 21225926Listed by: RE/MAX FRONTIER - New
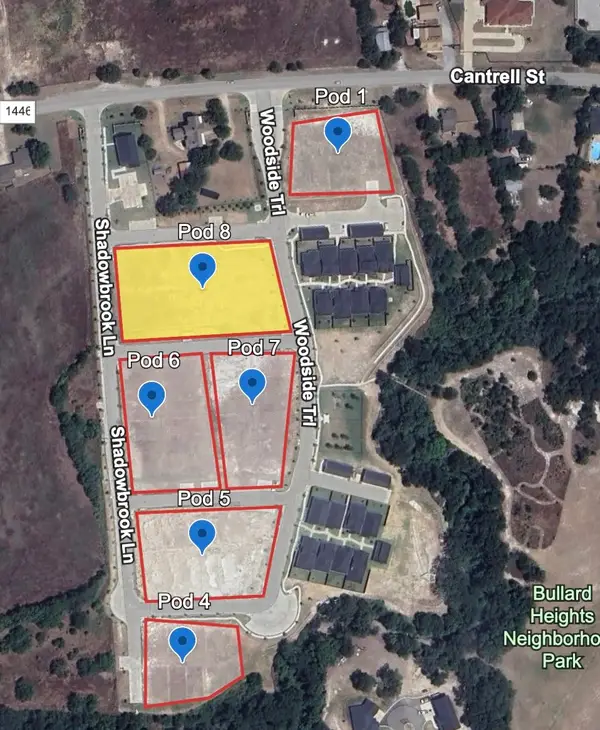 $699,000Active0.66 Acres
Pod 8 Shadowbrook Lane, Waxahachie, TX 75165
MLS# 21225929Listed by: RE/MAX FRONTIER - New
 $305,000Active3 beds 2 baths1,421 sq. ft.
203 Commonwealth Circle, Waxahachie, TX 75165
MLS# 21239011Listed by: INC REALTY, LLC - New
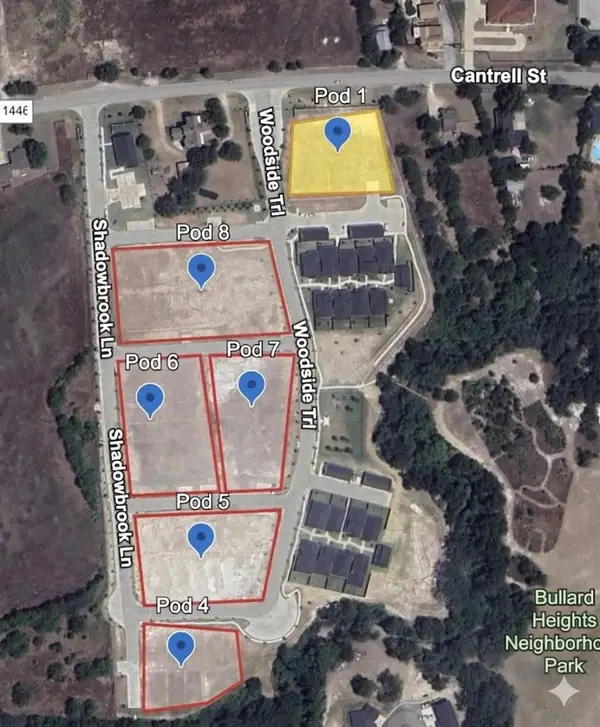 $559,200Active0.66 Acres
Pod 1 Shadowbrook Lane, Waxahachie, TX 75165
MLS# 21244883Listed by: RE/MAX FRONTIER - New
 $670,000Active4 beds 3 baths3,040 sq. ft.
321 Rolling Meadows Drive, Waxahachie, TX 75165
MLS# 21242941Listed by: KELLER WILLIAMS REALTY - New
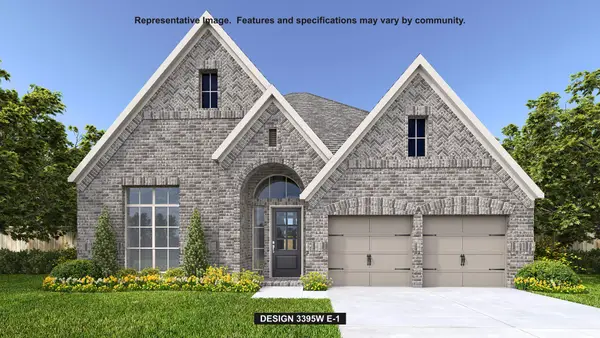 $649,900Active4 beds 4 baths3,395 sq. ft.
252 Woodoat Road, Waxahachie, TX 75165
MLS# 21244578Listed by: PERRY HOMES REALTY LLC - New
 $480,000Active5 beds 3 baths2,937 sq. ft.
392 Teton Street, Waxahachie, TX 75165
MLS# 21244422Listed by: LOCAL REALTY AGENCY - New
 $64,999Active0.24 Acres
706 Dr Martin Luther King Jr Boulevard, Waxahachie, TX 75165
MLS# 21244179Listed by: CENTURY 21 JUDGE FITE COMPANY - New
 $571,900Active4 beds 3 baths2,574 sq. ft.
228 Woodoat Road, Waxahachie, TX 75165
MLS# 21243880Listed by: PERRY HOMES REALTY LLC - New
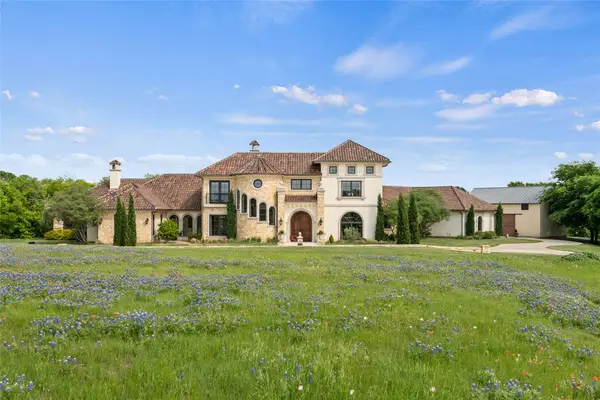 $3,999,999Active4 beds 6 baths6,300 sq. ft.
4101 Howard Road, Waxahachie, TX 75165
MLS# 21241624Listed by: PINNACLE REALTY ADVISORS - New
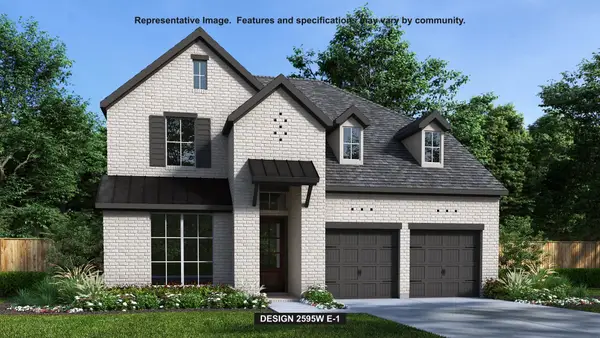 $574,900Active4 beds 3 baths2,595 sq. ft.
244 Woodoat Road, Waxahachie, TX 75165
MLS# 21243687Listed by: PERRY HOMES REALTY LLC - New
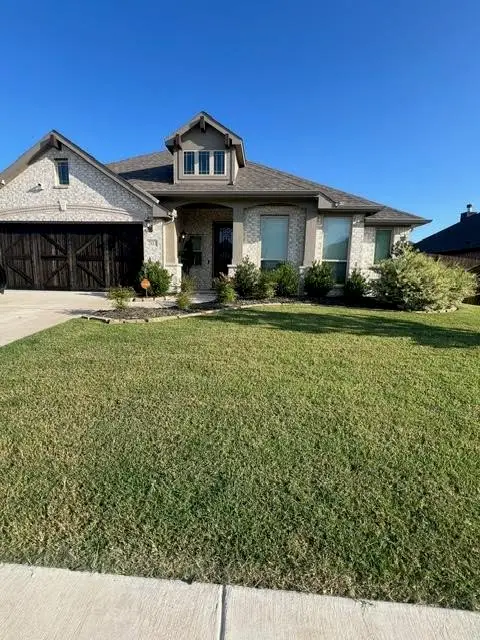 $389,000Active4 beds 2 baths2,332 sq. ft.
203 Mockingbird Drive, Waxahachie, TX 75165
MLS# 21243688Listed by: THE HUGHES GROUP REAL ESTATE - New
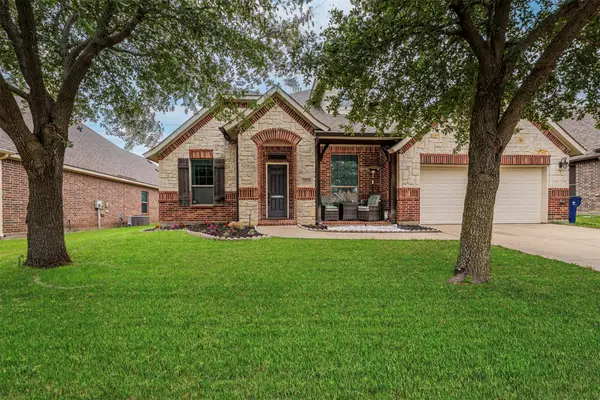 $399,500Active3 beds 2 baths2,201 sq. ft.
209 Boardwalk Avenue, Waxahachie, TX 75165
MLS# 21242600Listed by: RELO RADAR - New
 $624,900Active4 beds 4 baths2,994 sq. ft.
273 Rosemallow Lane, Waxahachie, TX 75165
MLS# 21243332Listed by: PERRY HOMES REALTY LLC - New
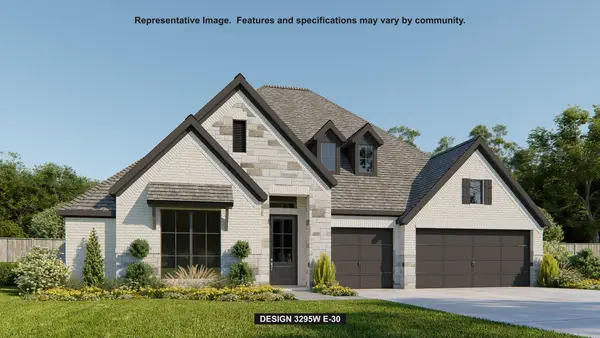 $674,900Active4 beds 4 baths3,295 sq. ft.
264 Rosemallow Lane, Waxahachie, TX 75165
MLS# 21243244Listed by: PERRY HOMES REALTY LLC - New
 $624,900Active4 beds 4 baths2,895 sq. ft.
249 Rosemallow Lane, Waxahachie, TX 75165
MLS# 21243281Listed by: PERRY HOMES REALTY LLC - New
 $469,900Active4 beds 2 baths2,330 sq. ft.
1605 Granite Way, Waxahachie, TX 75165
MLS# 21241823Listed by: KELLER WILLIAMS REALTY DPR - New
 $437,990Active5 beds 4 baths2,986 sq. ft.
489 Hocking Hills Drive, Waxahachie, TX 75165
MLS# 21243045Listed by: HOMESUSA.COM - New
 $300,000Active11.19 Acres
TBD I-35, Waxahachie, TX 75165
MLS# 21241866Listed by: BRIGGS FREEMAN SOTHEBYS INTL - New
 $340,000Active3 beds 2 baths1,628 sq. ft.
1521 Shawnee Road, Waxahachie, TX 75165
MLS# 21238153Listed by: EBBY HALLIDAY, REALTORS - New
 $329,900Active3 beds 2 baths1,951 sq. ft.
114 Thoroughbred Street, Waxahachie, TX 75165
MLS# 21242584Listed by: PARAGON, REALTORS - New
 $2,200,000Active4 beds 4 baths4,089 sq. ft.
2842 Old Boyce Road, Waxahachie, TX 75165
MLS# 21241211Listed by: KIND REALTY - New
 $335,000Active3 beds 2 baths2,027 sq. ft.
127 Althea Drive, Waxahachie, TX 75165
MLS# 21238871Listed by: KELLER WILLIAMS REALTY - New
 $645,000Active5 beds 3 baths2,700 sq. ft.
710 Gibson Road, Waxahachie, TX 75165
MLS# 21241568Listed by: EVOLVE REAL ESTATE LLC - New
 $360,000Active3 beds 2 baths1,714 sq. ft.
233 Country Meadows Drive, Waxahachie, TX 75165
MLS# 21241608Listed by: LEGACY REALTY GROUP - Open Sat, 10am to 1pmNew
 $459,000Active4 beds 3 baths2,699 sq. ft.
408 Valley Brook Court, Waxahachie, TX 75165
MLS# 21237460Listed by: CENTURY 21 JUDGE FITE CO. - New
 $539,000Active4 beds 3 baths3,140 sq. ft.
624 Sirius Lane, Waxahachie, TX 75165
MLS# 21241182Listed by: OLIVER REALTY - New
 $399,000Active4 beds 2 baths2,068 sq. ft.
1169 Maree Drive, Waxahachie, TX 75165
MLS# 21215677Listed by: ENCORE FINE PROPERTIES - New
 $335,000Active4 beds 2 baths1,810 sq. ft.
532 Meadowlake Drive, Waxahachie, TX 75165
MLS# 21239312Listed by: KELLER WILLIAMS REALTY - New
 $550,000Active5 beds 4 baths3,591 sq. ft.
270 Brookbend Drive, Waxahachie, TX 75165
MLS# 21239123Listed by: COMPASS RE TEXAS, LLC. - Open Sat, 11am to 1pmNew
 $869,000Active4 beds 5 baths3,550 sq. ft.
650 Gibson Road, Waxahachie, TX 75165
MLS# 21190531Listed by: EVOLVE REAL ESTATE LLC - New
 $549,990Active5 beds 4 baths3,628 sq. ft.
613 Red Maple Road, Waxahachie, TX 75165
MLS# 21237840Listed by: AESTHETIC REALTY, LLC - New
 $609,990Active4 beds 3 baths2,803 sq. ft.
270 Maci Drive, Waxahachie, TX 75167
MLS# 21238287Listed by: KELLER WILLIAMS REALTY - New
 $440,000Active4 beds 3 baths3,005 sq. ft.
73 River Oaks Boulevard, Waxahachie, TX 75165
MLS# 21234561Listed by: GREAT WESTERN REALTY - New
 $246,000Active3 beds 2 baths1,188 sq. ft.
620 Jordan Lane, Waxahachie, TX 75165
MLS# 21238464Listed by: ONDEMAND REALTY - New
 $79,000Active3.28 Acres
TBD Gravel Street, Waxahachie, TX 75165
MLS# 21237865Listed by: ALL CITY - New
 $715,000Active4 beds 4 baths3,776 sq. ft.
309 E Marvin Avenue, Waxahachie, TX 75165
MLS# 21233788Listed by: COLDWELL BANKER REALTY - New
 $355,000Active3 beds 2 baths2,080 sq. ft.
201 Rawhide Street, Waxahachie, TX 75165
MLS# 21235065Listed by: STEVE MILLER REAL ESTATE - New
 $319,999Active3 beds 3 baths1,532 sq. ft.
2041 Layla Drive, Waxahachie, TX 75165
MLS# 32529898Listed by: KELLER WILLIAMS MEMORIAL - New
 $299,700Active3 beds 2 baths1,282 sq. ft.
3016 Huntington Court, Waxahachie, TX 75165
MLS# 21236321Listed by: RTM REALTY  $432,990Active5 beds 3 baths3,134 sq. ft.
485 Hundred Acre Drive, Waxahachie, TX 75165
MLS# 21236093Listed by: HOMESUSA.COM $455,000Active3 beds 2 baths1,886 sq. ft.
508 Tishomingo Road, Waxahachie, TX 75165
MLS# 21235783Listed by: JEANETTE ANDERSON REAL ESTATE $399,900Active4 beds 3 baths2,276 sq. ft.
412 Royal Street, Waxahachie, TX 75165
MLS# 21235943Listed by: OLIVER REALTY $429,900Active5 beds 5 baths3,448 sq. ft.
118 Pinto Drive, Waxahachie, TX 75165
MLS# 21202912Listed by: COMPASS RE TEXAS, LLC $539,900Active3 beds 3 baths2,615 sq. ft.
671 Brookglen Court, Waxahachie, TX 75165
MLS# 21232766Listed by: MUIRHEAD RANCH & REALTY $399,999Active4 beds 3 baths2,495 sq. ft.
186 Western Way, Waxahachie, TX 75165
MLS# 21235224Listed by: BRAY REAL ESTATE GROUP- DALLAS $465,000Active3 beds 3 baths2,824 sq. ft.
102 Vintage Drive, Waxahachie, TX 75165
MLS# 21209626Listed by: RTR WAXAHACHIE $150,000Active0.32 Acres
105 Wyatt Street, Waxahachie, TX 75165
MLS# 21234917Listed by: CENTURY 21 JUDGE FITE CO. $465,000Active3 beds 3 baths2,535 sq. ft.
213 Perennial Way, Waxahachie, TX 75165
MLS# 21234814Listed by: RENDON REALTY, LLC $315,000Active4 beds 2 baths1,889 sq. ft.
213 Arabian, Waxahachie, TX 75165
MLS# 21231855Listed by: KELLER WILLIAMS REALTY $369,000Active4 beds 2 baths2,034 sq. ft.
1109 Wheatland Terrace, Waxahachie, TX 75165
MLS# 21233729Listed by: ONDEMAND REALTY $524,999Active4 beds 3 baths2,611 sq. ft.
233 Pine Leaf Trail, Waxahachie, TX 75165
MLS# 21234090Listed by: HOMESUSA.COM $340,000Active3 beds 3 baths1,932 sq. ft.
104 W 2nd Street, Waxahachie, TX 75165
MLS# 21227725Listed by: REDFIN CORPORATION $535,000Active4 beds 3 baths2,807 sq. ft.
312 Equestrian Drive, Waxahachie, TX 75165
MLS# 21233086Listed by: EBBY HALLIDAY REALTORS $299,000Active3 beds 2 baths1,747 sq. ft.
1309 Dixie Lane, Waxahachie, TX 75165
MLS# 21224511Listed by: REAL BROKER, LLC $375,000Active3 beds 3 baths1,614 sq. ft.
209 Williams Street, Waxahachie, TX 75165
MLS# 21233049Listed by: COLDWELL BANKER REALTY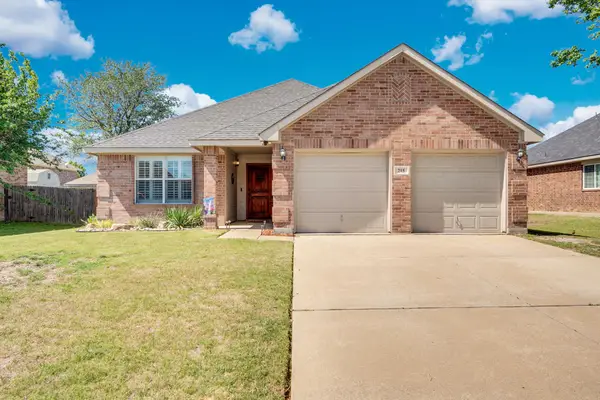 $325,000Active3 beds 2 baths1,736 sq. ft.
215 Stable Drive, Waxahachie, TX 75165
MLS# 21232585Listed by: EXP REALTY LLC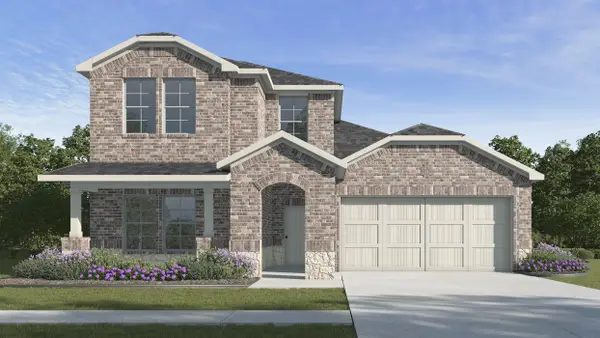 $363,490Active4 beds 3 baths2,235 sq. ft.
470 Sebastian Lane, Waxahachie, TX 75165
MLS# 21232841Listed by: JEANETTE ANDERSON REAL ESTATE $365,990Active4 beds 3 baths2,242 sq. ft.
502 Sebastian Lane, Waxahachie, TX 75165
MLS# 21232348Listed by: JEANETTE ANDERSON REAL ESTATE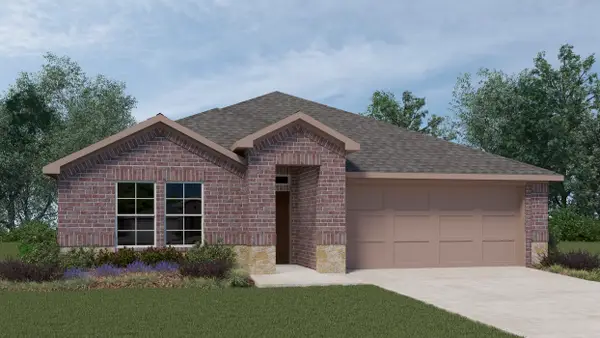 $333,490Pending4 beds 2 baths1,864 sq. ft.
208 Charismatic Road, Waxahachie, TX 75165
MLS# 21232374Listed by: JEANETTE ANDERSON REAL ESTATE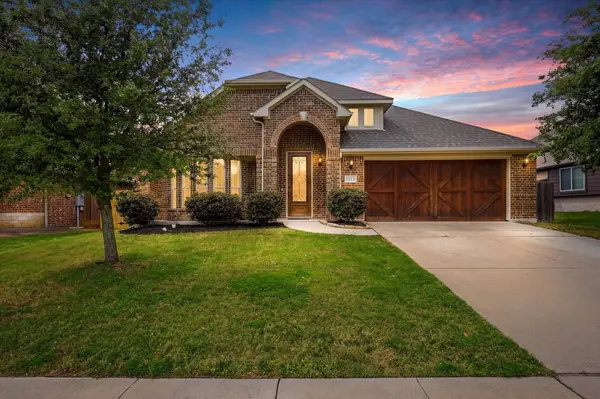 $424,900Active4 beds 3 baths2,757 sq. ft.
1113 Planters Way, Waxahachie, TX 75165
MLS# 21230336Listed by: ONDEMAND REALTY $369,990Active3 beds 3 baths2,020 sq. ft.
692 Avalon Drive, Waxahachie, TX 75165
MLS# 21229645Listed by: TDREALTY $575,000Active4 beds 3 baths3,094 sq. ft.
123 Mustang Creek Drive, Waxahachie, TX 75165
MLS# 21227812Listed by: COLDWELL BANKER REALTY $595,000Active4 beds 4 baths3,006 sq. ft.
304 Becky Lane, Waxahachie, TX 75165
MLS# 21229993Listed by: CITIWIDE ALLIANCE REALTY $424,900Active3 beds 2 baths2,361 sq. ft.
532 Windrow Lane, Waxahachie, TX 75165
MLS# 21230253Listed by: MONUMENT REALTY $488,707Active4 beds 3 baths2,229 sq. ft.
500 Range Boss Trail, Waxahachie, TX 75165
MLS# 21230322Listed by: PINNACLE REALTY ADVISORS $630,000Active4 beds 4 baths3,627 sq. ft.
640 Lakota Parkway, Waxahachie, TX 75165
MLS# 21226796Listed by: COLDWELL BANKER REALTY $308,150Pending3 beds 2 baths1,690 sq. ft.
210 Silver Spur Drive, Waxahachie, TX 75165
MLS# 21228032Listed by: KELLER WILLIAMS LONESTAR DFW $339,999Active2 beds 1 baths1,290 sq. ft.
320 Woodside Trail, Waxahachie, TX 75165
MLS# 21225646Listed by: RE/MAX FRONTIER $364,000Active3 beds 2 baths1,341 sq. ft.
312 Woodside Trail, Waxahachie, TX 75165
MLS# 21225891Listed by: RE/MAX FRONTIER $415,000Active3 beds 2 baths2,254 sq. ft.
141 Crockett Drive, Waxahachie, TX 75165
MLS# 21222598Listed by: MONUMENT REALTY $775,000Active3 beds 2 baths3,002 sq. ft.
971 Bells Chapel Road, Waxahachie, TX 75165
MLS# 21226731Listed by: COLDWELL BANKER REALTY $349,900Active4 beds 2 baths2,204 sq. ft.
202 Boardwalk Avenue, Waxahachie, TX 75165
MLS# 21227217Listed by: LEGACY REALTY GROUP $335,000Active4 beds 2 baths1,682 sq. ft.
220 Chesterfield Circle, Waxahachie, TX 75165
MLS# 21205429Listed by: RTR MIDLOTHIAN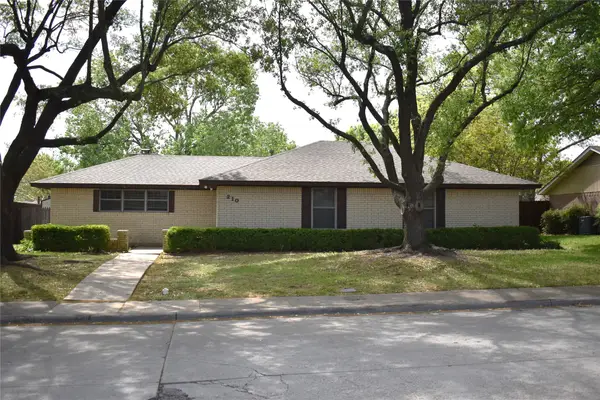 $279,000Pending3 beds 2 baths1,558 sq. ft.
210 Iroquois Lane, Waxahachie, TX 75165
MLS# 21222757Listed by: JPAR-GRANDVIEW $328,490Pending4 beds 2 baths1,821 sq. ft.
454 Sebastian Lane, Waxahachie, TX 75165
MLS# 21228164Listed by: JEANETTE ANDERSON REAL ESTATE $299,000Pending3 beds 2 baths1,602 sq. ft.
205 Pueblo Drive, Waxahachie, TX 75165
MLS# 21222739Listed by: JPAR-GRANDVIEW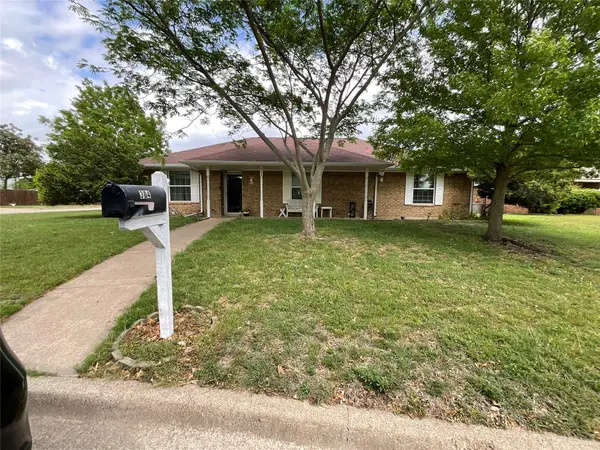 $314,900Active3 beds 2 baths1,557 sq. ft.
304 Johnston Boulevard, Waxahachie, TX 75165
MLS# 21227771Listed by: NEXTHOME NTX LUXE LIVING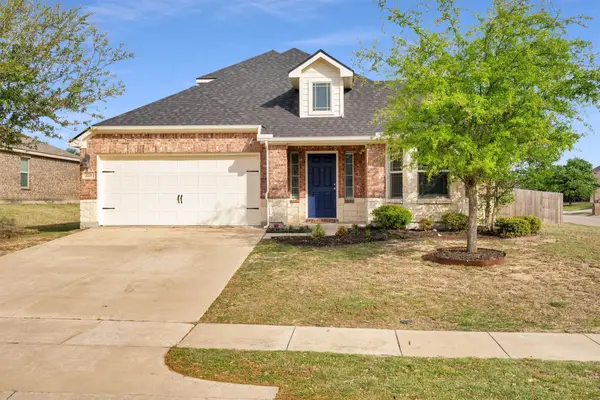 $400,000Active4 beds 3 baths2,582 sq. ft.
221 Bear Trail, Waxahachie, TX 75165
MLS# 21226009Listed by: REMINGTON TEAM REALTY, LLC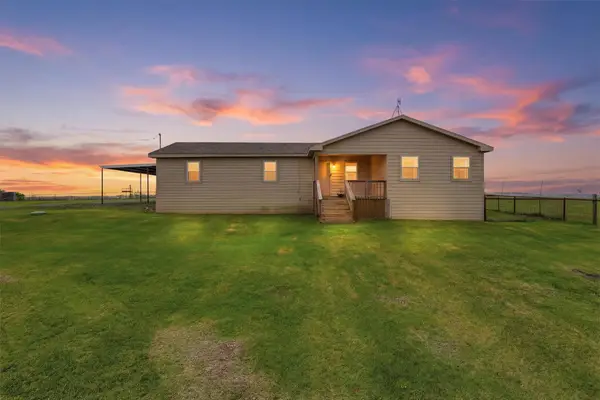 $350,000Pending3 beds 3 baths1,560 sq. ft.
1051 Pigg Road, Waxahachie, TX 75165
MLS# 21226452Listed by: WE SELL TEXAS $489,999Active5 beds 4 baths3,269 sq. ft.
508 Bush Avenue, Waxahachie, TX 75165
MLS# 21227025Listed by: EXP REALTY LLC $429,999Active3 beds 3 baths2,500 sq. ft.
279 Moonshadow Drive, Waxahachie, TX 75165
MLS# 21225464Listed by: RELO RADAR $220,000Active3 beds 2 baths1,522 sq. ft.
211 Sunnyside Drive, Waxahachie, TX 75165
MLS# 21198421Listed by: FATHOM REALTY $344,000Active2 beds 2 baths1,267 sq. ft.
314 Woodside Trail, Waxahachie, TX 75165
MLS# 21225680Listed by: RE/MAX FRONTIER $648,900Active4 beds 4 baths2,895 sq. ft.
276 Rosemallow Lane, Waxahachie, TX 75165
MLS# 21225036Listed by: PERRY HOMES REALTY LLC $310,000Active3 beds 2 baths1,599 sq. ft.
721 Azalea Trail, Waxahachie, TX 75165
MLS# 21225306Listed by: JOSEPH WALTER REALTY, LLC $312,900Active3 beds 2 baths1,450 sq. ft.
218 Rawhide Street, Waxahachie, TX 75165
MLS# 21214785Listed by: JERRY FULLERTON REALTY, INC. $249,000Active4 beds 3 baths2,522 sq. ft.
807 Wyatt Street, Waxahachie, TX 75165
MLS# 21224942Listed by: TY LEE $318,490Pending3 beds 2 baths1,450 sq. ft.
198 Delta Road, Waxahachie, TX 75165
MLS# 21224070Listed by: JEANETTE ANDERSON REAL ESTATE $498,000Pending4 beds 3 baths2,708 sq. ft.
411 Sycamore Street, Waxahachie, TX 75165
MLS# 21221673Listed by: CITY REAL ESTATE $799,999Active4 beds 3 baths3,510 sq. ft.
146 Old Bridge Road, Waxahachie, TX 75165
MLS# 21222376Listed by: CENTURY 21 JUDGE FITE CO. $359,000Active3 beds 2 baths1,804 sq. ft.
116 Arborside Drive, Waxahachie, TX 75165
MLS# 21222115Listed by: KELLER WILLIAMS CENTRAL $409,700Active4 beds 3 baths2,591 sq. ft.
1607 Little Creek Drive, Waxahachie, TX 75165
MLS# 21215463Listed by: REALTY INC. $369,900Active3 beds 2 baths1,705 sq. ft.
1108 Lakefront Drive, Waxahachie, TX 75165
MLS# 21219274Listed by: CITY REAL ESTATE $850,000Active4 beds 4 baths2,908 sq. ft.
1066 West Road, Waxahachie, TX 75165
MLS# 21204088Listed by: COLDWELL BANKER REALTY $650,000Active4 beds 3 baths3,990 sq. ft.
901 Bryson Street, Waxahachie, TX 75165
MLS# 21215088Listed by: WEICHERT REALTORS/PROPERTY PARTNERS $385,000Active4 beds 3 baths2,453 sq. ft.
325 Adwood Drive, Waxahachie, TX 75165
MLS# 21221252Listed by: MONUMENT REALTY $189,900Active1.54 Acres
TBD Lot 30 Ridgecrest Drive, Waxahachie, TX 75165
MLS# 21221345Listed by: TEXAS INVESTORS REALTY $215,000Active1.93 Acres
TBD Lot 31 Ridgecrest Drive, Waxahachie, TX 75165
MLS# 21221143Listed by: TEXAS INVESTORS REALTY $293,000Active3 beds 2 baths1,352 sq. ft.
629 Antonio Lane, Waxahachie, TX 75165
MLS# 21220477Listed by: SUNNY GRAHAM REALTY $529,900Active4 beds 3 baths3,516 sq. ft.
235 Half Moon Drive, Waxahachie, TX 75165
MLS# 21220742Listed by: MONUMENT REALTY- Open Sat, 1 to 3pm
 $394,990Active4 beds 3 baths2,444 sq. ft.
445 Hundred Acre Drive, Waxahachie, TX 75165
MLS# 21220327Listed by: HOMESUSA.COM  $457,990Active5 beds 4 baths3,627 sq. ft.
452 Hundred Acre Drive, Waxahachie, TX 75165
MLS# 21220340Listed by: HOMESUSA.COM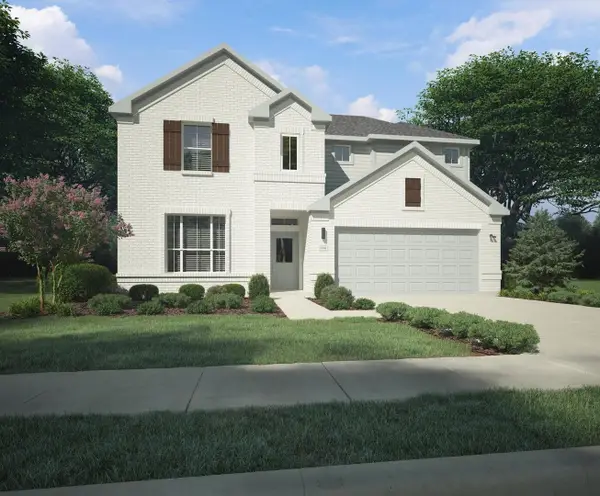 $419,990Active5 beds 4 baths2,986 sq. ft.
473 Hundred Acre Drive, Waxahachie, TX 75165
MLS# 21220283Listed by: HOMESUSA.COM $364,990Active4 beds 3 baths2,152 sq. ft.
476 Hundred Acre Drive, Waxahachie, TX 75165
MLS# 21220287Listed by: HOMESUSA.COM $367,490Active4 beds 3 baths2,152 sq. ft.
484 Hundred Acre Drive, Waxahachie, TX 75165
MLS# 21220323Listed by: HOMESUSA.COM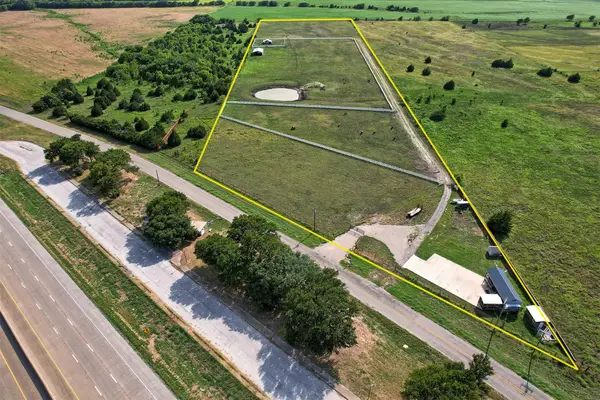 $1,285,000Active17.39 Acres
6882 N Interstate Highway 35 E, Waxahachie, TX 75165
MLS# 21219114Listed by: JBRE GROUP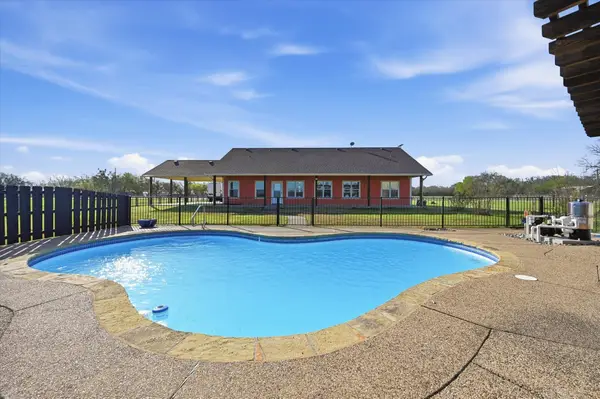 $448,000Active3 beds 2 baths2,016 sq. ft.
1616 Nash Howard Road, Waxahachie, TX 75165
MLS# 21219775Listed by: MONUMENT REALTY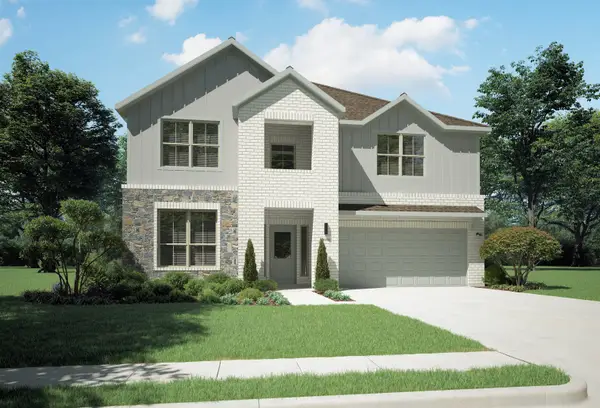 $437,490Pending5 beds 3 baths3,134 sq. ft.
461 Hundred Acre Drive, Waxahachie, TX 75165
MLS# 21219858Listed by: HOMESUSA.COM $1,300,000Active3 beds 2 baths2,000 sq. ft.
1748 Wilson Road, Waxahachie, TX 75165
MLS# 21218585Listed by: KELLER WILLIAMS REALTY-FM $314,000Active3 beds 2 baths1,685 sq. ft.
223 Gayleh Lane, Waxahachie, TX 75165
MLS# 21218072Listed by: ALLIE BETH ALLMAN & ASSOC. $55,000Active0.27 Acres
1111 E Jefferson Street, Waxahachie, TX 75165
MLS# 21212336Listed by: CENTRAL METRO REALTY $1,300,000Active5 beds 4 baths2,281 sq. ft.
671 Robnett Road, Waxahachie, TX 75165
MLS# 21219298Listed by: KELLER WILLIAMS LONESTAR $602,929Active4 beds 4 baths3,190 sq. ft.
237 Basketflower Drive, Waxahachie, TX 75165
MLS# 21218680Listed by: HOMESUSA.COM $750,000Active4 beds 3 baths3,122 sq. ft.
136 Ocotillo Drive, Waxahachie, TX 75165
MLS# 21209928Listed by: KELLER WILLIAMS REALTY DPR $379,950Pending4 beds 3 baths2,185 sq. ft.
464 Sugarlands Drive, Waxahachie, TX 75165
MLS# 21206419Listed by: KELLER WILLIAMS FRISCO STARS $719,900Active4 beds 3 baths3,102 sq. ft.
170 Maci Drive, Waxahachie, TX 75167
MLS# 21217227Listed by: EXP REALTY $654,900Active4 beds 3 baths3,227 sq. ft.
133 Swan Lake Drive, Waxahachie, TX 75165
MLS# 21217911Listed by: PINNACLE REALTY ADVISORS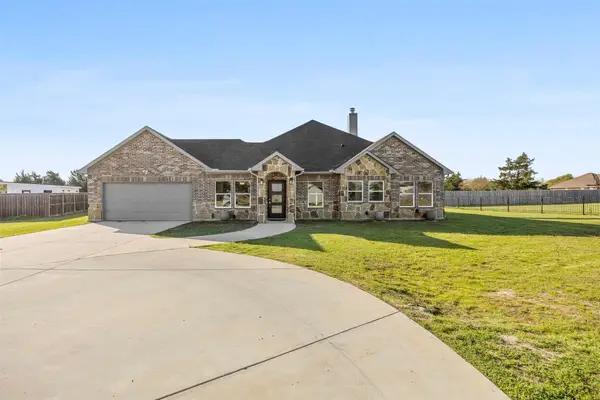 $495,000Active4 beds 3 baths2,307 sq. ft.
1218 Lynn Way, Waxahachie, TX 75165
MLS# 21209559Listed by: KELLER WILLIAMS REALTY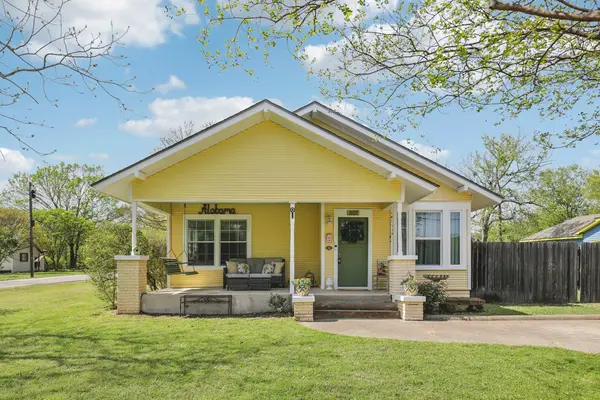 $310,000Pending2 beds 3 baths1,836 sq. ft.
601 Williams Street, Waxahachie, TX 75165
MLS# 21215623Listed by: JASON MITCHELL REAL ESTATE TEXAS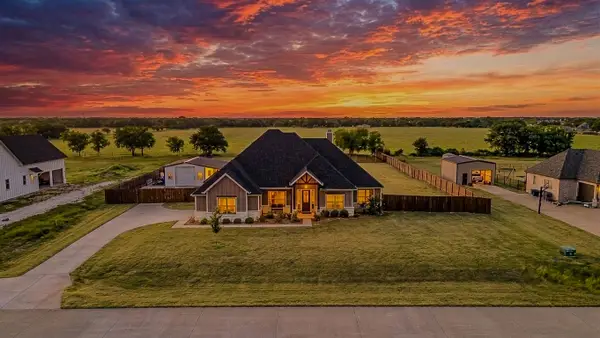 $569,900Pending3 beds 3 baths2,412 sq. ft.
1777 Ryder Lee Lane, Waxahachie, TX 75165
MLS# 21216947Listed by: COLDWELL BANKER APEX, REALTORS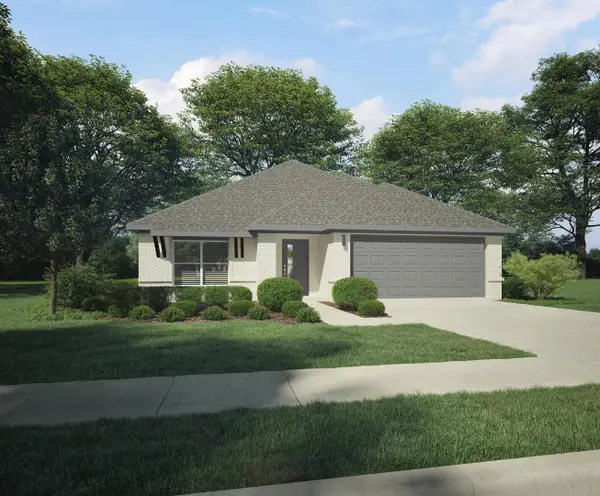 $369,990Active4 beds 3 baths2,152 sq. ft.
469 Hundred Acre Drive, Waxahachie, TX 75165
MLS# 21216650Listed by: HOMESUSA.COM $879,900Active4 beds 3 baths3,386 sq. ft.
3090 Glen Oaks Drive, Waxahachie, TX 75165
MLS# 21205443Listed by: LEGACY REALTY GROUP $900,000Active3 beds 3 baths2,888 sq. ft.
1302 Forreston Road, Waxahachie, TX 75165
MLS# 21215468Listed by: CENTURY 21 JUDGE FITE CO. $95,000Active0.37 Acres
0000 Tbd, Waxahachie, TX 75165
MLS# 21215752Listed by: EAST PLANO REALTY, LLC $500,000Active4 beds 3 baths2,521 sq. ft.
101 Tee Side Drive, Waxahachie, TX 75165
MLS# 21214504Listed by: COLDWELL BANKER REALTY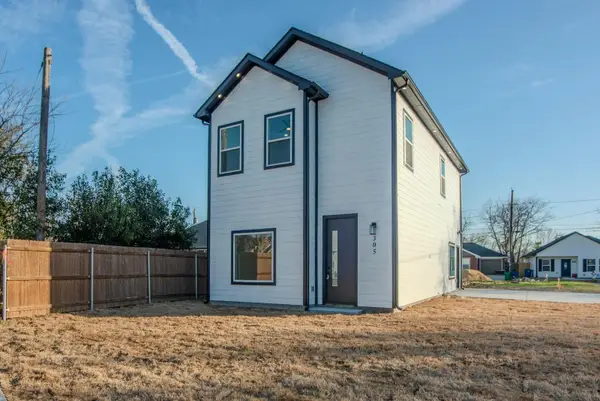 $310,000Active3 beds 3 baths1,672 sq. ft.
305 Eggar Street, Waxahachie, TX 75165
MLS# 21212655Listed by: KELLER WILLIAMS CENTRAL $315,000Active3 beds 3 baths2,250 sq. ft.
203 Stampede Street, Waxahachie, TX 75165
MLS# 21215019Listed by: WEICHERT REALTORS/PROPERTY PARTNERS $345,000Active3 beds 2 baths1,964 sq. ft.
211 Hitt Street, Waxahachie, TX 75165
MLS# 21214502Listed by: KELLER WILLIAMS REALTY $325,000Active3 beds 2 baths1,650 sq. ft.
212 Pueblo Drive, Waxahachie, TX 75165
MLS# 21212932Listed by: COLDWELL BANKER REALTY $810,000Active4 beds 3 baths3,824 sq. ft.
767 Farrar Road, Waxahachie, TX 75165
MLS# 21212168Listed by: MARK SPAIN REAL ESTATE $615,000Active4 beds 3 baths2,846 sq. ft.
100 Brookview Court, Waxahachie, TX 75165
MLS# 21213114Listed by: LEGACY REALTY GROUP $500,000Pending5 beds 3 baths2,294 sq. ft.
517 Seneca Drive, Waxahachie, TX 75165
MLS# 21213242Listed by: FATHOM REALTY $549,900Active4 beds 3 baths2,320 sq. ft.
103 Springfield Lane, Red Oak, TX 75165
MLS# 21212991Listed by: TERO REAL ESTATE $480,000Active3 beds 3 baths2,527 sq. ft.
504 Red Maple Road, Waxahachie, TX 75165
MLS# 21213017Listed by: VISIONS REALTY & INVESTMENTS $550,000Pending4 beds 2 baths2,233 sq. ft.
118 Chazlynn Court, Waxahachie, TX 75165
MLS# 21209103Listed by: KELLER WILLIAMS REALTY $440,000Active3 beds 2 baths1,874 sq. ft.
108 Dublin Circle, Waxahachie, TX 75165
MLS# 21207155Listed by: REGAL, REALTORS $335,000Pending3 beds 2 baths1,718 sq. ft.
105 Rain Cloud Drive, Waxahachie, TX 75165
MLS# 21204153Listed by: KELLER WILLIAMS FORT WORTH $749,900Active30.03 Acres
000 Pigg Road, Waxahachie, TX 75165
MLS# 21204260Listed by: OLIVER REALTY $349,000Pending3 beds 2 baths2,328 sq. ft.
253 Calvert Street, Waxahachie, TX 75165
MLS# 21209374Listed by: FATHOM REALTY LLC $995,000Active6 beds 4 baths4,474 sq. ft.
371 S Ring Road, Waxahachie, TX 75165
MLS# 21211572Listed by: FATHOM REALTY, LLC $499,999Active5.01 Acres
3451 Fm 878, Waxahachie, TX 75165
MLS# 87022750Listed by: VIVE REALTY LLC $155,000Pending3 beds 1 baths1,100 sq. ft.
200 Cumberland Road, Waxahachie, TX 75165
MLS# 21210605Listed by: PHILGOOD REAL ESTATE- Open Sun, 2 to 4pm
 $555,000Active5 beds 5 baths3,209 sq. ft.
462 Wintergreen Drive, Waxahachie, TX 75165
MLS# 21209317Listed by: FATHOM REALTY, LLC  $315,000Pending3 beds 2 baths1,958 sq. ft.
125 Cantle, Waxahachie, TX 75165
MLS# 21204291Listed by: KELLER WILLIAMS REALTY $374,000Active4 beds 3 baths2,202 sq. ft.
2209 Glacier Drive, Waxahachie, TX 75165
MLS# 21208261Listed by: KELLER WILLIAMS LONESTAR DFW $539,000Active4 beds 4 baths2,807 sq. ft.
445 Lost Creek Trail, Waxahachie, TX 75165
MLS# 21201548Listed by: WHITEFLAME REALTY $555,000Active3 beds 2 baths2,158 sq. ft.
525 Becky Lane, Waxahachie, TX 75165
MLS# 21208387Listed by: BK REAL ESTATE $365,000Active4 beds 3 baths1,973 sq. ft.
425 Lost Creek Trail, Waxahachie, TX 75165
MLS# 21201466Listed by: WINTERS LEGACY REALTY $463,000Active3 beds 2 baths1,991 sq. ft.
1739 Riviera Drive, Waxahachie, TX 75165
MLS# 21196155Listed by: COLDWELL BANKER APEX, REALTORS $499,000Active3 beds 3 baths2,319 sq. ft.
533 Lockhart Street, Waxahachie, TX 75165
MLS# 21207846Listed by: HIGHLAND HOMES REALTY $204,900Pending2 beds 2 baths896 sq. ft.
100 Henderson Street, Waxahachie, TX 75165
MLS# 21207485Listed by: LPT REALTY, LLC. $264,900Active3 beds 2 baths1,224 sq. ft.
107 High School Drive, Waxahachie, TX 75165
MLS# 21207730Listed by: KELLER WILLIAMS REALTY DPR $749,000Active7.89 Acres
525 Lake Park Avenue, Waxahachie, TX 75165
MLS# 21206790Listed by: ERICA TITO, BROKER $450,000Active4 beds 2 baths2,125 sq. ft.
111 Treys Way, Godley, TX 76044
MLS# 21202219Listed by: LEAGUE REAL ESTATE $439,900Active4 beds 3 baths2,347 sq. ft.
215 Frio Drive, Waxahachie, TX 75165
MLS# 21206499Listed by: STANDARD REAL ESTATE $140,000Active5.52 Acres
1400 E Jefferson Street, Waxahachie, TX 75165
MLS# 21206868Listed by: BLVD REAL ESTATE $510,000Active4 beds 3 baths3,090 sq. ft.
262 Firelight Drive, Waxahachie, TX 75165
MLS# 21206277Listed by: LEGACY REALTY GROUP $434,990Pending4 beds 3 baths2,653 sq. ft.
417 Hundred Acre Drive, Waxahachie, TX 75165
MLS# 21204908Listed by: HOMESUSA.COM $535,000Active3 beds 2 baths3,025 sq. ft.
3142 S Highway 287, Waxahachie, TX 75165
MLS# 21203457Listed by: COLDWELL BANKER REALTY $312,000Pending3 beds 2 baths1,743 sq. ft.
116 Bison Meadow Drive, Waxahachie, TX 75165
MLS# 21203458Listed by: COLDWELL BANKER REALTY $454,990Pending5 beds 4 baths3,623 sq. ft.
425 Hundred Acre Drive, Waxahachie, TX 75165
MLS# 21204166Listed by: HOMESUSA.COM- Open Sat, 1 to 3pm
 $434,990Active4 beds 3 baths2,653 sq. ft.
440 Hundred Acre Drive, Waxahachie, TX 75165
MLS# 21204192Listed by: HOMESUSA.COM  $434,990Pending4 beds 3 baths2,667 sq. ft.
433 Hundred Acre Drive, Waxahachie, TX 75165
MLS# 21204196Listed by: HOMESUSA.COM- Open Sat, 1 to 3pm
 $460,490Active5 beds 4 baths3,639 sq. ft.
441 Hundred Acre Drive, Waxahachie, TX 75165
MLS# 21204212Listed by: HOMESUSA.COM - Open Sun, 1 to 3pm
 $510,000Active4 beds 4 baths3,084 sq. ft.
602 Dean Box Drive, Waxahachie, TX 75165
MLS# 21196346Listed by: CENTURY 21 JUDGE FITE CO. 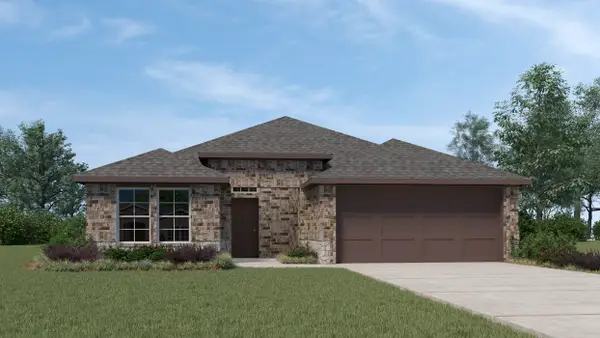 $320,490Pending3 beds 2 baths1,614 sq. ft.
194 Delta Road, Waxahachie, TX 75165
MLS# 21203582Listed by: JEANETTE ANDERSON REAL ESTATE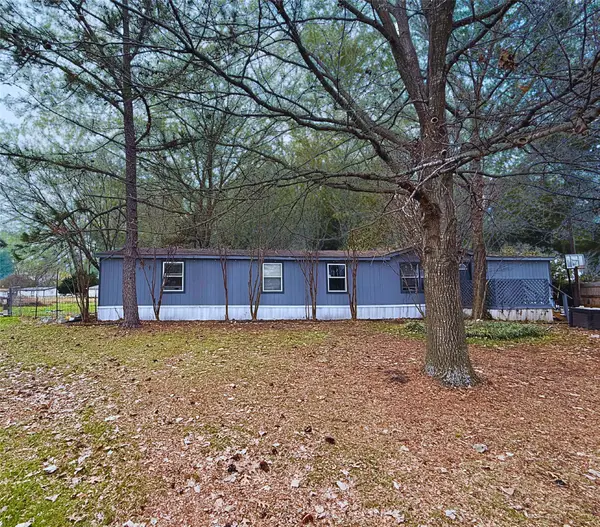 $239,900Active4 beds 2 baths2,128 sq. ft.
460 Chapel Hill Lane, Waxahachie, TX 75165
MLS# 21201918Listed by: CENTURY 21 JUDGE FITE COMPANY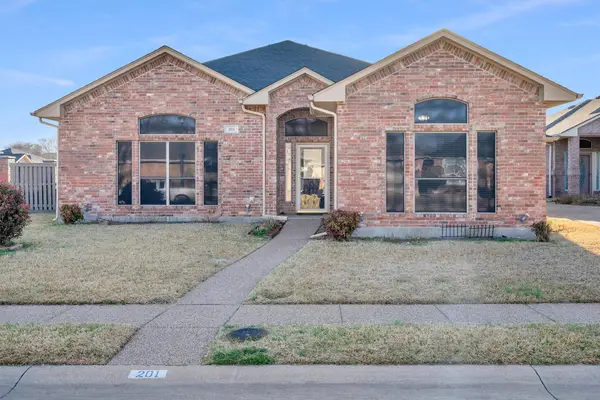 $347,500Pending3 beds 2 baths2,009 sq. ft.
201 Bluebonnet Lane, Waxahachie, TX 75165
MLS# 21202195Listed by: RTR WAXAHACHIE $415,000Active4 beds 3 baths2,276 sq. ft.
910 Panorama Loop, Waxahachie, TX 75165
MLS# 21202334Listed by: TERO REAL ESTATE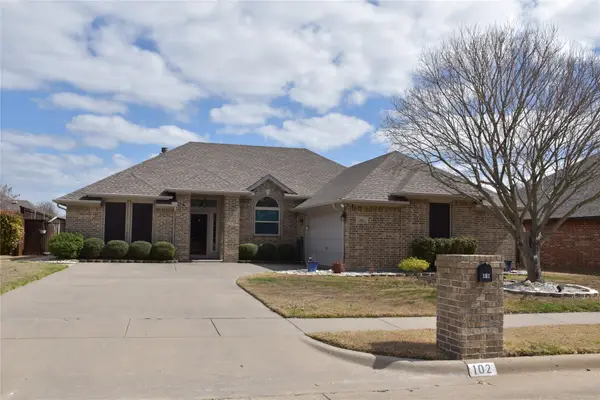 $309,900Active3 beds 2 baths1,589 sq. ft.
102 Monarch Court, Waxahachie, TX 75165
MLS# 21198417Listed by: HOMETOWN REALTY- Open Thu, 10am to 5:30pm
 $474,990Active3 beds 3 baths2,280 sq. ft.
1808 Peace Lily Lane, Waxahachie, TX 75165
MLS# 21201502Listed by: HOMESUSA.COM  $549,900Active4 beds 3 baths2,675 sq. ft.
245 Bent Creek Drive, Waxahachie, TX 75165
MLS# 21200984Listed by: KELLER WILLIAMS REALTY DPR $399,900Active4 beds 2 baths2,255 sq. ft.
212 Lone Star Drive, Waxahachie, TX 75165
MLS# 21201035Listed by: LISTING RESULTS, LLC $359,990Active3 beds 3 baths2,563 sq. ft.
196 Lady Bird Drive, Waxahachie, TX 75165
MLS# 21200406Listed by: REALTY OF AMERICA, LLC $169,000Active2 beds 1 baths782 sq. ft.
608 Highland Avenue, Waxahachie, TX 75165
MLS# 21199436Listed by: KELLER WILLIAMS REALTY $324,900Active3 beds 2 baths1,578 sq. ft.
211 Range Road, Waxahachie, TX 75165
MLS# 21198766Listed by: WORTH CLARK REALTY $539,000Active5 beds 4 baths3,504 sq. ft.
1830 Silver Birch Road, Waxahachie, TX 75165
MLS# 21190196Listed by: COMPASS RE TEXAS , LLC $998,900Active3 beds 4 baths2,684 sq. ft.
360 Forreston Road, Waxahachie, TX 75165
MLS# 21193339Listed by: KELLER WILLIAMS REALTY $369,900Active4 beds 2 baths1,871 sq. ft.
225 Brazos Drive, Waxahachie, TX 75165
MLS# 21199491Listed by: ERIC GERARD REALTY, LLC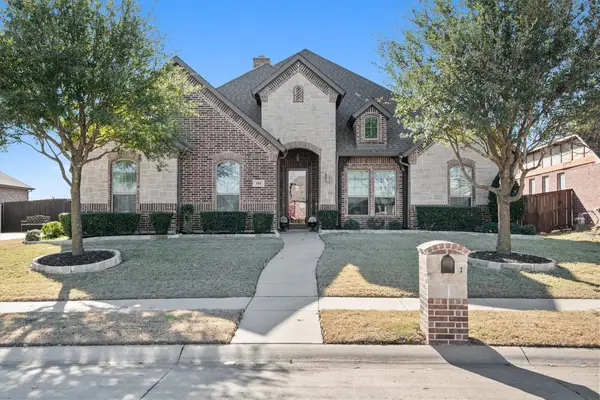 $525,000Active3 beds 2 baths2,384 sq. ft.
116 Old Bridge Road, Waxahachie, TX 75165
MLS# 21180882Listed by: COLDWELL BANKER REALTY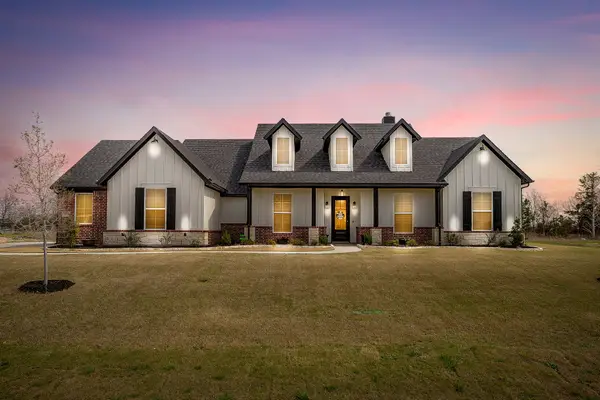 $670,000Active4 beds 3 baths2,833 sq. ft.
133 Aiden Drive, Waxahachie, TX 75165
MLS# 21197713Listed by: RE/MAX TRINITY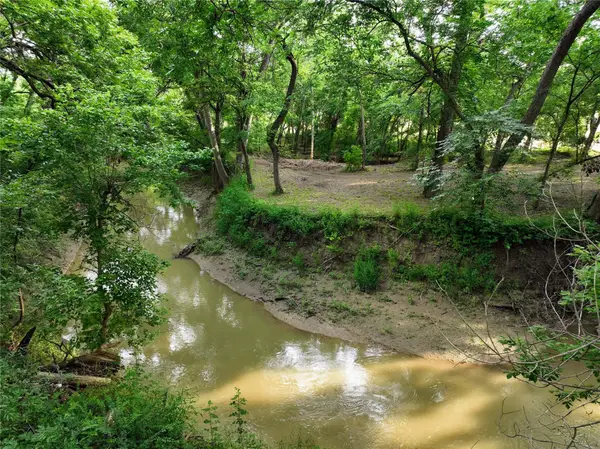 $215,000Active4.48 Acres
TBD Pecan Valley Lane, Waxahachie, TX 75165
MLS# 21198823Listed by: TERO REAL ESTATE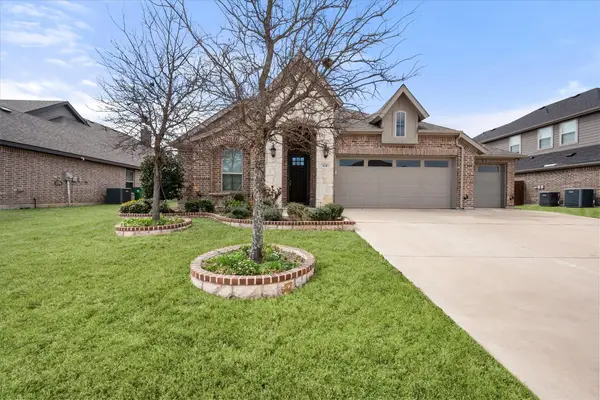 $374,900Active3 beds 2 baths1,732 sq. ft.
124 Sundance Circle, Waxahachie, TX 75165
MLS# 21198888Listed by: BIAN REALTY $545,000Active4 beds 3 baths1,966 sq. ft.
160 Berkshire Lane, Waxahachie, TX 75165
MLS# 21199059Listed by: RE/MAX FRONTIER $475,000Active4 beds 4 baths3,173 sq. ft.
321 Strait Lane, Waxahachie, TX 75165
MLS# 21198904Listed by: EBBY HALLIDAY REALTORS $384,800Pending3 beds 2 baths2,322 sq. ft.
109 Thoroughbred Street, Waxahachie, TX 75165
MLS# 21195206Listed by: KELLER WILLIAMS REALTY $529,000Active3 beds 3 baths2,598 sq. ft.
134 Water Garden Drive, Waxahachie, TX 75165
MLS# 21194619Listed by: COLDWELL BANKER REALTY $299,000Active3 beds 2 baths1,554 sq. ft.
315 Myrtle Avenue, Waxahachie, TX 75165
MLS# 21193125Listed by: POWERSTAR REALTY $305,000Active4 beds 2 baths1,636 sq. ft.
146 Boyce Second Street, Waxahachie, TX 75165
MLS# 21196850Listed by: AMELIA VALDEZ CITY REAL ESTATE $618,500Active4 beds 3 baths2,796 sq. ft.
121 Muscogee Drive, Waxahachie, TX 75165
MLS# 21189057Listed by: FATHOM REALTY LLC $394,990Pending4 beds 3 baths2,465 sq. ft.
436 Hundred Acre Drive, Waxahachie, TX 75165
MLS# 21196541Listed by: HOMESUSA.COM- Open Sat, 1 to 3pm
 $429,990Active5 beds 3 baths3,134 sq. ft.
429 Hundred Acre Drive, Waxahachie, TX 75165
MLS# 21196553Listed by: HOMESUSA.COM - Open Sat, 1 to 3pm
 $359,990Active3 beds 2 baths2,002 sq. ft.
428 Hundred Acre Drive, Waxahachie, TX 75165
MLS# 21196569Listed by: HOMESUSA.COM - Open Sat, 1 to 3pm
 $359,990Active3 beds 2 baths2,002 sq. ft.
444 Hundred Acre Drive, Waxahachie, TX 75165
MLS# 21196600Listed by: HOMESUSA.COM  $364,990Pending4 beds 3 baths2,152 sq. ft.
448 Hundred Acre Drive, Waxahachie, TX 75165
MLS# 21196625Listed by: HOMESUSA.COM $379,990Pending4 beds 3 baths2,152 sq. ft.
437 Hundred Acre Drive, Waxahachie, TX 75165
MLS# 21196647Listed by: HOMESUSA.COM $451,821Active4 beds 4 baths2,817 sq. ft.
394 Bronco Drive, Waxahachie, TX 75165
MLS# 21194532Listed by: CASTLEROCK REALTY, LLC $7,250,000Active73.78 Acres
TBD Fm-878, Waxahachie, TX 75165
MLS# 21194388Listed by: SYMPHONY COMMERCIAL, LLC $544,000Active4 beds 2 baths2,358 sq. ft.
300 Springfield Lane, Red Oak, TX 75154
MLS# 21087808Listed by: FATHOM REALTY $435,000Pending4 beds 3 baths2,434 sq. ft.
395 Haven Road, Waxahachie, TX 75165
MLS# 21194064Listed by: HOMETOWN REALTY $275,000Active4 beds 1 baths1,362 sq. ft.
302 Cumberland Road, Waxahachie, TX 75165
MLS# 21193424Listed by: RE/MAX ARBORS $425,000Active3 beds 3 baths2,981 sq. ft.
308 Bessie Coleman Boulevard, Waxahachie, TX 75165
MLS# 21193849Listed by: LEGACY REALTY GROUP $269,900Pending3 beds 2 baths1,285 sq. ft.
114 E Ross Street, Waxahachie, TX 75165
MLS# 21175347Listed by: SOUTHERN STAR REALTY GROUP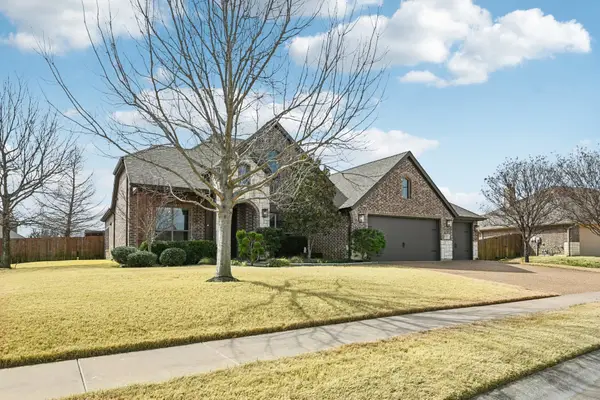 $469,000Pending4 beds 2 baths2,345 sq. ft.
102 Citation Lane, Waxahachie, TX 75165
MLS# 21191929Listed by: TERO REAL ESTATE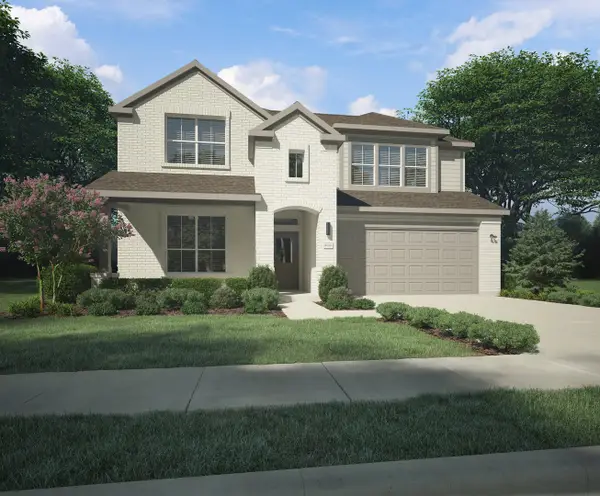 $422,990Active5 beds 4 baths2,956 sq. ft.
464 Hundred Acre Drive, Waxahachie, TX 75165
MLS# 21192493Listed by: HOMESUSA.COM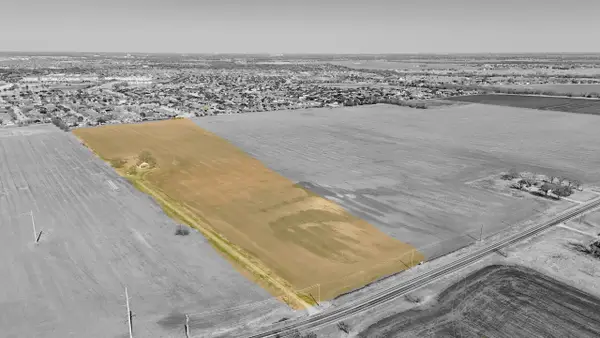 $2,295,000Active25.31 Acres
1931 Fm 878, Waxahachie, TX 75165
MLS# 21192190Listed by: KELLER WILLIAMS REALTY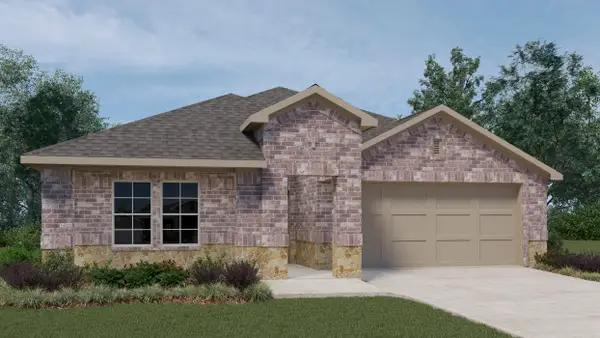 $319,490Pending4 beds 2 baths1,836 sq. ft.
466 Sebastian Lane, Waxahachie, TX 75165
MLS# 21192365Listed by: JEANETTE ANDERSON REAL ESTATE $373,990Pending4 beds 3 baths2,599 sq. ft.
175 Cavalry Lane, Waxahachie, TX 75165
MLS# 21192369Listed by: JEANETTE ANDERSON REAL ESTATE $357,740Pending4 beds 3 baths2,235 sq. ft.
199 Cavalry Lane, Waxahachie, TX 75165
MLS# 21192376Listed by: JEANETTE ANDERSON REAL ESTATE $324,900Active3 beds 2 baths1,764 sq. ft.
104 Coyote Run, Waxahachie, TX 75165
MLS# 21191065Listed by: DORMAN REALTORS, LLC $299,995Active4 beds 2 baths1,872 sq. ft.
113 Frierson Street, Waxahachie, TX 75165
MLS# 21189980Listed by: RE/MAX FRONTIER $310,000Pending4 beds 2 baths2,128 sq. ft.
212 Silver Spur Drive, Waxahachie, TX 75165
MLS# 21191393Listed by: CREEKVIEW REALTY $600,415Active4 beds 4 baths3,479 sq. ft.
119 Tetrad Circle, Waxahachie, TX 75165
MLS# 21191336Listed by: VISIONS REALTY & INVESTMENTS $765,000Active3 beds 4 baths3,366 sq. ft.
106 Lakeshore Drive, Waxahachie, TX 75165
MLS# 21174358Listed by: RACHAEL BRENNEMAN, BROKER $335,000Pending3 beds 2 baths1,740 sq. ft.
115 Aucuba Lane, Waxahachie, TX 75165
MLS# 21189143Listed by: BROWNSTONE REAL ESTATE GROUP $490,000Active4 beds 3 baths2,458 sq. ft.
644 Winters Drive, Waxahachie, TX 75165
MLS# 21189914Listed by: KELLER WILLIAMS LONESTAR DFW $580,000Pending4 beds 2 baths2,715 sq. ft.
112 Shepherds Hill Road, Waxahachie, TX 75165
MLS# 21188413Listed by: LEGACY REALTY GROUP $699,000Active3 beds 2 baths2,898 sq. ft.
109 Homestead Lane, Waxahachie, TX 75165
MLS# 21188910Listed by: REAL ESTATE CENTRE $499,900Active4 beds 3 baths2,504 sq. ft.
232 Woodoat Road, Waxahachie, TX 75165
MLS# 21188071Listed by: PERRY HOMES REALTY LLC $1,200,000Active23.9 Acres
1920 Moseley Road, Ennis, TX 75119
MLS# 21186396Listed by: KELLER WILLIAMS REALTY $544,900Active4 beds 4 baths2,808 sq. ft.
2285 Cooper River Trail, Waxahachie, TX 75165
MLS# 21186331Listed by: MAGNOLIA REALTY $320,000Active4 beds 2 baths2,432 sq. ft.
531 Blair Road, Waxahachie, TX 75165
MLS# 21185147Listed by: 5TH STREAM REALTY $465,000Active4 beds 3 baths3,063 sq. ft.
113 Overhill Drive, Waxahachie, TX 75165
MLS# 21183662Listed by: DAVE PERRY MILLER REAL ESTATE $485,000Active4 beds 3 baths3,289 sq. ft.
250 Bear Trail, Waxahachie, TX 75165
MLS# 21184367Listed by: NB ELITE REALTY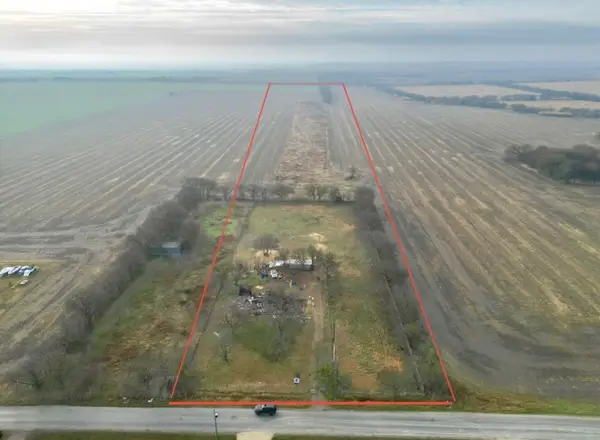 $400,000Active11.13 Acres
1607 Nash Howard Road, Waxahachie, TX 75165
MLS# 21184537Listed by: EXP REALTY LLC- Open Sat, 11am to 5pm
 $451,990Active4 beds 3 baths2,597 sq. ft.
675 Cherry Bark Trail, Waxahachie, TX 75165
MLS# 21184582Listed by: CHESMAR HOMES  $499,999Pending4 beds 3 baths2,699 sq. ft.
604 Majestic Oak Lane, Waxahachie, TX 75165
MLS# 21184602Listed by: CHESMAR HOMES $475,000Active3 beds 3 baths2,674 sq. ft.
1858 Riviera Drive, Waxahachie, TX 75165
MLS# 21181580Listed by: FRITZ REALTY GROUP LLC $380,000Active4 beds 2 baths2,066 sq. ft.
326 Sagebrush Lane, Waxahachie, TX 75165
MLS# 21182897Listed by: COLDWELL BANKER REALTY $457,499Active3 beds 4 baths2,920 sq. ft.
1696 Storey Lane, Waxahachie, TX 75165
MLS# 21178505Listed by: GREAT WESTERN REALTY- Open Sat, 1 to 3pm
 $357,990Active3 beds 2 baths2,002 sq. ft.
421 Hundred Acre Drive, Waxahachie, TX 75165
MLS# 21181888Listed by: HOMESUSA.COM  $402,490Pending4 beds 3 baths2,466 sq. ft.
424 Hundred Acre Drive, Waxahachie, TX 75165
MLS# 21181891Listed by: HOMESUSA.COM $364,990Pending4 beds 3 baths2,152 sq. ft.
432 Hundred Acre Drive, Waxahachie, TX 75165
MLS# 21181894Listed by: HOMESUSA.COM $449,999Pending4 beds 2 baths2,256 sq. ft.
257 Pine Leaf Trail, Waxahachie, TX 75165
MLS# 21181660Listed by: HOMESUSA.COM $429,999Active4 beds 2 baths2,361 sq. ft.
224 Pine Leaf Trail, Waxahachie, TX 75165
MLS# 21181668Listed by: HOMESUSA.COM $879,000Active3 beds 3 baths2,472 sq. ft.
346 Forreston Road, Waxahachie, TX 75165
MLS# 21175401Listed by: ONDEMAND REALTY $415,000Active3 beds 3 baths1,792 sq. ft.
201 Rosa Street, Waxahachie, TX 75165
MLS# 21180999Listed by: MONUMENT REALTY $365,000Active3 beds 2 baths1,578 sq. ft.
500 Farley Street, Waxahachie, TX 75165
MLS# 21180815Listed by: MONUMENT REALTY- Open Sat, 12 to 4pm
 $682,274Active4 beds 4 baths3,667 sq. ft.
229 Pine Leaf Trail, Waxahachie, TX 75165
MLS# 21180427Listed by: HOMESUSA.COM  $325,000Active3 beds 2 baths1,739 sq. ft.
603 Columbia Avenue, Waxahachie, TX 75165
MLS# 21154527Listed by: COLDWELL BANKER REALTY $340,000Active4 beds 3 baths2,261 sq. ft.
706 Perry Avenue, Waxahachie, TX 75165
MLS# 21180091Listed by: RE/MAX INNOVATIONS $550,000Active3 beds 3 baths2,546 sq. ft.
4927 Fm 878, Waxahachie, TX 75165
MLS# 21175226Listed by: ONDEMAND REALTY $440,000Pending4 beds 3 baths2,785 sq. ft.
1504 Reagan Avenue, Waxahachie, TX 75165
MLS# 21179257Listed by: REFIND REALTY INC. $340,000Active4 beds 3 baths2,261 sq. ft.
708 Perry Avenue, Waxahachie, TX 75165
MLS# 21179908Listed by: RE/MAX INNOVATIONS $389,700Active4 beds 3 baths2,350 sq. ft.
113 Rain Cloud Drive, Waxahachie, TX 75165
MLS# 21179385Listed by: ALL CITY $449,900Pending4 beds 3 baths2,617 sq. ft.
264 Sparkling Springs Drive, Waxahachie, TX 75165
MLS# 21179252Listed by: HOMESUSA.COM $443,000Active4 beds 3 baths2,332 sq. ft.
101 S Haven Place, Waxahachie, TX 75165
MLS# 21174411Listed by: FATHOM REALTY $649,900Active4 beds 4 baths3,257 sq. ft.
837 Peppervine Drive, Waxahachie, TX 75165
MLS# 21176634Listed by: EMERY REALTY, LLC $764,900Active4 beds 2 baths2,978 sq. ft.
1043 Bells Chapel Road, Pecan Hill, TX 75165
MLS# 21174817Listed by: KELLER WILLIAMS REALTY $574,922Active4 beds 2 baths2,355 sq. ft.
124 Lila Lake Drive, Waxahachie, TX 75165
MLS# 21199501Listed by: RE/MAX FRONTIER $634,966Active4 beds 4 baths2,665 sq. ft.
108 Lila Lake Drive, Waxahachie, TX 75165
MLS# 21201341Listed by: RE/MAX FRONTIER $285,000Active3 beds 2 baths1,720 sq. ft.
101 Noel Street, Waxahachie, TX 75165
MLS# 21162755Listed by: PINNACLE REALTY ADVISORS $444,800Active4 beds 3 baths2,969 sq. ft.
504 Lowland Lane, Waxahachie, TX 75165
MLS# 21177220Listed by: KELLER WILLIAMS CENTRAL $459,900Active4 beds 3 baths2,768 sq. ft.
520 Winchester Way, Waxahachie, TX 75165
MLS# 21177777Listed by: PINNACLE REALTY ADVISORS $551,236Active4 beds 3 baths3,280 sq. ft.
182 Memory Lane, Waxahachie, TX 75165
MLS# 21177022Listed by: VISIONS REALTY & INVESTMENTS $370,000Active4 beds 4 baths2,154 sq. ft.
527 Gingerbread Lane, Waxahachie, TX 75165
MLS# 21176613Listed by: COLDWELL BANKER REALTY $545,000Active4 beds 4 baths3,405 sq. ft.
476 Wolf Creek Drive, Waxahachie, TX 75165
MLS# 21170417Listed by: ORCHARD BROKERAGE $560,000Pending4 beds 3 baths2,872 sq. ft.
113 Diamond Lane, Waxahachie, TX 75165
MLS# 21172550Listed by: COLDWELL BANKER REALTY $289,999Active3 beds 2 baths1,830 sq. ft.
205 San Jacinto Court, Waxahachie, TX 75165
MLS# 21170157Listed by: ORCHARD BROKERAGE $439,999Active4 beds 3 baths2,835 sq. ft.
452 Leopold, Waxahachie, TX 75165
MLS# 21172522Listed by: FATHOM REALTY LLC $325,000Active2 beds 2 baths1,566 sq. ft.
111 Mckenzie Street, Waxahachie, TX 75165
MLS# 21171142Listed by: KELLER WILLIAMS REALTY $363,490Pending4 beds 3 baths2,334 sq. ft.
209 Cavalry Lane, Waxahachie, TX 75165
MLS# 21171727Listed by: JEANETTE ANDERSON REAL ESTATE $350,490Pending4 beds 3 baths2,235 sq. ft.
463 Los Alamitos Way, Waxahachie, TX 75165
MLS# 21171755Listed by: JEANETTE ANDERSON REAL ESTATE $328,490Pending4 beds 2 baths1,791 sq. ft.
182 Delta Road, Waxahachie, TX 75165
MLS# 21171571Listed by: JEANETTE ANDERSON REAL ESTATE $690,000Pending4 beds 3 baths2,750 sq. ft.
1744 Fm-387, Waxahachie, TX 75165
MLS# 21170432Listed by: RENDON REALTY, LLC $199,000Active2.2 Acres
TBD Lot 28 Ridgecrest Drive, Waxahachie, TX 75165
MLS# 21170668Listed by: TEXAS INVESTORS REALTY $199,000Active1.91 Acres
TBD Lot 29 Ridgecrest Drive, Waxahachie, TX 75165
MLS# 21170831Listed by: TEXAS INVESTORS REALTY $370,000Active4 beds 3 baths2,153 sq. ft.
206 Farley Street, Waxahachie, TX 75165
MLS# 21200843Listed by: REAL BROKER, LLC $165,900Pending3 beds 2 baths1,484 sq. ft.
207 Thompson Street, Waxahachie, TX 75165
MLS# 21160665Listed by: KELLER WILLIAMS REALTY $444,900Pending5 beds 4 baths2,865 sq. ft.
416 Lost Creek Trail, Waxahachie, TX 75165
MLS# 21169863Listed by: PINNACLE REALTY ADVISORS $635,000Active10.1 Acres
283 Old Church Road, Waxahachie, TX 75165
MLS# 21169545Listed by: BATES REAL ESTATE, LLC $429,990Pending4 beds 3 baths2,653 sq. ft.
384 Blackwater Trail, Waxahachie, TX 75165
MLS# 21169581Listed by: HOMESUSA.COM $339,500Active3 beds 2 baths1,958 sq. ft.
115 Holly Street, Waxahachie, TX 75165
MLS# 21167891Listed by: EBBY HALLIDAY, REALTORS $615,000Active4 beds 3 baths2,469 sq. ft.
112 Springfield Lane, Red Oak, TX 75165
MLS# 21129512Listed by: CENTURY 21 JUDGE FITE CO. $1,485,000Active4 beds 2 baths1,800 sq. ft.
358 E Pecan Street, Waxahachie, TX 75165
MLS# 21166134Listed by: COLDWELL BANKER REALTY $469,900Active5 beds 3 baths3,151 sq. ft.
540 Moonrise Street, Waxahachie, TX 75165
MLS# 21166277Listed by: COLDWELL BANKER REALTY $529,990Active4 beds 3 baths3,337 sq. ft.
205 Twilight Way, Waxahachie, TX 75165
MLS# 21166776Listed by: DAVID M. WEEKLEY $249,900Active3 beds 2 baths1,379 sq. ft.
807 Kaufman Street, Waxahachie, TX 75165
MLS# 21166211Listed by: KELLER WILLIAMS REALTY $80,000Active0.55 Acres
1200 Dr Martin Luther King Jr Boulevard, Waxahachie, TX 75165
MLS# 21166169Listed by: ONLY 1 REALTY GROUP NORTH DALLAS $321,000Pending3 beds 2 baths1,728 sq. ft.
1536 Owen Way, Waxahachie, TX 75165
MLS# 21159350Listed by: REAL BROKER, LLC $547,000Pending5 beds 3 baths2,895 sq. ft.
124 Windsor Circle, Waxahachie, TX 75165
MLS# 21160247Listed by: EXP REALTY LLC $321,120Pending4 beds 2 baths1,836 sq. ft.
183 Arion Road, Waxahachie, TX 75165
MLS# 21165587Listed by: JEANETTE ANDERSON REAL ESTATE $301,490Pending3 beds 2 baths1,450 sq. ft.
515 Aligato Street, Waxahachie, TX 75165
MLS# 21165527Listed by: JEANETTE ANDERSON REAL ESTATE $328,500Pending4 beds 2 baths1,801 sq. ft.
104 Tioga Circle, Waxahachie, TX 75165
MLS# 21165335Listed by: LANEE SCOTT REALTORS, LLC $575,000Active4 beds 3 baths4,246 sq. ft.
529 N Grand Avenue, Waxahachie, TX 75165
MLS# 21164407Listed by: NEXTHOME ON MAIN $384,000Active3 beds 3 baths2,266 sq. ft.
101 Village Gate Drive, Waxahachie, TX 75165
MLS# 21164216Listed by: JOE RUST COMPANY $885,000Active4 beds 4 baths3,476 sq. ft.
3020 Stonebriar Drive, Waxahachie, TX 75165
MLS# 21164080Listed by: LEGACY REALTY GROUP $451,189Active4 beds 3 baths2,513 sq. ft.
367 Bronco Drive, Waxahachie, TX 75165
MLS# 21163451Listed by: CASTLEROCK REALTY, LLC $496,108Active4 beds 4 baths2,817 sq. ft.
424 Bronco Drive, Waxahachie, TX 75165
MLS# 21163350Listed by: CASTLEROCK REALTY, LLC $438,320Active4 beds 3 baths2,513 sq. ft.
343 Caviar Road, Waxahachie, TX 75165
MLS# 21163401Listed by: CASTLEROCK REALTY, LLC $484,874Active4 beds 3 baths2,513 sq. ft.
416 Bronco Drive, Waxahachie, TX 75165
MLS# 21163319Listed by: CASTLEROCK REALTY, LLC $512,500Active3 beds 2 baths2,692 sq. ft.
669 Brookhaven Court, Waxahachie, TX 75165
MLS# 21158829Listed by: KELLER WILLIAMS REALTY
Local realty services provided by:CENTURY 21 Judge Fite Company, CENTURY 21 Lucky Money Real Estate
Information provided, in part, by North Texas Real Estate Information Systems, Inc. Last Updated April 22, 2026 Listings with the NTREIS logo are listed by brokerages other than CENTURY 21 Judge Fite Company.
Copyright 2026, Houston Realtors Information Service, Inc. All information provided is deemed reliable but is not guaranteed and should be independently verified. IDX information is provided exclusively for consumers' personal, non-commercial use, it may not be used for any purpose other than to identify prospective properties consumers may be interested in purchasing, and the data is deemed reliable but is not guaranteed accurate by the MLS.
Popular searches near 75165
Popular neighborhoods near 75165
- Bear Creek Ranch, Lancaster homes for sale
- Brookview, Cedar Hill homes for sale
- Cedar Crest, Cedar Hill homes for sale
- Chapel Hill, Desoto homes for sale
- Creek Tree Estates, Desoto homes for sale
- Downtown Midlothian, Midlothian homes for sale
- Downtown Waxahachie, Waxahachie homes for sale
- Lancaster Historic District, Lancaster homes for sale
- Lancaster Park, Lancaster homes for sale
- Longbranch, Midlothian homes for sale
- Meadow Creek Estates, Lancaster homes for sale
- Millbrook, Lancaster homes for sale
- Mockingbird Hill, Desoto homes for sale
- Pebblebrook, Lancaster homes for sale
- South Hills Park, Cedar Hill homes for sale
- South Meadows, Desoto homes for sale
- Springfield, Cedar Hill homes for sale
- Stonewood Heights, Cedar Hill homes for sale
- Ten Mile Creek, Lancaster homes for sale
- Waynelee Heights, Lancaster homes for sale
Counties near Waxahachie, 75165
- Bosque County homes for sale
- Collin County homes for sale
- Dallas County homes for sale
- Denton County homes for sale
- Ellis County homes for sale
- Freestone County homes for sale
- Henderson County homes for sale
- Hill County homes for sale
- Hood County homes for sale
- Hunt County homes for sale
- Johnson County homes for sale
- Kaufman County homes for sale
- Limestone County homes for sale
- McLennan County homes for sale
- Navarro County homes for sale
- Parker County homes for sale
- Rockwall County homes for sale
- Somervell County homes for sale
- Tarrant County homes for sale
- Van Zandt County homes for sale
Protect your home and budget from life's surprises with an Assurant Home Warranty, backed by a partner that supports you through every step of homeownership. Explore Plans.
©2026 Century 21 Real Estate LLC. All rights reserved. CENTURY 21®, the CENTURY 21 Logo and C21® are service marks owned by Century 21 Real Estate LLC. Century 21 Real Estate LLC fully supports the principles of the Fair Housing Act and the Equal Opportunity Act. Each office is independently owned and operated. Listing information is deemed reliable but not guaranteed accurate.