- Birchwood, Little Rock homes for sale
- Chenal Valley, Little Rock homes for sale
- Evergreen, Little Rock homes for sale
- Gap Creek, Sherwood homes for sale
- Hall High, Little Rock homes for sale
- Heights, Little Rock homes for sale
- Kingwood, Little Rock homes for sale
- Leawood, Little Rock homes for sale
- Meriwether, Little Rock homes for sale
- Pinnacle Valley, Little Rock homes for sale
- Pleasant Valley, Little Rock homes for sale
- Pulaski Heights, Little Rock homes for sale
- River Ridge, Little Rock homes for sale
- Scenic Hill, North Little Rock homes for sale
- Sturbridge, Little Rock homes for sale
- The Country Club of Arkansas, Maumelle homes for sale
- The Villages of Wellington, Little Rock homes for sale
- Walnut Valley, Little Rock homes for sale
- West Pulaski County, Little Rock homes for sale
- West Village, Little Rock homes for sale
Wooster, AR - homes for sale
9 of 9 results displayed
- New
 $315,000Active4 beds 2 baths1,928 sq. ft.
10 Parkway Road, Greenbrier, AR 72058
MLS# 26029959Listed by: LPT REALTY CONWAY 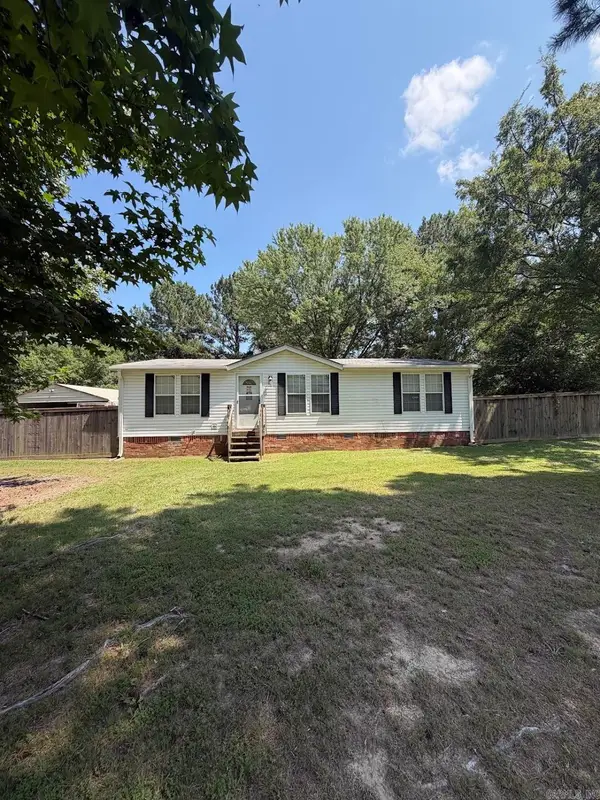 $120,000Active3 beds 2 baths1,144 sq. ft.
2 E Mobbs Circle, Greenbrier, AR 72058
MLS# 26027927Listed by: MID SOUTH REALTY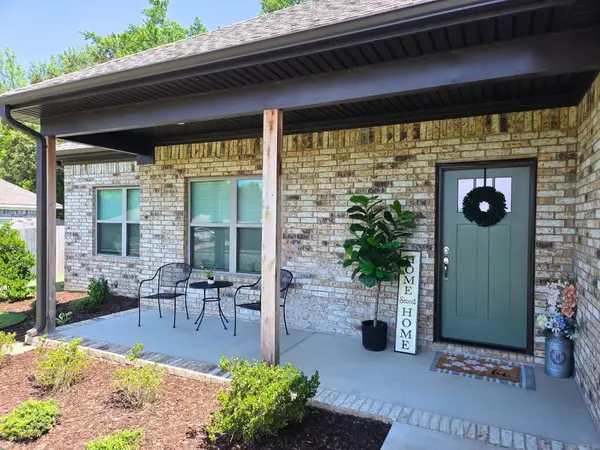 $312,000Active4 beds 2 baths1,799 sq. ft.
65 Lewis Loop, Greenbrier, AR 72058
MLS# 26027653Listed by: EXP REALTY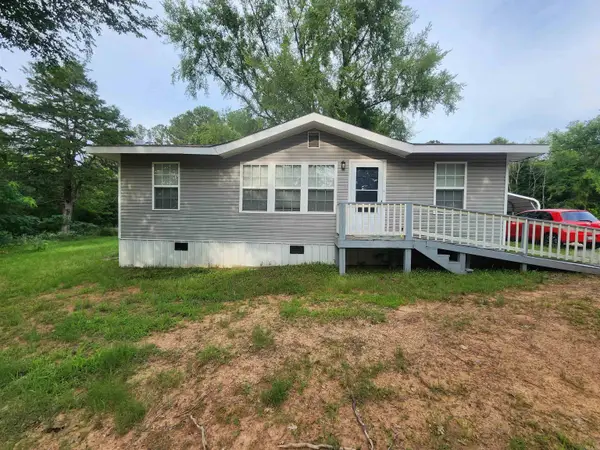 $129,900Active2 beds 2 baths760 sq. ft.
121 Patton Road, Greenbrier, AR 72058
MLS# 26022625Listed by: RE/MAX REALTY GROUP $540,000Active4 beds 4 baths3,403 sq. ft.
4 Evergreen Cove, Greenbrier, AR 72058
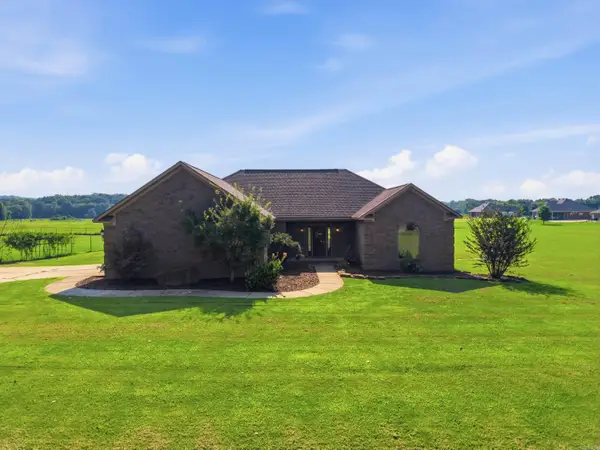
MLS# 26018706Listed by: LPT REALTY CONWAY $369,900Active4 beds 2 baths1,960 sq. ft.
39 Church Circle, Greenbrier, AR 72058
MLS# 26014440Listed by: J.C. THORNTON & CO., LLC $375,000Active4 beds 2 baths2,068 sq. ft.
23 Sablewood Drive, Greenbrier, AR 72058
MLS# 26013685Listed by: CBRPM CONWAY $499,500Active3 beds 3 baths2,718 sq. ft.
36 Church Circle, Greenbrier, AR 72058
MLS# 26013223Listed by: ERA TEAM REAL ESTATE $627,500Active1.81 Acres
3 Robinson Road, Wooster, AR 72181
MLS# 26006998Listed by: REMAX ULTIMATE
Local realty services provided by:CENTURY 21 H.S.V. Realty
Neighborhoods near Wooster, AR
Zip codes near Wooster, AR
- 72013 homes for sale
- 72016 homes for sale
- 72027 homes for sale
- 72030 homes for sale
- 72032 homes for sale
- 72034 homes for sale
- 72039 homes for sale
- 72047 homes for sale
- 72058 homes for sale
- 72061 homes for sale
- 72063 homes for sale
- 72070 homes for sale
- 72106 homes for sale
- 72110 homes for sale
- 72111 homes for sale
- 72125 homes for sale
- 72127 homes for sale
- 72131 homes for sale
- 72157 homes for sale
- 72173 homes for sale
Popular searches near Wooster, AR
- Cadron homes for sale
- California homes for sale
- Catholic Point homes for sale
- Clifton homes for sale
- Conway homes for sale
- East Fork homes for sale
- Greenbrier homes for sale
- Guy homes for sale
- Hardin homes for sale
- Harve homes for sale
- Holland homes for sale
- Howard homes for sale
- Matthews homes for sale
- Plumerville homes for sale
- Springfield homes for sale
- Steele homes for sale
- Twin Groves homes for sale
- Union homes for sale
- Union homes for sale
- Walker homes for sale
Protect your home and budget from life's surprises with an Assurant Home Warranty, backed by a partner that supports you through every step of homeownership. Explore Plans.
©2026 Century 21 Real Estate LLC. All rights reserved. CENTURY 21®, the CENTURY 21 Logo and C21® are service marks owned by Century 21 Real Estate LLC. Century 21 Real Estate LLC fully supports the principles of the Fair Housing Act and the Equal Opportunity Act. Each office is independently owned and operated. Listing information is deemed reliable but not guaranteed accurate.