- Allentown homes for sale
- Bethlehem homes for sale
- Bethlehem homes for sale
- Catasauqua homes for sale
- Cementon homes for sale
- Center Valley homes for sale
- Coplay homes for sale
- Dorneyville homes for sale
- Egypt homes for sale
- Emmaus homes for sale
- Fountain Hill homes for sale
- Fullerton homes for sale
- Hanover homes for sale
- Hokendauqua homes for sale
- Northampton homes for sale
- Salisbury Township homes for sale
- South Whitehall Township homes for sale
- Stiles homes for sale
- Wescosville homes for sale
- Whitehall homes for sale
18102, PA - homes for sale
16 of 16 results displayed
- Open Sat, 12 to 2pmNew
 $329,900Active3 beds 3 baths1,682 sq. ft.
1603 Tilghman Street, Allentown City, PA 18102
MLS# 778060Listed by: WEICHERT REALTORS - ALLENTOWN - New
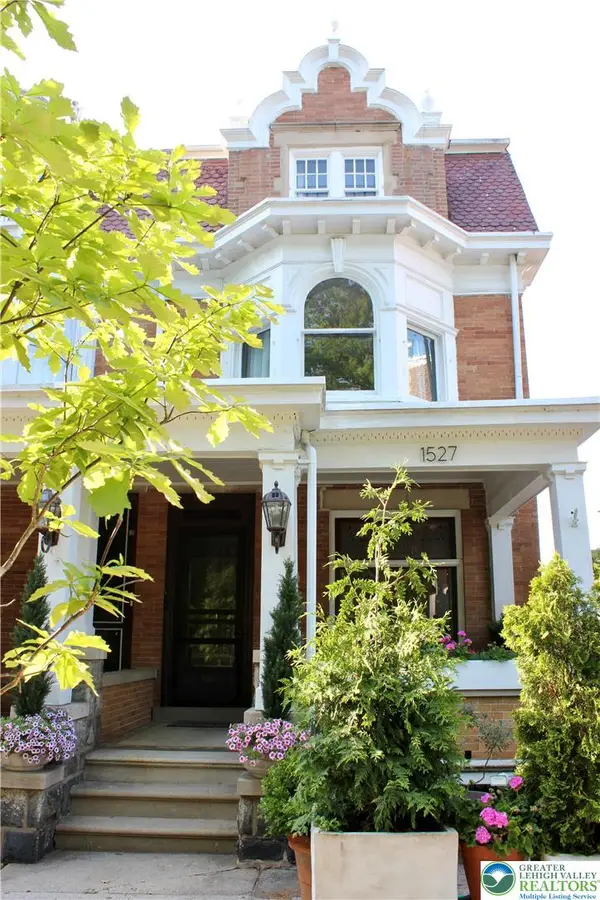 $334,900Active4 beds 2 baths2,420 sq. ft.
1527 W Turner Street, Allentown City, PA 18102
MLS# 778403Listed by: BHHS FOX & ROACH - ALLENTOWN - New
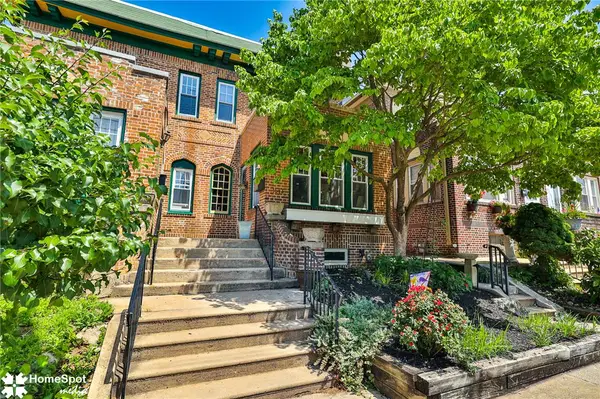 $299,900Active3 beds 2 baths2,442 sq. ft.
1513 Union Street, Allentown City, PA 18102
MLS# 780197Listed by: HOUSE & LAND REAL ESTATE - New
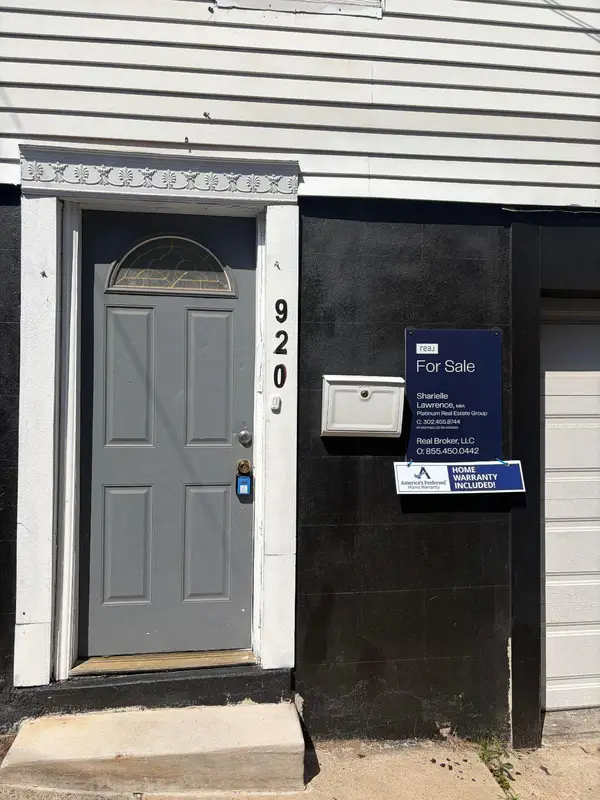 $182,000Active3 beds 1 baths1,032 sq. ft.
920 N Fair St, ALLENTOWN, PA 18102
MLS# PALH2016050Listed by: REAL OF PENNSYLVANIA - New
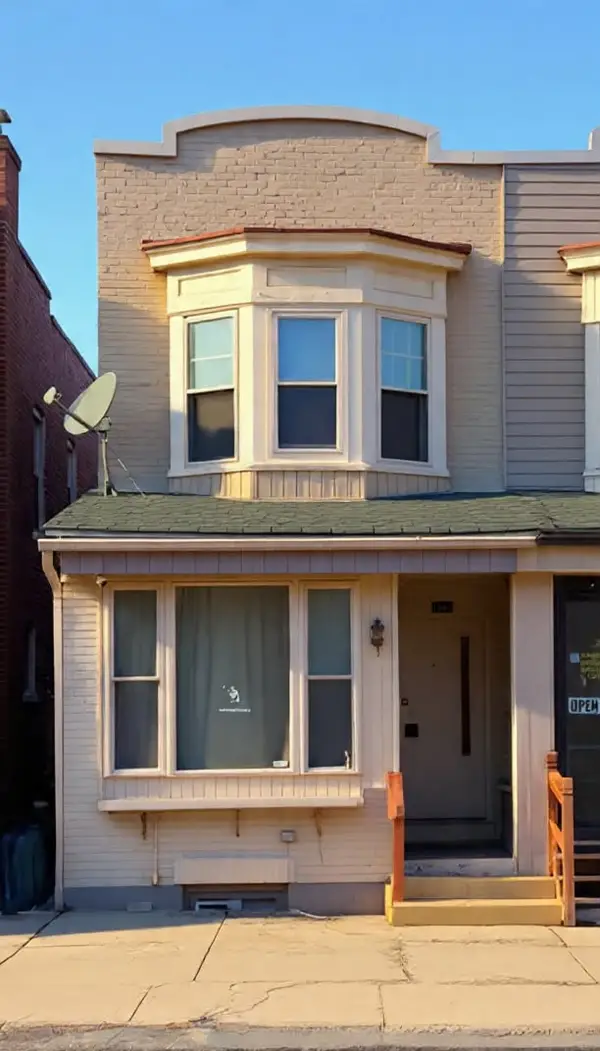
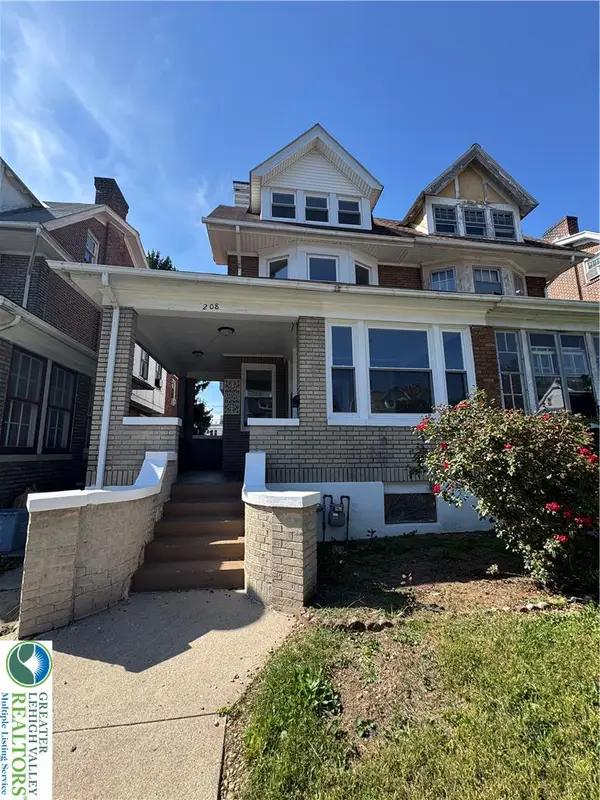 $349,900Active5 beds 2 baths2,042 sq. ft.
208 S 16th Street, Allentown City, PA 18102
MLS# 780099Listed by: HOMESNIPE REAL ESTATE, LLC - New
 $175,000Active3 beds 1 baths805 sq. ft.
755 N Nagle Street, Allentown City, PA 18102
MLS# 780093Listed by: WEICHERT REALTORS  $200,000Active3 beds 1 baths1,166 sq. ft.
335 14th Street, Allentown City, PA 18102
MLS# 779353Listed by: UNITED REALESTATE STRIVE212 LV $229,900Active3 beds 1 baths1,242 sq. ft.
27 W Allen Street, Allentown City, PA 18102
MLS# 779217Listed by: REAL ESTATE OF AMERICA $449,999Active5 beds 2 baths4,178 sq. ft.
1150 Ridge Ave, Allentown City, PA 18102
MLS# 778580Listed by: IRONVALLEY RE OF LEHIGH VALLEY $450,000Active3 beds 4 baths19,470 sq. ft.
1401 W Pennsylvania St, ALLENTOWN, PA 18102
MLS# PALH2015848Listed by: SPRINGER REALTY GROUP $349,900Active4 beds 1 baths2,700 sq. ft.
1350 Highland Street, Allentown City, PA 18102
MLS# 778631Listed by: HOMESNIPE REAL ESTATE, LLC $397,000Pending3 beds 3 baths1,786 sq. ft.
1646 W Cedar Street, Allentown, PA 18102
MLS# PM-141854Listed by: KELLER WILLIAMS REAL ESTATE - WEST END $220,000Active3 beds 2 baths2,687 sq. ft.
228 N 20th Street, Allentown City, PA 18102
MLS# 777975Listed by: KELLER WILLIAMS REAL ESTATE $290,000Active6 beds 2 baths3,450 sq. ft.
232 4th Street, Allentown, PA 18102
MLS# 26-2217Listed by: WYCHOCK REAL ESTATE, LLC $200,000Active3 beds 2 baths1,008 sq. ft.
1238 N 15th Street, Allentown City, PA 18102
MLS# 776209Listed by: I-DO REAL ESTATE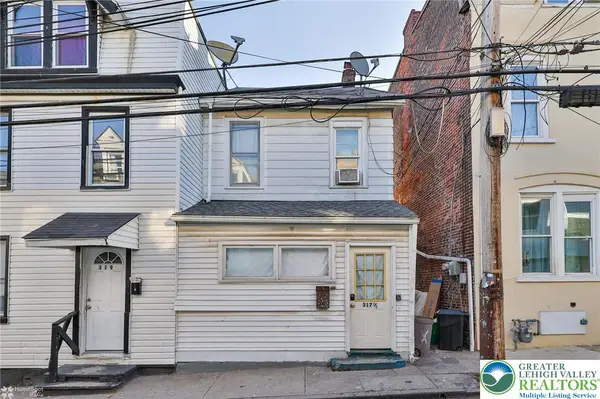 $185,000Active3 beds 1 baths1,326 sq. ft.
317 N Law Street, Allentown City, PA 18102
MLS# 773002Listed by: STEEL CITY REALTY
Local realty services provided by:CENTURY 21 Gold, CENTURY 21 New Millennium, CENTURY 21 Select Group
Popular searches near 18102
Popular neighborhoods near 18102
- 1St Ward, Allentown homes for sale
- 6th Ward, Allentown homes for sale
- 7th Street, Allentown homes for sale
- Center City, Allentown homes for sale
- Dawn Square, Allentown homes for sale
- Downtown, Allentown homes for sale
- Dutch Hill, Allentown homes for sale
- East Side, Allentown homes for sale
- Fairgrounds, Allentown homes for sale
- Fairviewers, Allentown homes for sale
- Hamilton Park, Allentown homes for sale
- Highland Park, Allentown homes for sale
- Jordan Creek, Allentown homes for sale
- Lehigh Parkway, Allentown homes for sale
- Old Allentown Historic District, Allentown homes for sale
- Rittersville, Allentown homes for sale
- South Side, Allentown homes for sale
- The Wards, Allentown homes for sale
- West End, Allentown homes for sale
- West End Theatre District, Allentown homes for sale
Counties near Allentown, 18102
- Berks County homes for sale
- Bucks County homes for sale
- Carbon County homes for sale
- Chester County homes for sale
- Delaware County homes for sale
- Hunterdon County homes for sale
- Lebanon County homes for sale
- Lehigh County homes for sale
- Luzerne County homes for sale
- Mercer County homes for sale
- Monroe County homes for sale
- Montgomery County homes for sale
- Morris County homes for sale
- Northampton County homes for sale
- Philadelphia County homes for sale
- Pike County homes for sale
- Schuylkill County homes for sale
- Somerset County homes for sale
- Sussex County homes for sale
- Warren County homes for sale
Protect your home and budget from life's surprises with an Assurant Home Warranty, backed by a partner that supports you through every step of homeownership. Explore Plans.
©2026 Century 21 Real Estate LLC. All rights reserved. CENTURY 21®, the CENTURY 21 Logo and C21® are service marks owned by Century 21 Real Estate LLC. Century 21 Real Estate LLC fully supports the principles of the Fair Housing Act and the Equal Opportunity Act. Each office is independently owned and operated. Listing information is deemed reliable but not guaranteed accurate.