- Catalina Lakes, Miami homes for sale
- Cocoplum, Miami homes for sale
- Cocoplum, Coral Gables homes for sale
- Coral Gables Riviera, Miami homes for sale
- Cutler, Miami homes for sale
- Dadeland, Miami homes for sale
- East South Miami, Miami homes for sale
- Gables Bayfront, Miami homes for sale
- Gables by the Sea, Miami homes for sale
- High Pines, Miami homes for sale
- Kendall, Miami homes for sale
- Ponce, Miami homes for sale
- South Gables, Miami homes for sale
- South Miami City West, Miami homes for sale
- Sunrise Harbour, Miami homes for sale
- Sunset East, Miami homes for sale
- Sunset West, Miami homes for sale
- The Falls, Miami homes for sale
- West Cutler Area, Miami homes for sale
- West South Miami, Miami homes for sale
East Kendall, Miami, FL - homes for sale
229 of 229 results displayed
- New
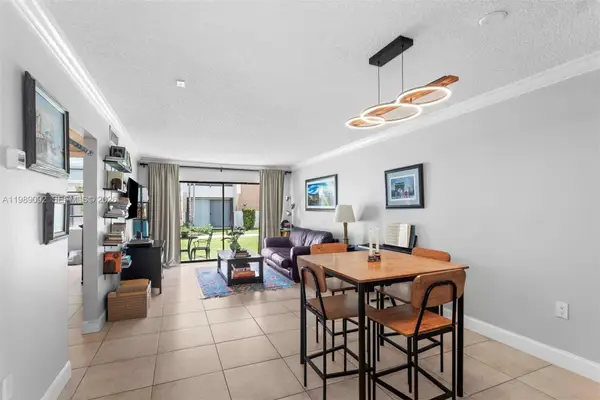 $265,000Active1 beds 1 baths672 sq. ft.
8287 SW 128th St #109, Pinecrest, FL 33156
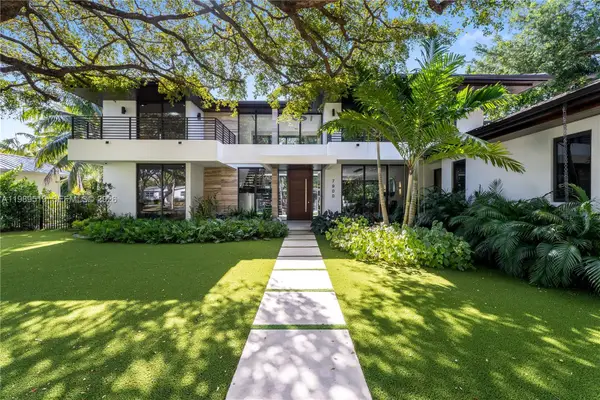
MLS# A11989092Listed by: DOUGLAS ELLIMAN 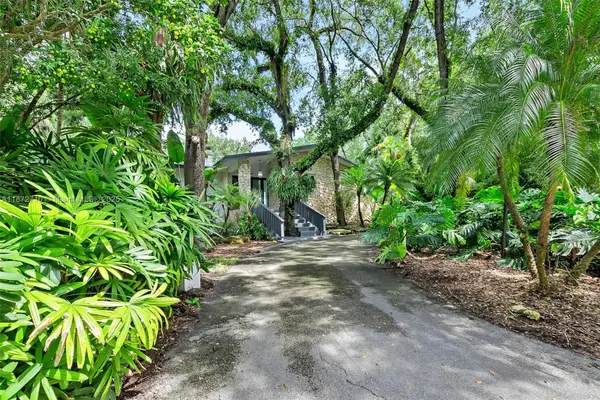 $3,189,000Active5 beds 4 baths4,568 sq. ft.
6565 SW 134th Dr, Pinecrest, FL 33156
MLS# A11872710Listed by: CAPITAL BROKERS, LLC.- New
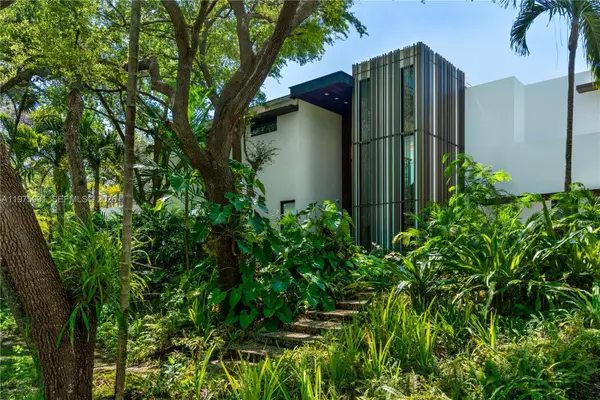 $7,475,000Active7 beds 6 baths6,065 sq. ft.
12220 Rock Garden Ln, Pinecrest, FL 33156
MLS# A11975991Listed by: ONE SOTHEBY'S INTERNATIONAL REALTY - New
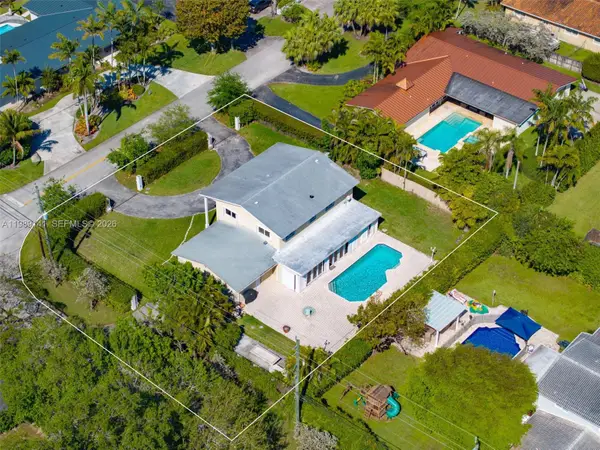 $2,100,000Active5 beds 3 baths3,827 sq. ft.
7390 SW 114th St, Pinecrest, FL 33156
MLS# A11989141Listed by: COMPASS FLORIDA, LLC - New
 $1,999,999Active3 beds 2 baths2,184 sq. ft.
7920 SW 132nd St, Pinecrest, FL 33156
MLS# A11991075Listed by: LIFESTYLE INTERNATIONAL REALTY - New
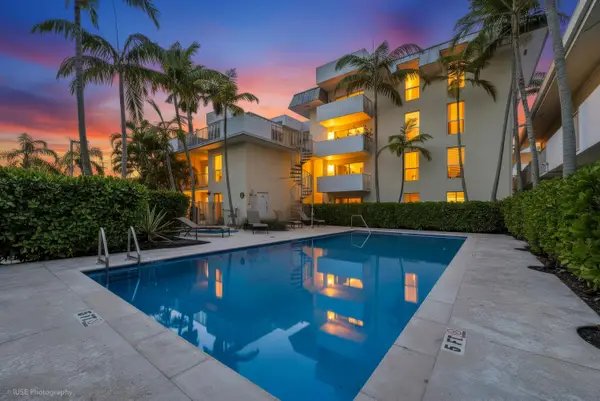
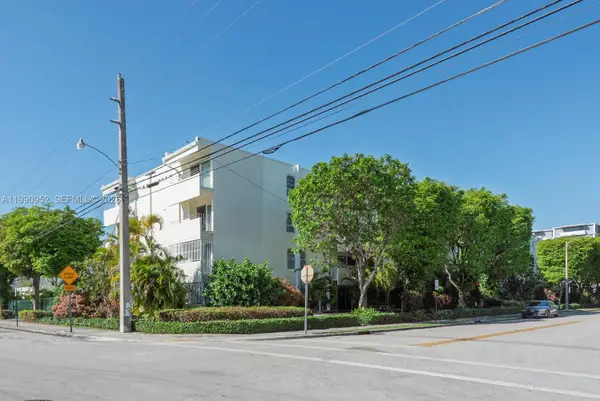 $599,000Active2 beds 2 baths1,290 sq. ft.
5838 SW 74th Ter #314, South Miami, FL 33143
MLS# A11990952Listed by: RE/MAX ADVANCE REALTY - New
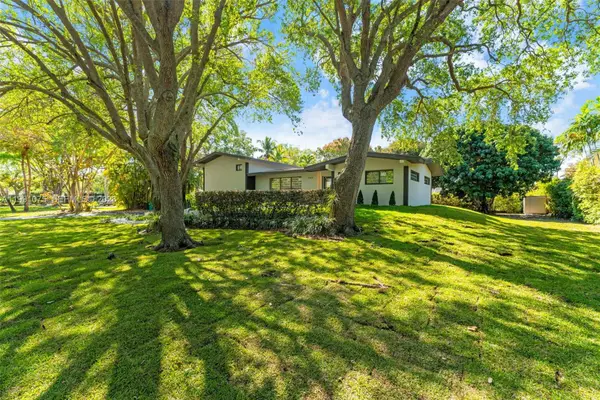
 $376,000Active3 beds 2 baths1,260 sq. ft.
8950 SW 69th Court, Pinecrest, FL 33156
MLS# B26008165Listed by: LONDON FOSTER REALTY - New
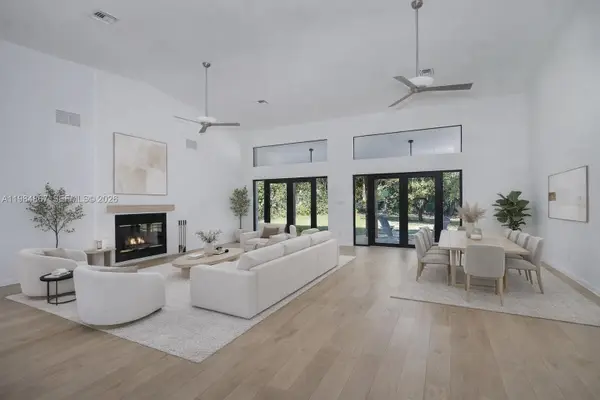 $2,399,000Active4 beds 3 baths3,520 sq. ft.
6841 SW 130th Ter, Pinecrest, FL 33156
MLS# A11984867Listed by: COLDWELL BANKER REALTY - New
 $2,000,000Active6 beds 4 baths3,662 sq. ft.
13351 SW 57th Ct, Pinecrest, FL 33156
MLS# A11988949Listed by: COMPASS FLORIDA, LLC - New
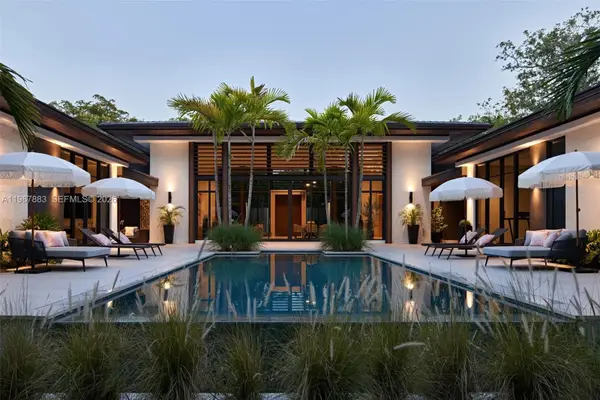 $13,999,999Active7 beds 8 baths6,345 sq. ft.
6371 SW 107th St, Pinecrest, FL 33156
MLS# A11987883Listed by: MODERN WORLD REALTY - New
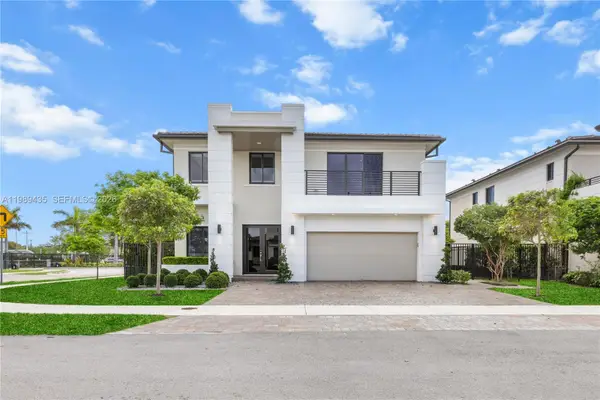 $2,150,000Active5 beds 4 baths3,686 sq. ft.
12021 SW 82nd Pl, Miami, FL 33156
MLS# A11989435Listed by: MI EXCLUSIVE PROPERTIES - New
 $6,495,000Active6 beds 7 baths4,866 sq. ft.
7900 SW 57th Ct, South Miami, FL 33143
MLS# A11989519Listed by: DOUGLAS ELLIMAN - New
 $3,599,000Active5 beds 5 baths4,161 sq. ft.
6125 SW 109th St, Pinecrest, FL 33156
MLS# A11986184Listed by: JARDACK COMMERCIAL REALTY CORP - New
 $1,950,000Active4 beds 4 baths2,709 sq. ft.
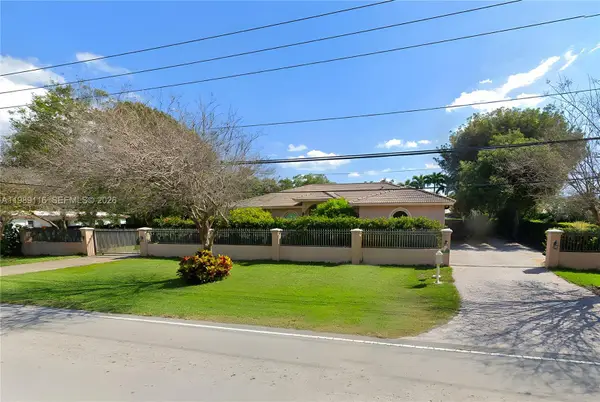
10621 SW 77th Ave, Pinecrest, FL 33156
MLS# A11989116Listed by: BHHS EWM REALTY - New
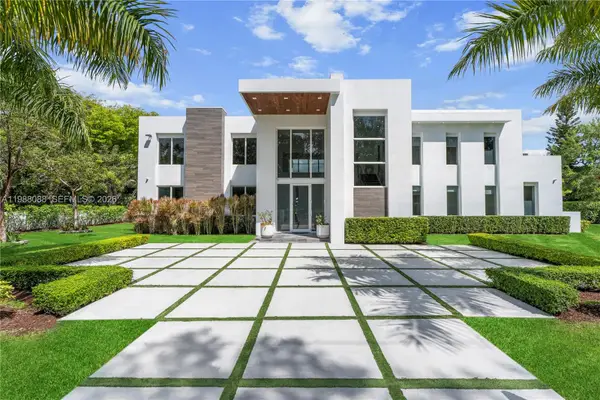 $8,970,000Active6 beds 8 baths7,470 sq. ft.
6285 Old Cutler Rd, Pinecrest, FL 33156
MLS# A11988088Listed by: BHHS EWM REALTY - New
 $4,995,000Active6 beds 7 baths5,972 sq. ft.
6200 SW 130th Ter, Pinecrest, FL 33156
MLS# A11988194Listed by: DOUGLAS ELLIMAN - New
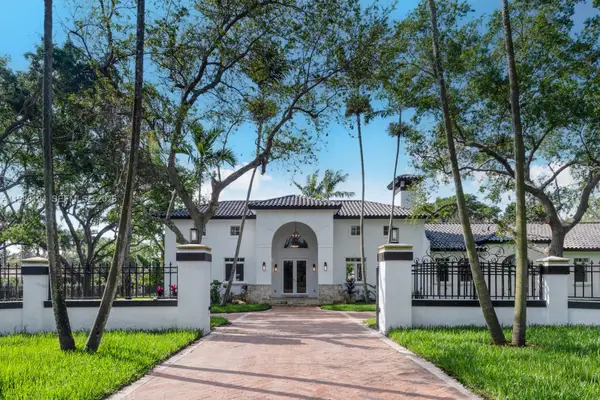
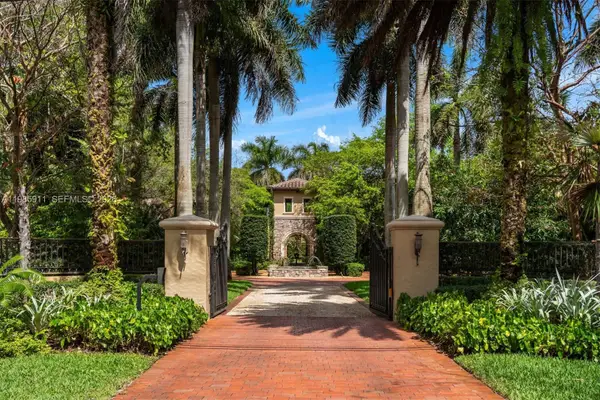 $6,250,000Active6 beds 9 baths6,624 sq. ft.
6201 SW 96th St, Pinecrest, FL 33156
MLS# A11985911Listed by: COLDWELL BANKER REALTY - New
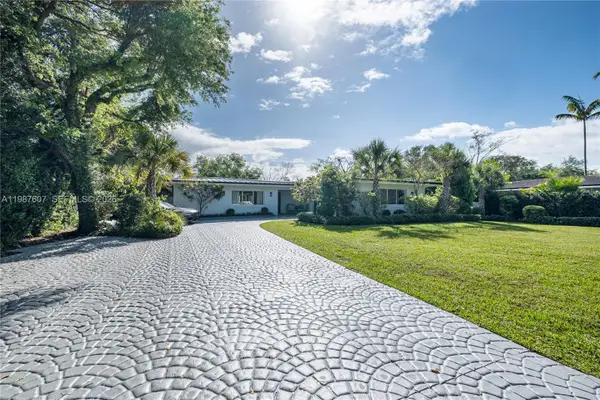 $2,850,000Active5 beds 3 baths3,004 sq. ft.
10235 SW 58th Ct, Pinecrest, FL 33156
MLS# A11987607Listed by: COMPASS FLORIDA, LLC 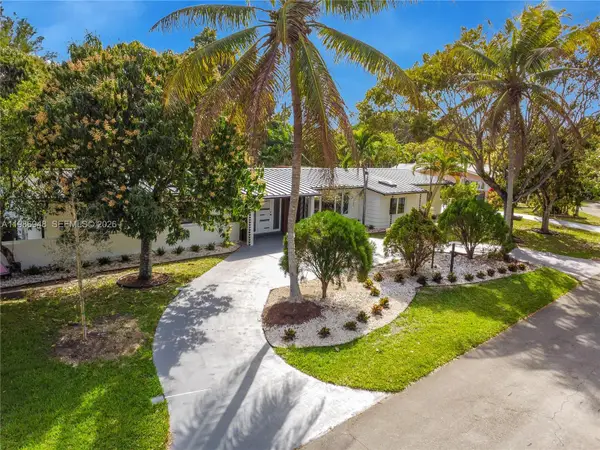 $2,235,000Active5 beds 4 baths2,874 sq. ft.
8220 SW 133rd St, Pinecrest, FL 33156
MLS# A11986948Listed by: LOKATION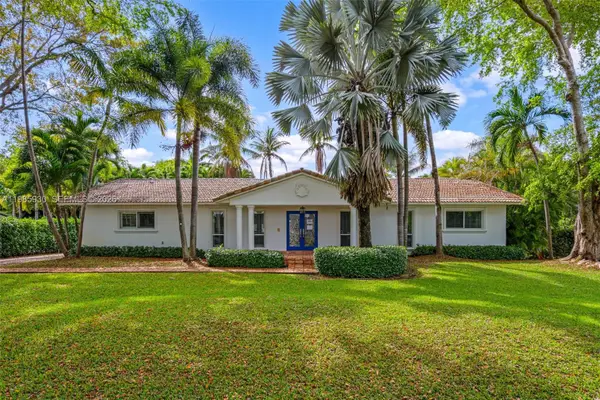 $1,949,900Active3 beds 3 baths2,625 sq. ft.
13276 SW 58th Ct, Pinecrest, FL 33156
MLS# A11985930Listed by: GENSTONE REALTY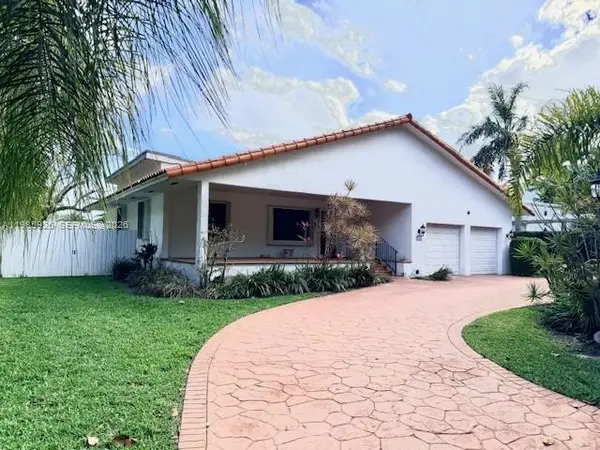 $1,189,000Active2 beds 3 baths1,266 sq. ft.
6420 SW 81st St, Miami, FL 33143
MLS# A11985926Listed by: COLDWELL BANKER REALTY $4,250,000Active7 beds 6 baths6,014 sq. ft.
5981 SW 136th St, Pinecrest, FL 33156
MLS# A11984998Listed by: RE/MAX ADVANCE REALTY II $215,000Active1 beds 1 baths710 sq. ft.
6711 N Kendall Dr #505, Pinecrest, FL 33156
MLS# A11984958Listed by: THE KEYES COMPANY $6,695,000Active6 beds 6 baths9,454 sq. ft.
6700 SW 132nd St, Pinecrest, FL 33156
MLS# A11985069Listed by: BROWN HARRIS STEVENS $282,500Active1 beds 2 baths855 sq. ft.
6886 N Kendall Drive #D303, Pinecrest, FL 33156
MLS# B26000558Listed by: FLORIDA PREMIER REALTY OF THE PALM BEACHES LLC $9,495,000Active5 beds 8 baths7,095 sq. ft.
11720 SW 77th Ave, Pinecrest, FL 33156
MLS# A11983649Listed by: DOUGLAS ELLIMAN $1,499,999Active3 beds 2 baths1,258 sq. ft.
12945 SW 82nd Ave, Pinecrest, FL 33156
MLS# A11984257Listed by: LUXE PROPERTIES $11,495,000Active7 beds 9 baths
6800 SW 106th St, Pinecrest, FL 33156
MLS# A11984142Listed by: COMPASS FLORIDA, LLC $1,848,000Active4 beds 3 baths3,063 sq. ft.
7440 SW 126th St, Pinecrest, FL 33156
MLS# A11983199Listed by: SALSIS REALTY $15,295,000Active6 beds 6 baths6,398 sq. ft.
6255 SW 133rd St, Pinecrest, FL 33156
MLS# A11980697Listed by: DOUGLAS ELLIMAN $213,000Pending1 beds 1 baths710 sq. ft.
6709 N Kendall Dr #209, Pinecrest, FL 33156
MLS# A11981178Listed by: INCOME REALTY CORPORATION $1,650,000Active5 beds 6 baths1,781 sq. ft.
8045 SW 128th St, Pinecrest, FL 33156
MLS# A11981731Listed by: SKY REALTY INVEST. & MNGMT $4,200,000Active4 beds 4 baths3,391 sq. ft.
5700 SW 86th Street, South Miami, FL 33143
MLS# A11980605Listed by: COMPASS FLORIDA, LLC $1,795,000Active3 beds 2 baths2,247 sq. ft.
11890 SW 72nd Pl, Pinecrest, FL 33156
MLS# A11980999Listed by: COMPASS FLORIDA, LLC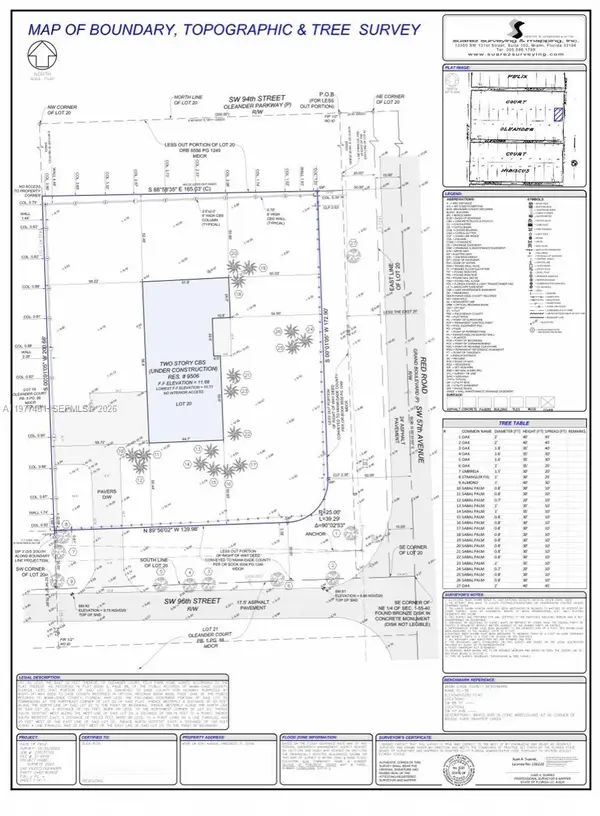 $4,000,000Active0.75 Acres
9506 SW 57th Ave, Pinecrest, FL 33156
MLS# A11977481Listed by: LOPEZ REALTY CO. $7,249,999Active7 beds 8 baths8,417 sq. ft.
11400 SW 67th Ave, Pinecrest, FL 33156
MLS# A11976533Listed by: MIAMI PORTFOLIO COLLECTION $1,975,000Pending4 beds 3 baths3,120 sq. ft.
6400 SW 133rd Dr, Pinecrest, FL 33156
MLS# A11978305Listed by: COMPASS FLORIDA, LLC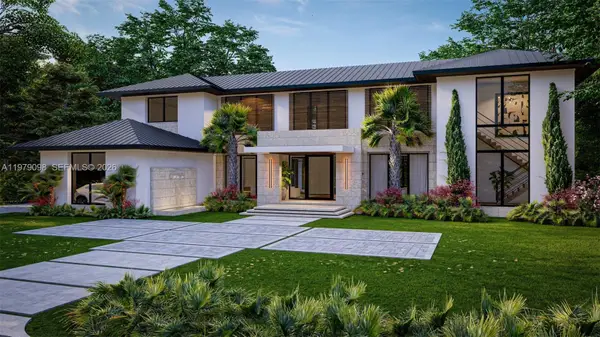 $2,495,000Active3 beds -- baths1,495 sq. ft.
9330 SW 72nd Ave, Pinecrest, FL 33156
MLS# A11979098Listed by: COMPASS FLORIDA, LLC $3,900,000Active5 beds 6 baths4,801 sq. ft.
7280 SW 100th St, Pinecrest, FL 33156
MLS# A11975890Listed by: ONE SOTHEBY'S INTERNATIONAL REALTY $289,900Active2 beds 2 baths1,056 sq. ft.
6902 N Kendall Dr #E403, Pinecrest, FL 33156
MLS# A11977608Listed by: UNITED REALTY GROUP INC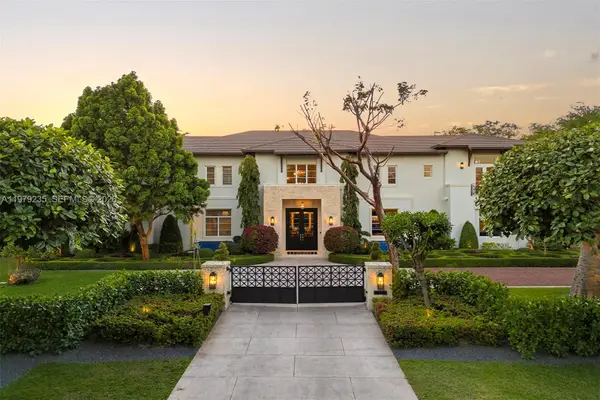 $8,500,000Active6 beds 9 baths7,255 sq. ft.
11750 SW 68th Ct, Pinecrest, FL 33156
MLS# A11979235Listed by: ONE SOTHEBY'S INTERNATIONAL REALTY $255,000Active1 beds 2 baths802 sq. ft.
6884 N Kendall Dr #C401, Pinecrest, FL 33156
MLS# A11979828Listed by: COMPASS FLORIDA, LLC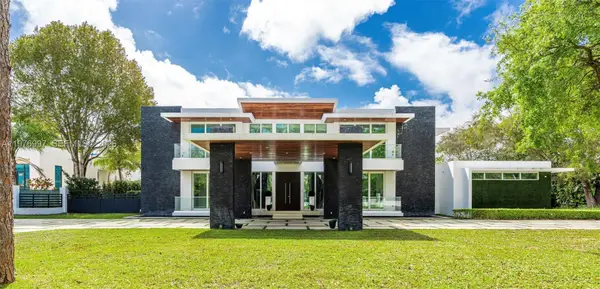 $8,895,000Active8 beds 11 baths8,306 sq. ft.
6300 SW 126th St, Pinecrest, FL 33156
MLS# A11976997Listed by: LA PREMIERE REALTY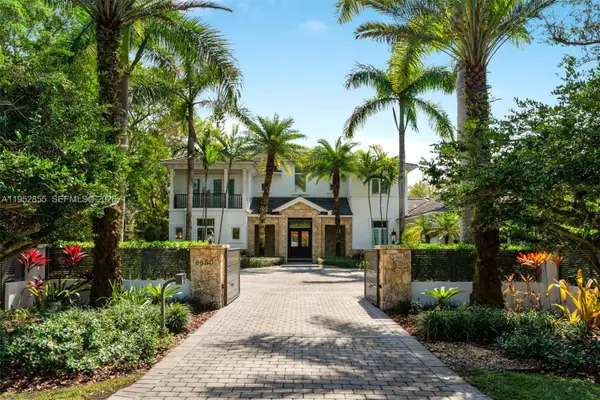 $4,995,000Active6 beds 8 baths6,848 sq. ft.
6650 SW 123rd St, Pinecrest, FL 33156
MLS# A11952855Listed by: ONE SOTHEBY'S INTERNATIONAL REALTY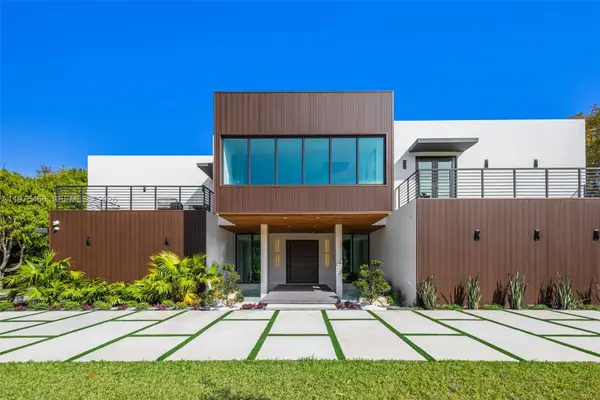 $10,400,000Active8 beds 9 baths8,673 sq. ft.
6445 SW 129th Ter, Pinecrest, FL 33156
MLS# A11975466Listed by: COMPASS FLORIDA, LLC $2,645,000Active6 beds 4 baths4,282 sq. ft.
6065 SW 133rd St, Pinecrest, FL 33156
MLS# A11975369Listed by: PINE BAY REAL ESTATE GROUP LLC $12,500,000Pending6 beds 8 baths
6475 SW 92nd St, Pinecrest, FL 33156
MLS# A11952850Listed by: ONE SOTHEBY'S INTERNATIONAL REALTY $309,000Active2 beds 2 baths1,110 sq. ft.
6884 N Kendall Dr #C407, Pinecrest, FL 33156
MLS# A11973617Listed by: HOMEFIND REALTY CORP $2,649,999Active0.84 Acres
6440 SW 129th Ter, Pinecrest, FL 33156
MLS# A11973021Listed by: COMPASS FLORIDA, LLC $6,000,000Active4 beds -- baths2,784 sq. ft.
12950 SW 67th Ave, Pinecrest, FL 33156
MLS# A11972918Listed by: COMPASS FLORIDA, LLC $6,850,000Active5 beds 8 baths8,754 sq. ft.
6025 SW 108th St, Pinecrest, FL 33156
MLS# A11952851Listed by: ONE SOTHEBY'S INTERNATIONAL REALTY $1,780,000Pending4 beds 4 baths3,135 sq. ft.
7451 SW 133rd St, Pinecrest, FL 33156
MLS# A11969537Listed by: ONE SOTHEBY'S INTERNATIONAL REALTY- Open Wed, 10am to 1pm
 $4,450,000Active4 beds 3 baths3,934 sq. ft.
6371 SW 87th Terrace, Pinecrest, FL 33156
MLS# R11165918Listed by: DODGE REAL ESTATE CORP  $3,295,000Active5 beds 5 baths4,731 sq. ft.
13300 SW 69th Ave, Pinecrest, FL 33156
MLS# A11968510Listed by: MIAMI REAL ESTATE COMPANY $5,390,000Active6 beds 8 baths5,131 sq. ft.
6450 SW 82nd St, Miami, FL 33143
MLS# A11968540Listed by: COLDWELL BANKER REALTY $4,995,000Active7 beds 7 baths6,127 sq. ft.
6235 Rolling Road Dr, Pinecrest, FL 33156
MLS# A11966062Listed by: COMPASS FLORIDA, LLC $3,295,000Active4 beds 4 baths4,182 sq. ft.
11220 SW 67th Ave, Pinecrest, FL 33156
MLS# A11968003Listed by: ONE SOTHEBY'S INTERNATIONAL REALTY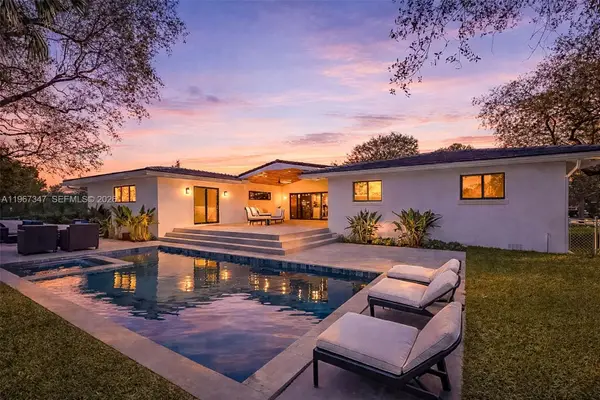 $3,150,000Active5 beds 4 baths3,862 sq. ft.
12940 SW 73rd Ave, Pinecrest, FL 33156
MLS# A11967347Listed by: BHHS EWM REALTY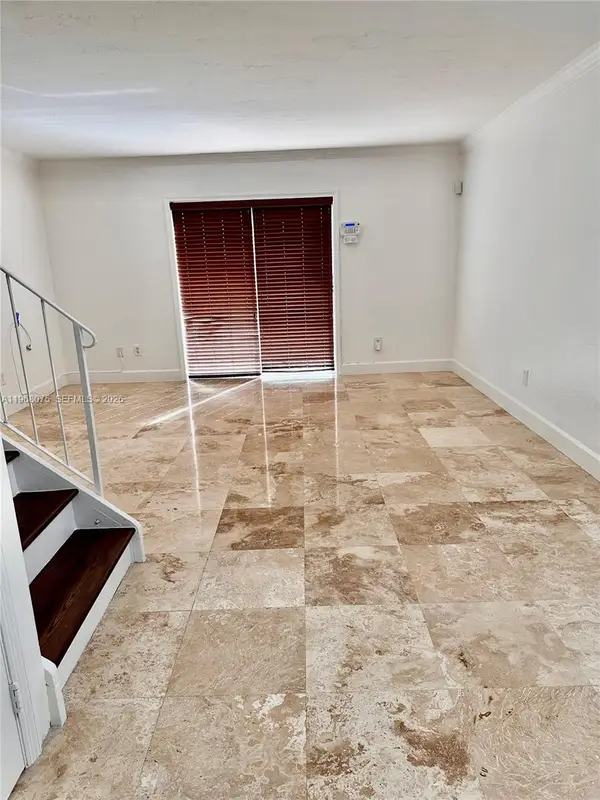 $385,000Active2 beds 3 baths960 sq. ft.
8600 SW 67th Ave #942, Pinecrest, FL 33156
MLS# A11968075Listed by: LUXE PROPERTIES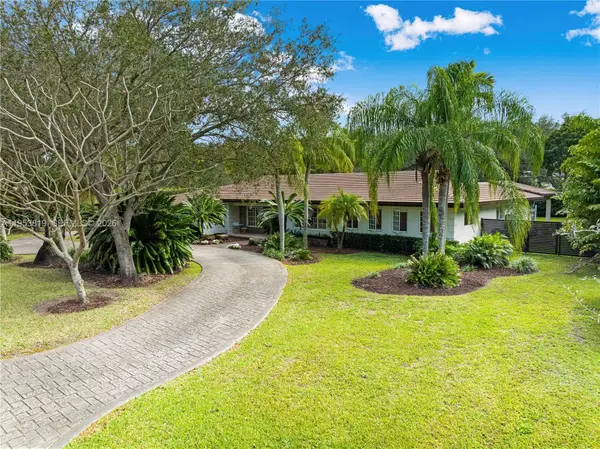 $3,400,000Active5 beds 4 baths3,956 sq. ft.
6700 SW 117th St, Pinecrest, FL 33156
MLS# A11953819Listed by: COMPASS FLORIDA, LLC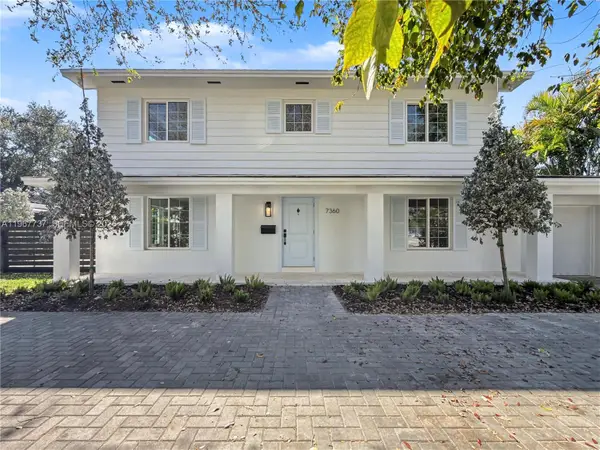 $2,295,000Active4 beds 3 baths2,372 sq. ft.
7360 SW 128th St, Pinecrest, FL 33156
MLS# A11967737Listed by: LUXE PROPERTIES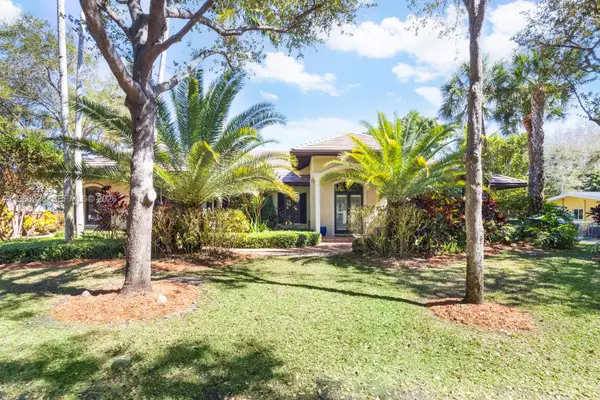 $3,649,000Active5 beds 6 baths4,562 sq. ft.
10601 SW 72nd Ct, Pinecrest, FL 33156
MLS# A11966928Listed by: RE/MAX ADVANCE REALTY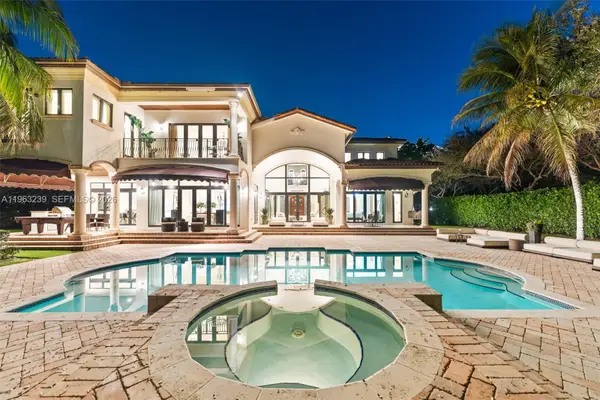 $6,990,000Active6 beds 8 baths8,646 sq. ft.
11111 Killian Park Rd, Pinecrest, FL 33156
MLS# A11963239Listed by: FORTUNE INTERNATIONAL REALTY $2,390,000Pending4 beds 3 baths3,904 sq. ft.
5990 SW 83rd St, South Miami, FL 33143
MLS# A11964559Listed by: NXT LVL REALTY INC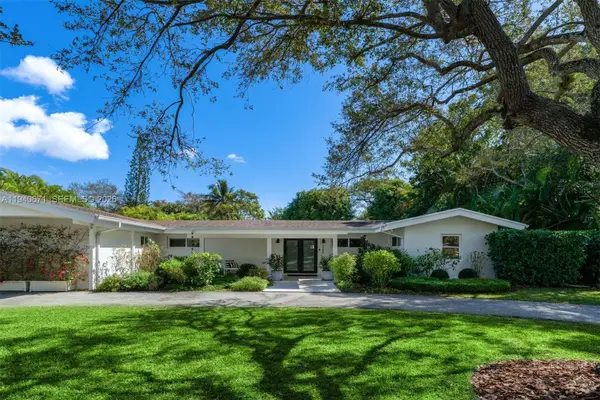 $2,415,000Pending5 beds 3 baths3,251 sq. ft.
12685 SW 81st Ave, Pinecrest, FL 33156
MLS# A11940671Listed by: COMPASS FLORIDA, LLC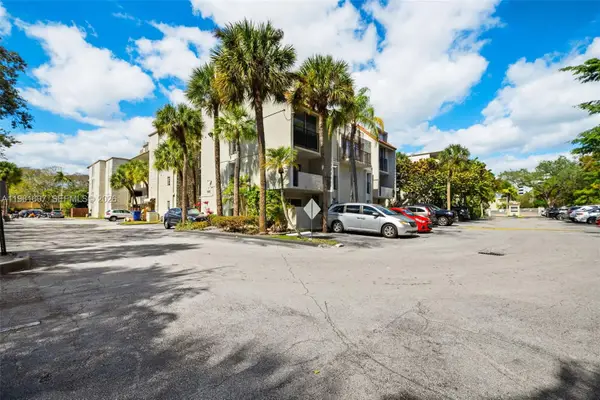 $284,995Active1 beds 1 baths852 sq. ft.
6886 N Kendall Dr #D102, Pinecrest, FL 33156
MLS# A11961697Listed by: COLDWELL BANKER REALTY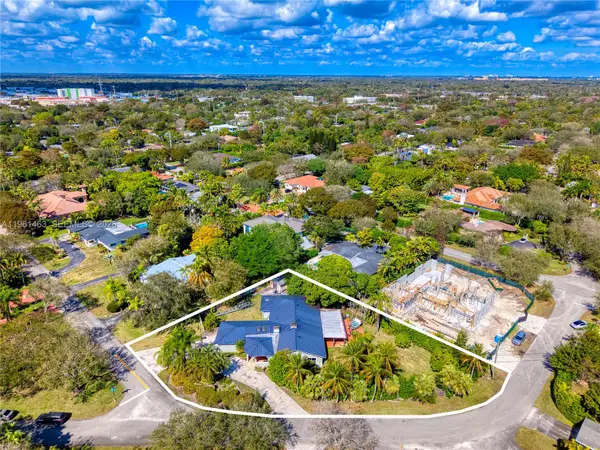 $1,599,000Pending3 beds 3 baths
8001 SW 133rd St, Pinecrest, FL 33156
MLS# A11961463Listed by: COLDWELL BANKER REALTY $19,500,000Active9 beds 11 baths11,575 sq. ft.
13291 Old Cutler Rd, Pinecrest, FL 33156
MLS# A11954781Listed by: ONE SOTHEBY'S INTERNATIONAL REALTY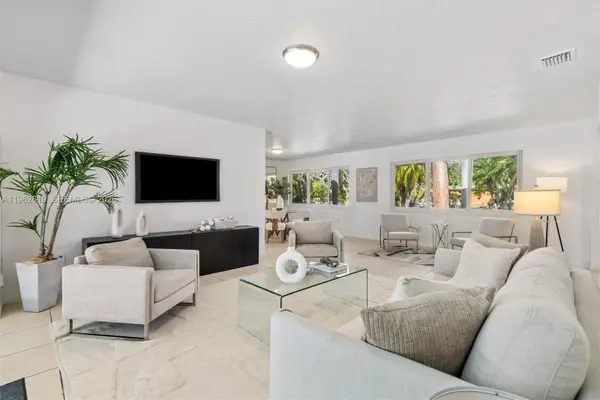 $1,299,000Pending3 beds 2 baths1,849 sq. ft.
8260 SW 133rd St, Pinecrest, FL 33156
MLS# A11962619Listed by: BHHS EWM REALTY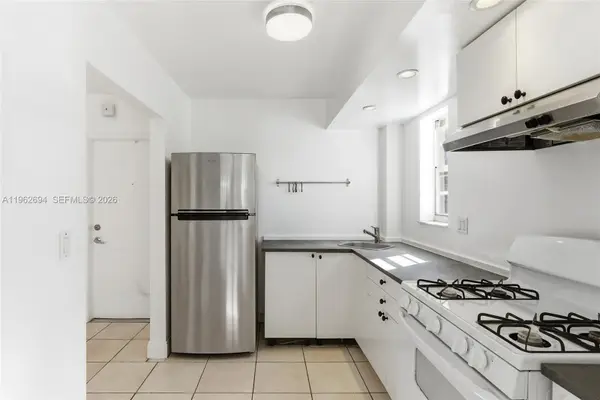 $215,000Active1 beds 1 baths700 sq. ft.
6705 N Kendall Dr #306, Pinecrest, FL 33156
MLS# A11962694Listed by: ONE SOTHEBY'S INTERNATIONAL REALTY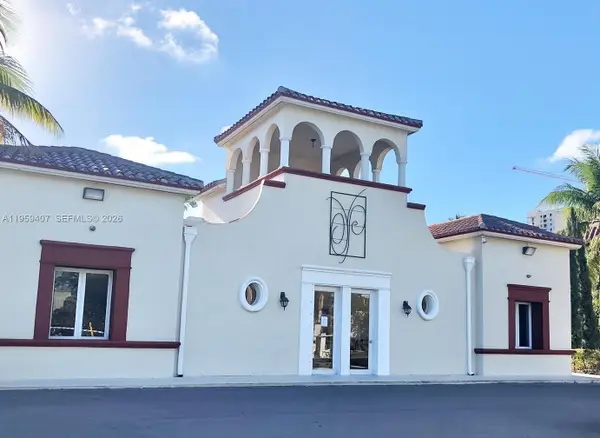 $370,000Active2 beds 3 baths960 sq. ft.
8650 SW 67th Ave #1032, Pinecrest, FL 33156
MLS# A11959407Listed by: IMPERIAL HOME REALTY, LLC.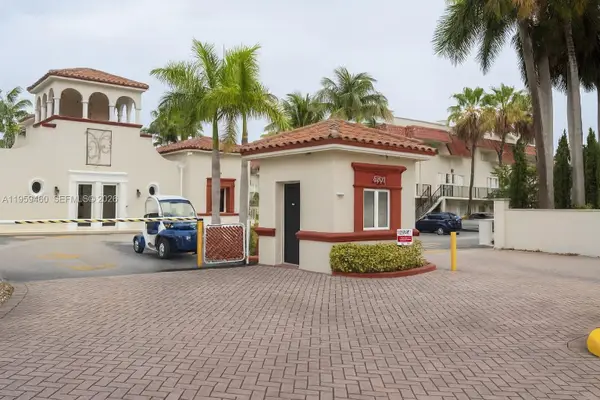 $420,000Active3 beds 3 baths1,080 sq. ft.
6707 N Kendall Dr #115, Pinecrest, FL 33156
MLS# A11959460Listed by: IMPERIAL HOME REALTY, LLC.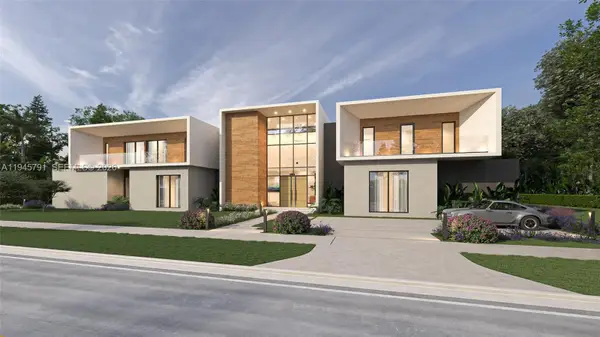 $3,500,000Active7 beds 9 baths2,915 sq. ft.
5811 SW 88th St, Pinecrest, FL 33156
MLS# A11945791Listed by: ONE SOTHEBY'S INTERNATIONAL REALTY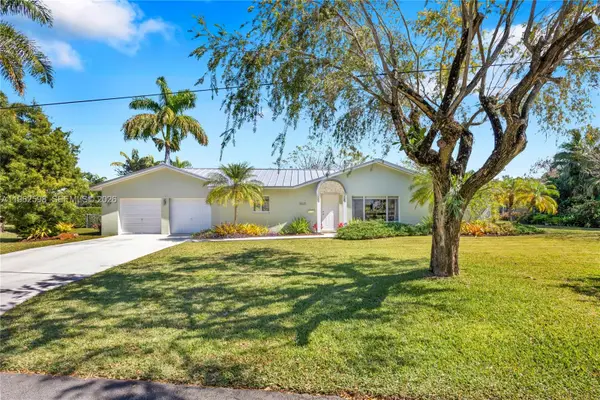 $2,300,000Active2 beds 2 baths1,942 sq. ft.
11625 SW 70th Ave, Pinecrest, FL 33156
MLS# A11962598Listed by: BHHS EWM REALTY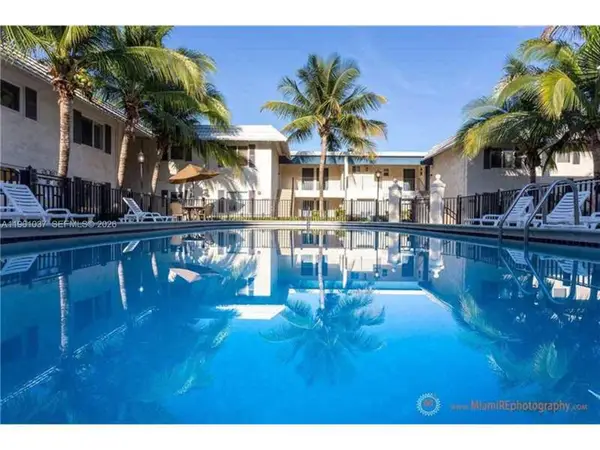 $285,000Active1 beds 1 baths574 sq. ft.
8609 SW 68th Ct #2, Pinecrest, FL 33143
MLS# A11961037Listed by: PREMIER ELITE REALTY INC.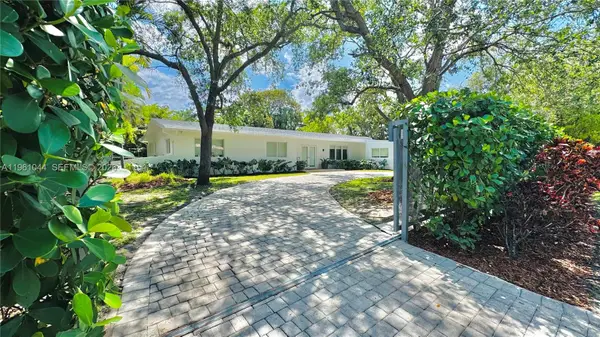 $1,849,000Active4 beds 3 baths3,063 sq. ft.
7440 SW 126th St, Pinecrest, FL 33156
MLS# A11961044Listed by: SALSIS REALTY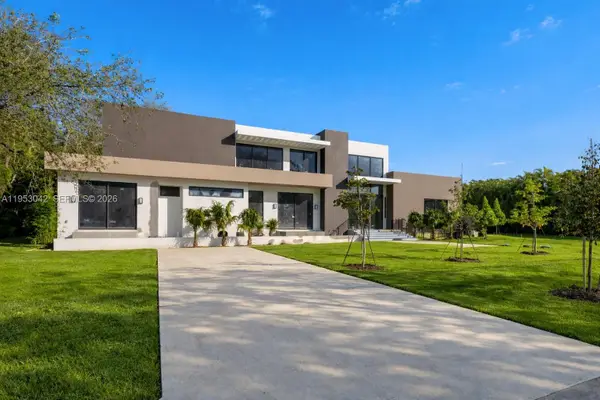 $11,950,000Active6 beds 8 baths
5825 SW 111th Ter, Pinecrest, FL 33156
MLS# A11953042Listed by: ONE SOTHEBY'S INTERNATIONAL REALTY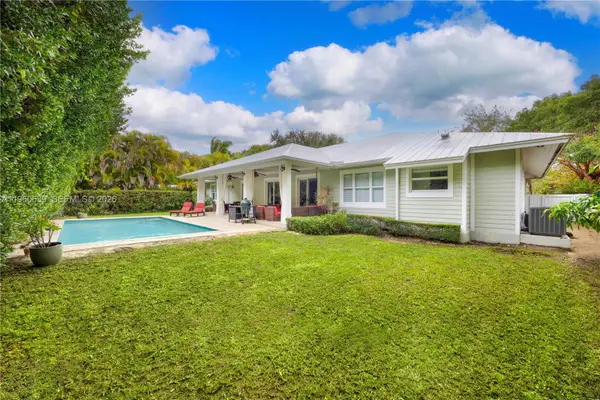 $3,000,000Active4 beds 4 baths3,248 sq. ft.
8020 SW 62nd Ave, Miami, FL 33143
MLS# A11960639Listed by: COLDWELL BANKER REALTY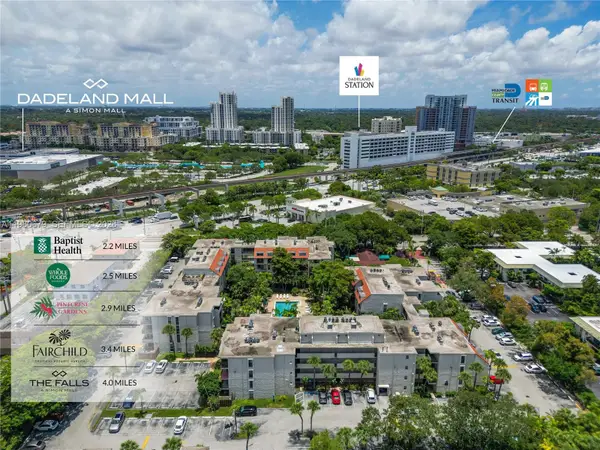 $275,000Active1 beds 2 baths855 sq. ft.
6900 N Kendall Dr #A303, Pinecrest, FL 33156
MLS# A11960679Listed by: MOVE MIAMI, LLC.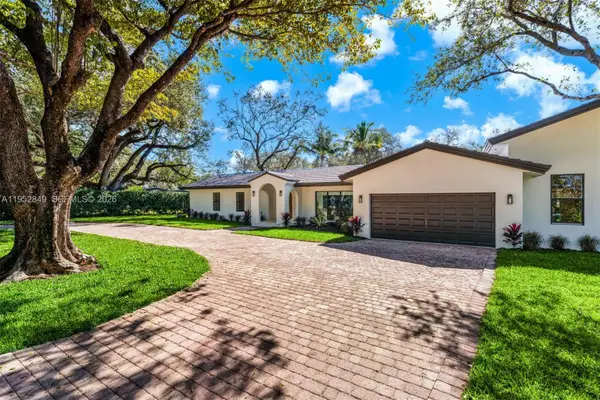 $3,500,000Active4 beds 4 baths3,083 sq. ft.
6650 SW 127th St, Pinecrest, FL 33156
MLS# A11952849Listed by: ONE SOTHEBY'S INTERNATIONAL REALTY $16,995,000Active7 beds 10 baths9,644 sq. ft.
5901 SW 107th St, Pinecrest, FL 33156
MLS# A11952853Listed by: ONE SOTHEBY'S INTERNATIONAL REALTY $10,600,000Active6 beds 7 baths7,050 sq. ft.
5902 SW 105th St, Pinecrest, FL 33156
MLS# A11957438Listed by: COLDWELL BANKER REALTY $2,649,999Active5 beds 3 baths2,051 sq. ft.
6440 SW 129th Ter, Pinecrest, FL 33156
MLS# A11958940Listed by: COMPASS FLORIDA, LLC $2,499,000Active5 beds 4 baths3,585 sq. ft.
7821 SW 129th Ter, Pinecrest, FL 33156
MLS# A11958164Listed by: RE/MAX ADVANCE REALTY $2,349,000Active4 beds 3 baths2,320 sq. ft.
11401 SW 72nd Pl, Pinecrest, FL 33156
MLS# A11949994Listed by: OPEN REALTY LLC $3,950,000Active6 beds 5 baths4,695 sq. ft.
5770 SW 128th St, Pinecrest, FL 33156
MLS# A11957161Listed by: SAMANTHA LUCAS REAL EST. BRK.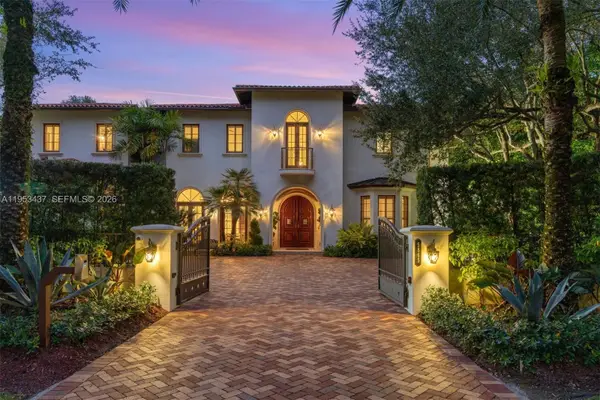 $8,200,000Active7 beds 8 baths7,811 sq. ft.
5865 SW 96th St, Pinecrest, FL 33156
MLS# A11953437Listed by: COLDWELL BANKER REALTY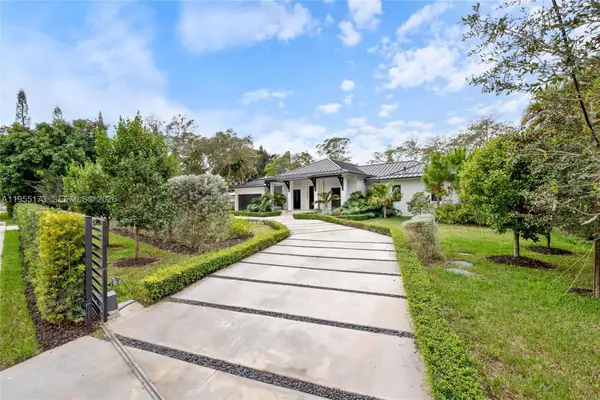 $5,500,000Active5 beds 7 baths4,673 sq. ft.
11600 SW 77th Ave, Pinecrest, FL 33156
MLS# A11955173Listed by: BROWN HARRIS STEVENS $2,380,000Pending5 beds 3 baths3,099 sq. ft.
13502 SW 57th Ct, Pinecrest, FL 33156
MLS# A11923013Listed by: COMPASS FLORIDA, LLC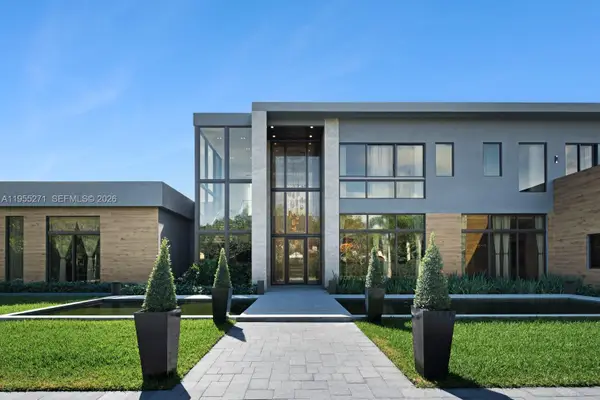 $16,990,000Active6 beds 9 baths9,935 sq. ft.
5900 SW 129th Ter, Pinecrest, FL 33156
MLS# A11955271Listed by: DOUGLAS ELLIMAN $1,375,000Pending3 beds 2 baths1,642 sq. ft.
8230 SW 63rd Pl, Miami, FL 33143
MLS# A11955003Listed by: BHHS EWM REALTY $949,900Active4 beds 3 baths1,864 sq. ft.
7588 SW 102nd St #203, Pinecrest, FL 33156
MLS# A11955340Listed by: AMERIFIRST REALTY $9,390,000Active5 beds 5 baths7,697 sq. ft.
11050 SW 69th Ave, Pinecrest, FL 33156
MLS# A11954100Listed by: COMPASS FLORIDA, LLC $3,650,000Active0.74 Acres
9790 SW 67th Ave, Pinecrest, FL 33156
MLS# A11952856Listed by: ONE SOTHEBY'S INTERNATIONAL REALTY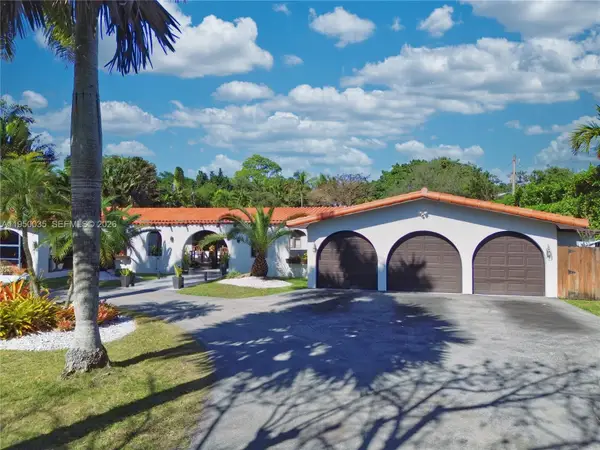 $3,549,000Active8 beds 6 baths4,784 sq. ft.
7925 SW 124th St, Pinecrest, FL 33156
MLS# A11950035Listed by: NITTY J DIAZ PA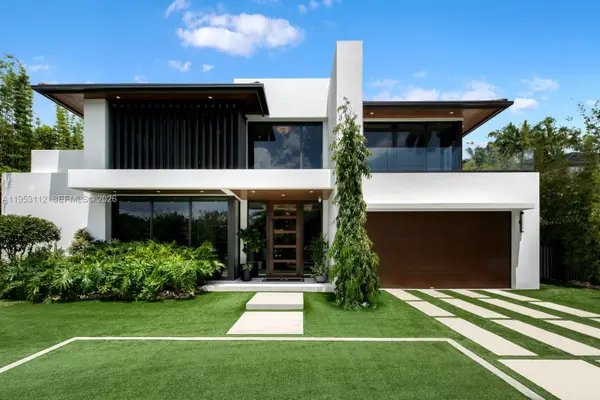 $7,659,000Active6 beds 7 baths6,767 sq. ft.
6031 SW 88th St, South Miami, FL 33156
MLS# A11953112Listed by: DOUGLAS ELLIMAN $3,999,000Active23.96 Acres
0 Us 1, Miami, FL 33034
MLS# A11953126Listed by: RE/MAX ADVANCE REALTY II $3,500,000Active0.74 Acres
6366 Snapper Creek Dr, Miami, FL 33143
MLS# A11946909Listed by: COLDWELL BANKER REALTY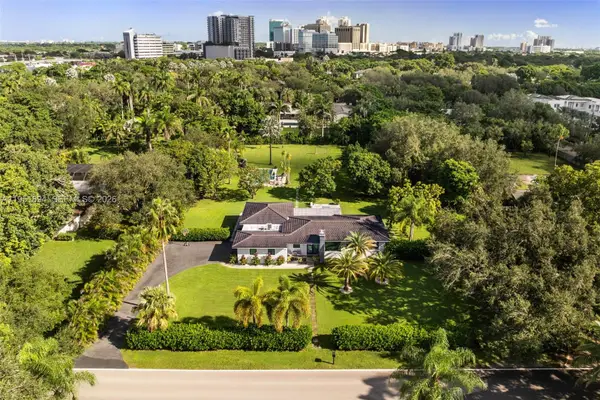 $3,900,000Active1.05 Acres
07325 SW 102nd St, Pinecrest, FL 33156
MLS# A11951894Listed by: COMPASS FLORIDA, LLC.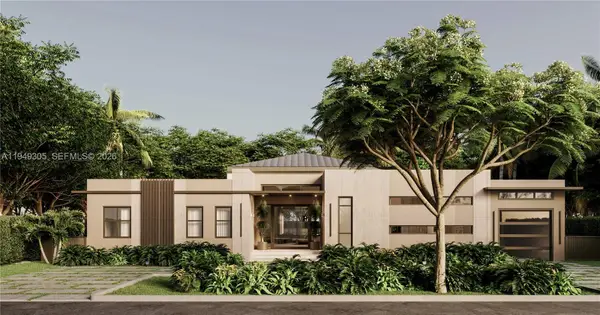 $4,995,000Active5 beds 6 baths4,562 sq. ft.
9400 SW 73rd Ave, Pinecrest, FL 33156
MLS# A11949305Listed by: FORTEX REALTY INC $3,250,000Active5 beds 5 baths4,732 sq. ft.
6801 SW 126th Ter, Pinecrest, FL 33156
MLS# A11950981Listed by: DOUGLAS ELLIMAN $10,699,000Active8 beds 11 baths9,800 sq. ft.
6190 SW 128th St, Pinecrest, FL 33156
MLS# A11951371Listed by: STEFANO REALTY, LLC.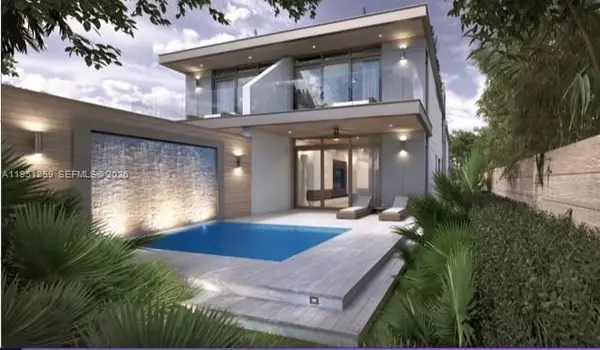 $3,600,000Active4 beds 5 baths
6021 76th St, South Miami, FL 33143
MLS# A11951259Listed by: B & B REAL ESTATE BROKER INC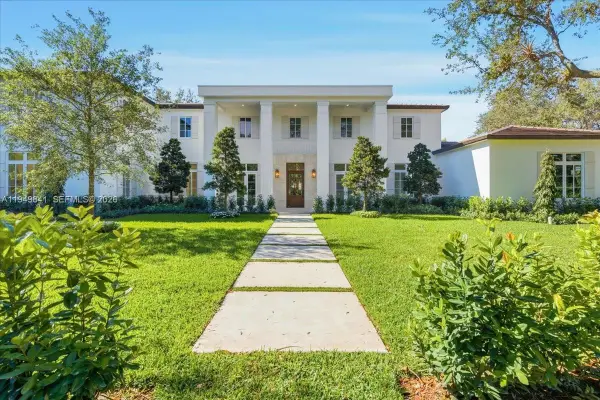 $6,950,000Active7 beds 8 baths
5940 SW 100th Ter, Pinecrest, FL 33156
MLS# A11949841Listed by: PINE BAY REAL ESTATE GROUP LLC $6,900,000Active7 beds 8 baths8,825 sq. ft.
8923 SW 67 Ave, Pinecrest, FL 33156
MLS# A11896255Listed by: BHHS EWM REALTY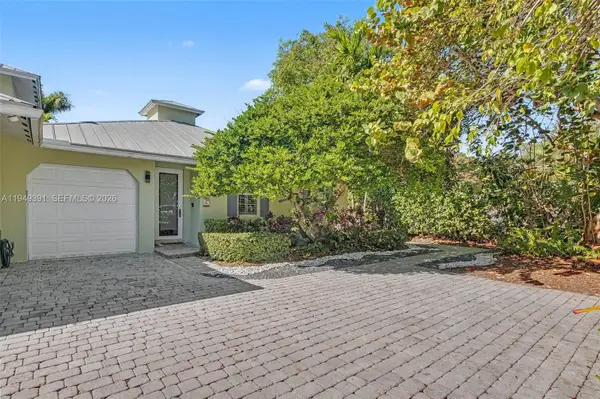 $1,495,000Active3 beds 2 baths1,654 sq. ft.
10530 SW 77th Ave #1, Pinecrest, FL 33156
MLS# A11949391Listed by: BHHS EWM REALTY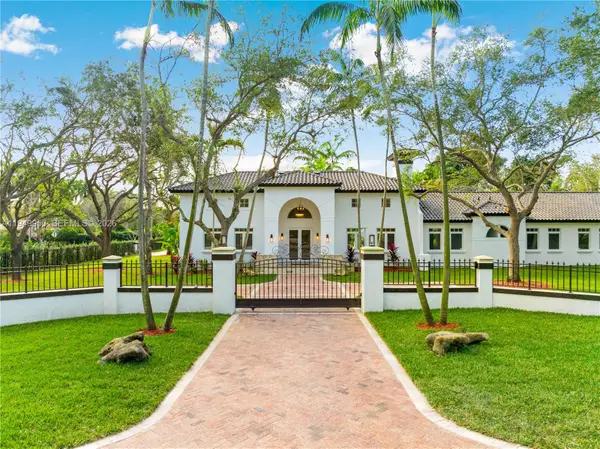 $5,195,000Active6 beds 7 baths5,972 sq. ft.
6200 SW 130th Ter, Pinecrest, FL 33156
MLS# A11949950Listed by: HARBOR REALTY INV. CORP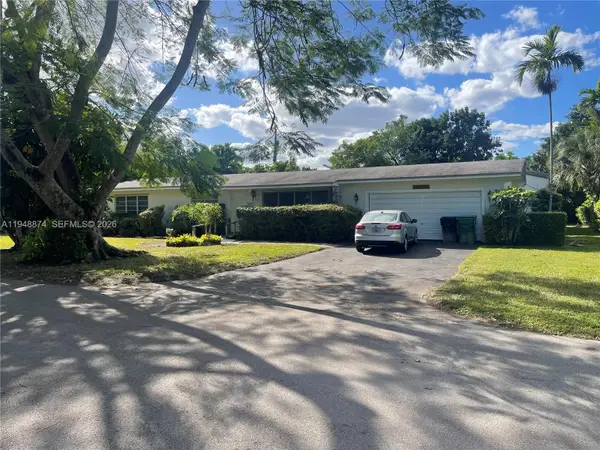 $1,799,000Pending4 beds 3 baths2,738 sq. ft.
10700 SW 72nd Ct, Pinecrest, FL 33156
MLS# A11948874Listed by: DOUGLAS ELLIMAN $1,329,000Pending4 beds 2 baths1,686 sq. ft.
8115 SW 63rd Pl, Miami, FL 33143
MLS# A11948884Listed by: BHHS EWM REALTY $8,900,000Active7 beds 8 baths7,207 sq. ft.
5845 SW 130th Ter, Pinecrest, FL 33156
MLS# A11948459Listed by: COMPASS FLORIDA, LLC $6,795,000Active6 beds 7 baths6,530 sq. ft.
6175 SW 128th Street, Pinecrest, FL 33156
MLS# A11948169Listed by: LUXE PROPERTIES $9,499,000Active7 beds 9 baths6,846 sq. ft.
7725 SW 114th St, Pinecrest, FL 33156
MLS# A11946151Listed by: A & G TEAM REALTY, LLC $1,900,000Active6 beds 5 baths3,450 sq. ft.
5845 SW 88th St, South Miami, FL 33156
MLS# A11946407Listed by: THE KEYES COMPANY $2,190,000Active5 beds 4 baths3,346 sq. ft.
12525 SW 68th Ct, Pinecrest, FL 33156
MLS# A11943688Listed by: RESILIENCE INTERNATIONAL REALTY LLC $307,500Active2 beds 2 baths890 sq. ft.
6703 N Kendall Dr #409, Pinecrest, FL 33156
MLS# A11942488Listed by: MEI YANG $1,999,000Active0.42 Acres
7400 SW 98th St, Pinecrest, FL 33156
MLS# A11942343Listed by: DOUGLAS ELLIMAN $269,700Active1 beds 1 baths852 sq. ft.
6900 N Kendall Dr #A102, Pinecrest, FL 33156
MLS# A11941296Listed by: PRESTIGE PROPERTIES INTERNATIO $10,500,000Active8 beds 10 baths10,323 sq. ft.
5901 Rolling Road Dr, Pinecrest, FL 33156
MLS# A11941913Listed by: VANTAGE REAL ESTATE LLC $2,800,000Active1.31 Acres
13500 SW 68th Ct, Pinecrest, FL 33156
MLS# A11939656Listed by: AVANTI WAY REALTY LLC $1,190,000Active3 beds 3 baths1,902 sq. ft.
5864 SW 74th Ter #G, South Miami, FL 33143
MLS# A11940958Listed by: SERHANT $1,625,000Active3 beds 3 baths1,168 sq. ft.
13225 SW 83rd Ct, Pinecrest, FL 33156
MLS# A11939301Listed by: REALTY ONE GROUP EVOLUTION $7,800,000Active7 beds 8 baths6,541 sq. ft.
7218 SW 102nd St, Pinecrest, FL 33156
MLS# A11939382Listed by: THE CORCORAN GROUP $4,499,000Active5 beds 6 baths5,783 sq. ft.
11001 SW 75th Court, Pinecrest, FL 33156
MLS# F10525238Listed by: ISLA BELLA REALTY OF FL LLC $3,599,500Active9 beds 10 baths
6300 SW 104th St, Pinecrest, FL 33156
MLS# A11938786Listed by: KELLER WILLIAMS CAPITAL REALTY $1,395,000Active0.33 Acres
12840 SW 83rd Court, Pinecrest, FL 33156
MLS# F10493672Listed by: ALLSTAR REALTY INC $3,599,995Active0.89 Acres
6300 SW 104th St, Pinecrest, FL 33156
MLS# A11938225Listed by: FLORIDA CONTINENTAL REALTY, LLC. $15,800,000Active6 beds 9 baths
9205 SW 59th Ave, Pinecrest, FL 33156
MLS# A11934666Listed by: MORGANARO INTERNATIONAL GROUP $6,150,000Active5 beds 6 baths4,375 sq. ft.
5890 SW 82nd St, South Miami, FL 33143
MLS# A11917573Listed by: COLDWELL BANKER REALTY $3,250,000Active4 beds 6 baths3,393 sq. ft.
7345 SW 96th St, Pinecrest, FL 33156
MLS# A11950043Listed by: INMOBILIATA, LLC $359,900Active2 beds 1 baths805 sq. ft.
8609 SW 68th Ct #24, Pinecrest, FL 33156
MLS# A11931684Listed by: EQUINOX REAL ESTATE GROUP INC $6,990,000Active4 beds 4 baths
11001 SW 74th Ave, Pinecrest, FL 33156
MLS# A11932461Listed by: FLORIDA 365 REALTY, LLC. $3,999,999Active6 beds 6 baths4,841 sq. ft.
11825 S Mitchell Manor Cir, Pinecrest, FL 33156
MLS# A11932062Listed by: BHHS EWM REALTY $3,249,000Active4 beds 3 baths3,678 sq. ft.
6601 SW 124th St, Pinecrest, FL 33156
MLS# A11930665Listed by: BHHS EWM REALTY $6,900,000Active5 beds 7 baths8,912 sq. ft.
7220 SW 125th St, Pinecrest, FL 33156
MLS# A11928455Listed by: PRESTIGE REALTY GROUP, LLC $5,390,000Active5 beds 5 baths4,838 sq. ft.
6890 SW 94th St, Pinecrest, FL 33156
MLS# A11927028Listed by: COMPASS FLORIDA, LLC $3,950,000Pending5 beds 5 baths4,598 sq. ft.
6755 SW 99th Ter, Pinecrest, FL 33156
MLS# A11926783Listed by: COMPASS FLORIDA, LLC $6,990,000Active6 beds 8 baths6,841 sq. ft.
9840 SW 73rd Ct, Pinecrest, FL 33156
MLS# A11925400Listed by: COLDWELL BANKER REALTY $3,200,000Active5 beds 4 baths4,119 sq. ft.
7830 SW 120th St, Pinecrest, FL 33156
MLS# A11925030Listed by: DOUGLAS ELLIMAN $9,495,000Active7 beds 9 baths8,551 sq. ft.
6080 SW 104th St, Pinecrest, FL 33156
MLS# A11924653Listed by: DOUGLAS ELLIMAN $16,400,000Pending7 beds 7 baths10,393 sq. ft.
9500 SW 61st Ct, Pinecrest, FL 33156
MLS# A11916940Listed by: BROWN HARRIS STEVENS $6,445,000Active7 beds 8 baths7,384 sq. ft.
8800 SW 57 Ave, Pinecrest, FL 33156
MLS# A11922742Listed by: BHHS EWM REALTY $429,000Active3 beds 3 baths1,290 sq. ft.
8650 SW 67th Ave #1042, Pinecrest, FL 33156
MLS# A11922705Listed by: BHHS EWM REALTY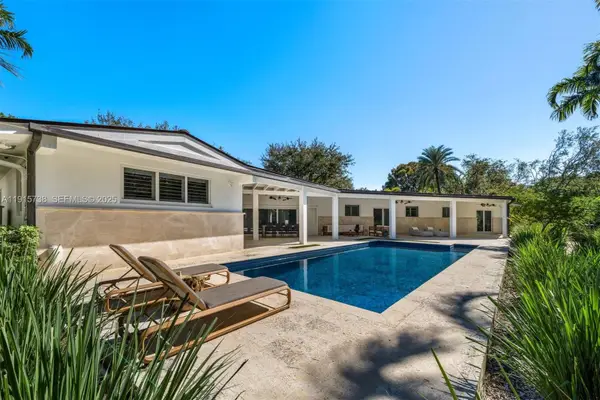 $3,750,000Active4 beds 4 baths3,191 sq. ft.
12050 Moss Ranch Rd, Pinecrest, FL 33156
MLS# A11915738Listed by: COLDWELL BANKER REALTY- Open Sat, 12 to 4pm
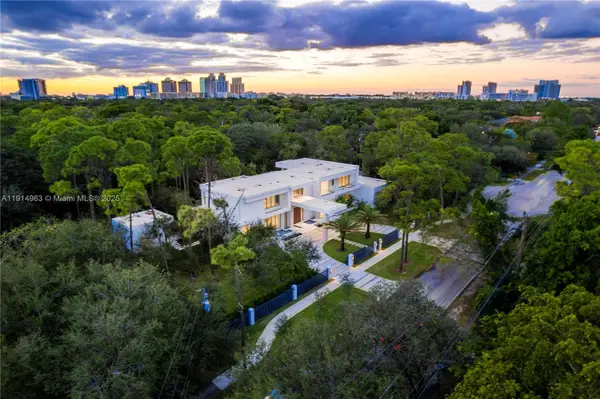 $10,495,000Active7 beds 8 baths
6720 SW 98th St, Pinecrest, FL 33156
MLS# A11914963Listed by: COMPASS FLORIDA, LLC  $2,195,000Active3 beds 1 baths1,801 sq. ft.
7955 SW 131st St, Pinecrest, FL 33156
MLS# A11915042Listed by: DCINKC LLC $13,500,000Active7 beds 10 baths10,326 sq. ft.
6460 SW 94th St, Pinecrest, FL 33156
MLS# A11884219Listed by: FORTUNE INTERNATIONAL REALTY $11,800,000Active6 beds 8 baths6,851 sq. ft.
8900 SW 62nd Ct, Pinecrest, FL 33156
MLS# A11908320Listed by: COLDWELL BANKER REALTY $9,900,000Active7 beds 5 baths10,689 sq. ft.
10395 SW 67th Ave, Pinecrest, FL 33156
MLS# A11913634Listed by: LIFESTYLE INTERNATIONAL REALTY $4,995,000Pending5 beds 6 baths6,447 sq. ft.
5770 SW 100th St, Pinecrest, FL 33156
MLS# A11902700Listed by: ONE SOTHEBY'S INTERNATIONAL REALTY $3,875,000Active5 beds 4 baths4,166 sq. ft.
6500 SW 127th St, Pinecrest, FL 33156
MLS# A11909060Listed by: METHOD FLORIDA, LLC $13,850,000Active7 beds 11 baths11,300 sq. ft.
8961 SW 62nd Ct, Pinecrest, FL 33156
MLS# A11909033Listed by: DOUGLAS ELLIMAN $6,290,000Active6 beds 9 baths5,759 sq. ft.
7830 SW 117th St, Pinecrest, FL 33156
MLS# A11905883Listed by: TENZER REALTY AND ASSOCIATES $3,652,500Pending4 beds 3 baths4,480 sq. ft.
6525 SW 133rd Dr, Pinecrest, FL 33156
MLS# A11906401Listed by: AVANTI WAY BRICKELL $14,950,000Active8 beds 9 baths
5850 SW 93rd St, Pinecrest, FL 33156
MLS# A11902375Listed by: MJ ESTATES, INC. $1,900,000Active5 beds 6 baths1,781 sq. ft.
8045 SW 128th St, Pinecrest, FL 33156
MLS# A11906167Listed by: SKY REALTY INVEST. & MNGMT $3,980,000Active7 beds 5 baths5,452 sq. ft.
13551 SW 62nd Ave, Pinecrest, FL 33156
MLS# A11897447Listed by: SERHANT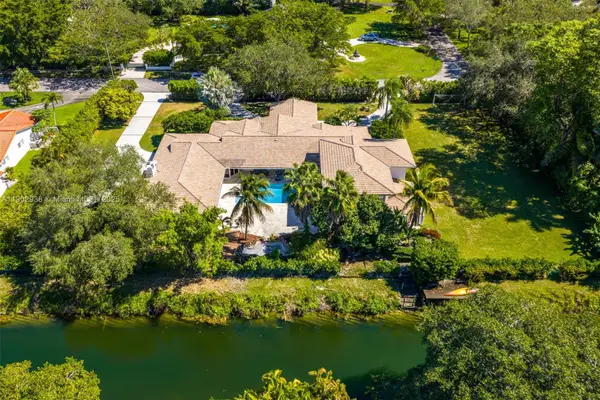 $3,395,000Active6 beds 6 baths5,343 sq. ft.
13150 SW 69th Ave, Pinecrest, FL 33156
MLS# A11902938Listed by: LUXURI INTERNATIONAL REAL ESTATE MIAMI, LLC. $345,000Active2 beds 2 baths792 sq. ft.
8281 SW 128th St #107, Pinecrest, FL 33156
MLS# A11904810Listed by: CERVERA REAL ESTATE INC. $255,000Pending1 beds 1 baths672 sq. ft.
8261 SW 128th St #211, Pinecrest, FL 33156
MLS# A11904586Listed by: BLUE STAR REALTY SERVICES $399,000Active3 beds 3 baths1,150 sq. ft.
8650 SW 67th Ave #1025, Pinecrest, FL 33156
MLS# A11832016Listed by: GOSHEN REAL ESTATE LLC $1,999,999Active4 beds 3 baths3,516 sq. ft.
11003 SW 77th Ct Cir, Pinecrest, FL 33156
MLS# A11902292Listed by: RE/MAX ADVANCE REALTY $3,249,000Active3 beds 3 baths3,223 sq. ft.
6201 SW 114th St, Pinecrest, FL 33156
MLS# A11885526Listed by: LONDON FOSTER REALTY $3,400,000Active0.83 Acres
11353 SW 69th Ct, Pinecrest, FL 33156
MLS# A11899822Listed by: SHELTON AND STEWART REALTORS $375,000Active2 beds 1 baths805 sq. ft.
8609 SW 68th Ct #5, Pinecrest, FL 33156
MLS# A11900159Listed by: LOKATION $349,000Active1 beds 2 baths740 sq. ft.
8600 SW 67th Ave #906, Pinecrest, FL 33156
MLS# A11897023Listed by: B & B REAL ESTATE BROKER INC $6,150,000Active6 beds 9 baths7,271 sq. ft.
7837 SW 117th St, Pinecrest, FL 33156
MLS# A11893123Listed by: THE KEYES COMPANY- Open Sat, 1 to 3am
 $7,968,000Active8 beds 9 baths6,819 sq. ft.
7900 SW 118th St, Pinecrest, FL 33156
MLS# A11894767Listed by: TENZER REALTY AND ASSOCIATES  $3,875,000Active5 beds 4 baths3,487 sq. ft.
5800 SW 99th Ter, Pinecrest, FL 33156
MLS# A11892095Listed by: BHHS EWM REALTY $5,650,000Active6 beds 6 baths6,027 sq. ft.
9101 SW 69th Ct, Pinecrest, FL 33156
MLS# A11888565Listed by: LUXE PROPERTIES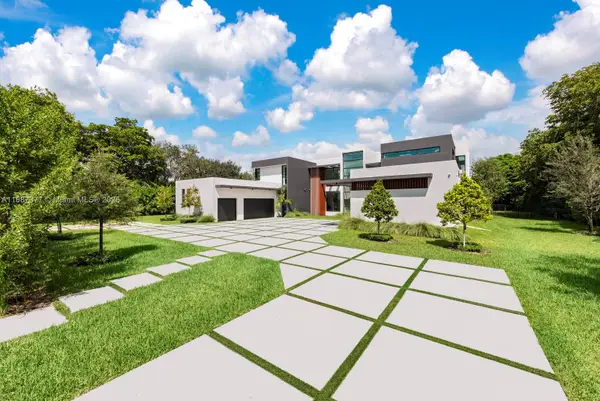 $7,950,000Active8 beds 9 baths8,455 sq. ft.
7425 SW 136th St, Pinecrest, FL 33156
MLS# A11887377Listed by: RE/MAX ADVANCE REALTY $2,595,000Pending4 beds 3 baths2,694 sq. ft.
7485 SW 122nd St, Pinecrest, FL 33156
MLS# A11887426Listed by: COMPASS FLORIDA, LLC $375,000Active2 beds 1 baths805 sq. ft.
8617 SW 68th Ct #24, Pinecrest, FL 33156
MLS# A11885764Listed by: COMPASS FLORIDA, LLC $9,900,000Active7 beds 8 baths7,954 sq. ft.
13120 Old Cutler Rd, Pinecrest, FL 33156
MLS# A11883774Listed by: ONE SOTHEBY'S INTERNATIONAL REALTY $4,995,000Active5 beds 6 baths3,759 sq. ft.
5950 SW 83rd St, South Miami, FL 33143
MLS# A11862946Listed by: COLDWELL BANKER REALTY $215,000Active1 beds 1 baths
7901 SW 64th Ave #6, South Miami, FL 33143
MLS# A11884377Listed by: FLORIDA REALTY OF MIAMI CORP $8,495,000Pending1.32 Acres
10600 Lakeside Dr, Coral Gables, FL 33156
MLS# A11883060Listed by: ONE SOTHEBY'S INTERNATIONAL REALTY $5,850,000Active5 beds 5 baths5,728 sq. ft.
9445 SW 72nd Ct, Pinecrest, FL 33156
MLS# A11872270Listed by: ONE SOTHEBY'S INTERNATIONAL REALTY $6,375,000Active6 beds 7 baths5,860 sq. ft.
9325 SW 59th Pl, Pinecrest, FL 33156
MLS# A11877527Listed by: COLDWELL BANKER REALTY $5,600,000Active7 beds 6 baths5,620 sq. ft.
9460 SW 69th Ave, Pinecrest, FL 33156
MLS# A11876952Listed by: MIAMI NEW REALTY $3,100,000Active4 beds 4 baths2,840 sq. ft.
10740 SW 73rd Ct, Pinecrest, FL 33156
MLS# A11876133Listed by: MIAMI NEW REALTY $6,350,000Active7 beds 8 baths6,977 sq. ft.
12820 SW 80th Ave, Pinecrest, FL 33156
MLS# A11876184Listed by: PRESTIGE REALTY GROUP, LLC $6,500,000Active7 beds 8 baths5,126 sq. ft.
12100 SW 79th Ave, Pinecrest, FL 33156
MLS# A11873273Listed by: COMPASS FLORIDA, LLC $4,250,000Active5 beds 6 baths4,906 sq. ft.
12801 Old Cutler Rd, Pinecrest, FL 33156
MLS# A11861693Listed by: COMPASS FLORIDA, LLC $3,600,000Active4 beds 5 baths
6023 76th St, South Miami, FL 33143
MLS# A11868945Listed by: B & B REAL ESTATE BROKER INC $3,749,000Active4 beds 4 baths4,638 sq. ft.
5780 Las Palmas Dr, Coral Gables, FL 33156
MLS# A11866528Listed by: RE/MAX ADVANCE REALTY $279,000Active1 beds 2 baths855 sq. ft.
6900 N Kendall Dr #A405, Pinecrest, FL 33156
MLS# A11866091Listed by: BHHS EWM REALTY $3,395,000Active5 beds 4 baths3,599 sq. ft.
5940 SW 120th St, Pinecrest, FL 33156
MLS# A11861792Listed by: ONE SOTHEBY'S INTERNATIONAL REALTY $2,900,000Pending5 beds 4 baths2,488 sq. ft.
10945 SW 75th Ct, Pinecrest, FL 33156
MLS# A11901820Listed by: URDAPILLETA REAL ESTATE, LLC $5,500,000Active6 beds 7 baths
7400 SW 127th St, Pinecrest, FL 33156
MLS# A11853970Listed by: ONE SOTHEBY'S INTERNATIONAL REALTY $6,450,000Pending6 beds 7 baths4,973 sq. ft.
5847 SW 81st St, South Miami, FL 33143
MLS# A11819383Listed by: COLDWELL BANKER REALTY $5,800,000Active6 beds 7 baths6,086 sq. ft.
7699 SW 118th St, Pinecrest, FL 33156
MLS# A11835950Listed by: FIRST SERVICE REALTY ERA $1,690,000Pending4 beds 5 baths3,202 sq. ft.
10170 SW 75th Pl, Pinecrest, FL 33156
MLS# A11859158Listed by: RE/MAX ADVANCE REALTY II $5,490,000Active5 beds 6 baths4,304 sq. ft.
5835 SW 81st St, South Miami, FL 33143
MLS# A11853742Listed by: SHELTON AND STEWART REALTORS $5,195,000Active6 beds 5 baths5,849 sq. ft.
10600 SW 69th Ave, Pinecrest, FL 33156
MLS# A11854730Listed by: OCEAN 55 PROPERTIES, LLC $9,995,000Active8 beds 11 baths11,626 sq. ft.
13580 SW 67th Ave, Pinecrest, FL 33156
MLS# A11851254Listed by: COMPASS FLORIDA, LLC $2,995,000Pending4 beds 3 baths2,747 sq. ft.
12365 SW 60th Ct, Pinecrest, FL 33156
MLS# A11940728Listed by: DLS INTERNATIONAL REALTY $4,600,000Active6 beds 7 baths4,646 sq. ft.
7621 SW 59th Ct, South Miami, FL 33143
MLS# A11837609Listed by: COMPASS FLORIDA, LLC $2,149,000Active5 beds 4 baths4,001 sq. ft.
13020 SW 70th Ave, Pinecrest, FL 33156
MLS# A11847582Listed by: COMPASS FLORIDA, LLC $5,499,000Active1.18 Acres
0 7245 SW 104th St, Pinecrest, FL 33156
MLS# A11845307Listed by: COMPASS FLORIDA, LLC. $1,450,000Active4 beds 3 baths2,383 sq. ft.
7475 SW 134th St, Pinecrest, FL 33156
MLS# A11844341Listed by: FIRST WAY REALTY SERVICES INC $12,595,000Active7 beds 9 baths
13500 SW 69th Ave, Pinecrest, FL 33156
MLS# A11839784Listed by: EXP REALTY LLC $5,499,000Active7 beds 7 baths9,792 sq. ft.
7245 SW 104th St, Pinecrest, FL 33156
MLS# A11833079Listed by: COMPASS FLORIDA, LLC.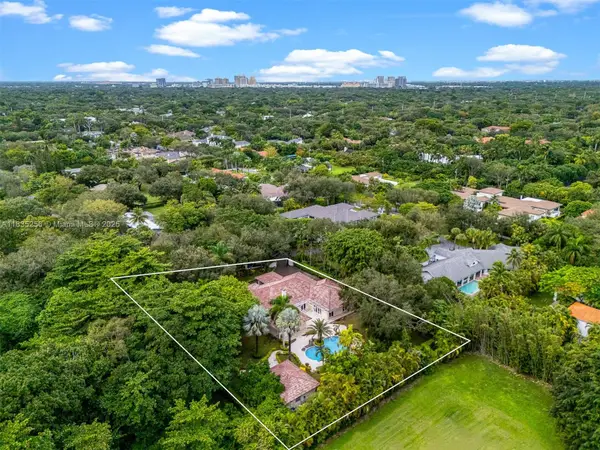 $4,050,000Active7 beds 6 baths5,114 sq. ft.
10735 SW 58th Ave, Pinecrest, FL 33156
MLS# A11835256Listed by: LUXE PROPERTIES $14,940,000Pending7 beds 9 baths11,493 sq. ft.
10101 SW 60th Ct, Pinecrest, FL 33156
MLS# A11826064Listed by: BROWN HARRIS STEVENS $7,000,000Active6 beds 8 baths7,400 sq. ft.
10851 SW 63rd Ave, Pinecrest, FL 33156
MLS# A11828951Listed by: BHHS EWM REALTY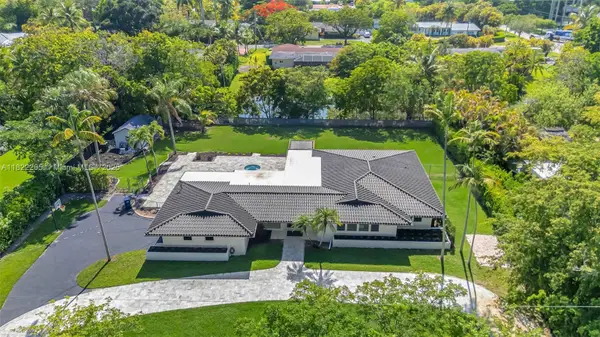 $2,600,000Active4 beds 3 baths2,038 sq. ft.
11230 SW 69th Ct, Pinecrest, FL 33156
MLS# A11822265Listed by: SOUTH FLORIDA REAL ESTATE BROKER & CONSULTANT, LLC $2,590,000Pending5 beds 3 baths3,272 sq. ft.
13200 SW 59th Ave, Pinecrest, FL 33156
MLS# A11822189Listed by: BHHS EWM REALTY $7,350,000Active7 beds 7 baths6,318 sq. ft.
8941 SW 65th Ct, Pinecrest, FL 33156
MLS# A11805403Listed by: THE KEYES COMPANY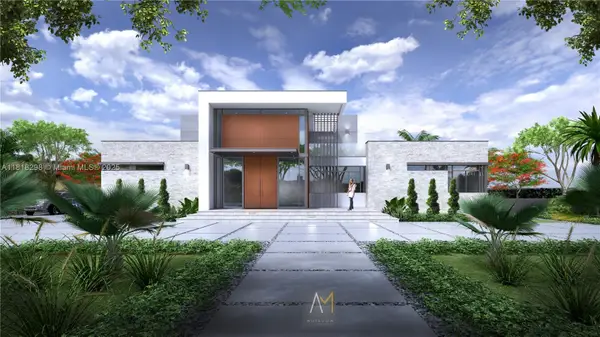 $12,150,000Active6 beds 10 baths
6421 SW 116th St, Pinecrest, FL 33156
MLS# A11818298Listed by: B & B REAL ESTATE BROKER INC $5,150,000Active4 beds 5 baths
7605 SW 134th St, Pinecrest, FL 33156
MLS# A11816596Listed by: B & B REAL ESTATE BROKER INC $11,995,000Active8 beds 10 baths9,406 sq. ft.
6730 SW 115th St, Pinecrest, FL 33156
MLS# A11971549Listed by: ONE SOTHEBY'S INTERNATIONAL REALTY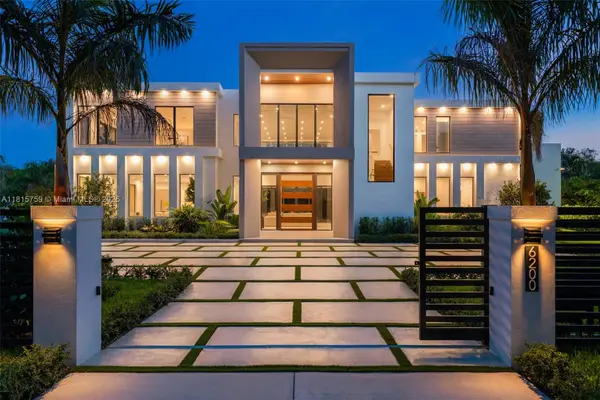 $7,995,000Active6 beds 7 baths6,609 sq. ft.
6200 Moss Ranch Rd, Pinecrest, FL 33156
MLS# A11815759Listed by: ONE SOTHEBY'S INTERNATIONAL REALTY $3,599,000Active6 beds 6 baths5,060 sq. ft.
6540 SW 135th Ter, Pinecrest, FL 33156
MLS# A11804380Listed by: HORIZON HOMES REALTY CORP $7,000,000Active6 beds 8 baths5,842 sq. ft.
13180 Old Cutler Rd, Pinecrest, FL 33156
MLS# A11792767Listed by: ONE SOTHEBY'S INTERNATIONAL REALTY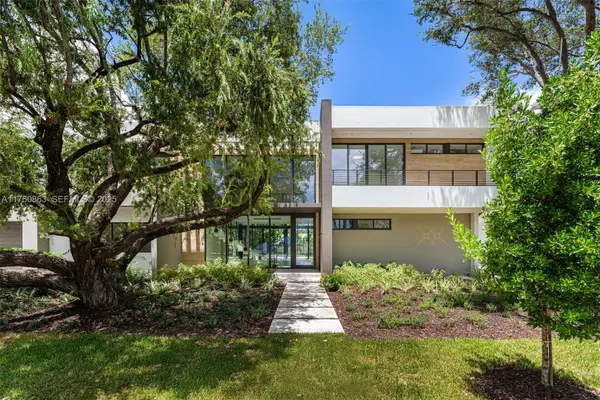 $6,350,000Active6 beds 8 baths5,920 sq. ft.
5921 SW 84th St, South Miami, FL 33143
MLS# A11760863Listed by: ONE SOTHEBY'S INTERNATIONAL REALTY- Open Sat, 12 to 2pm
 $7,299,000Active8 beds 9 baths8,277 sq. ft.
9076 SW 59th Ct, Pinecrest, FL 33156
MLS# A11962310Listed by: LUXE PROPERTIES  $8,750,000Active5 beds 7 baths6,091 sq. ft.
6240 SW 116th St, Pinecrest, FL 33156
MLS# A11745089Listed by: ONE SOTHEBY'S INTERNATIONAL REALTY $1,799,000Active4 beds 3 baths2,783 sq. ft.
13550 SW 82nd Ave, Pinecrest, FL 33156
MLS# A11720678Listed by: THE KEYES COMPANY $22,500,000Active8 beds 9 baths12,023 sq. ft.
5771 SW 94th St, Pinecrest, FL 33156
MLS# A11903520Listed by: COLDWELL BANKER REALTY $6,790,000Active5 beds 8 baths7,923 sq. ft.
10001 SW 60th Ct, Pinecrest, FL 33156
MLS# A11939919Listed by: ONE SOTHEBY'S INTERNATIONAL REALTY $15,600,000Active7 beds 9 baths
6058 SW 120th St, Pinecrest, FL 33156
MLS# A11693170Listed by: FLORIDIAN FIRST REALTY CORP $6,800,000Active7 beds 8 baths7,132 sq. ft.
6695 SW 112th St, Pinecrest, FL 33156
MLS# A11684991Listed by: CARMONA REALTY GROUP, LLC. $14,900,000Active7 beds 10 baths
6060 SW 120th St, Pinecrest, FL 33156
MLS# A11681331Listed by: FLORIDIAN FIRST REALTY CORP $4,795,000Active6 beds 8 baths5,494 sq. ft.
6250 SW 78th St, South Miami, FL 33143
MLS# A11861686Listed by: ISC REALTY CORP $14,999,900Active10 beds 12 baths
6666 SW 96th St, Pinecrest, FL 33156
MLS# A11671023Listed by: STEFANO REALTY, LLC. $5,995,000Active7 beds 8 baths8,321 sq. ft.
12110 SW 60th Ct, Pinecrest, FL 33156
MLS# A11637617Listed by: COLDWELL BANKER REALTY $9,995,000Active7 beds 9 baths8,912 sq. ft.
6675 SW 96th St, Pinecrest, FL 33156
MLS# A11609251Listed by: ISC REALTY CORP $2,780,000Active4 beds 6 baths3,748 sq. ft.
13400 SW 83rd Ave, Pinecrest, FL 33156
MLS# A11836692Listed by: FLORIDA CAPITAL REALTY $8,995,000Active9 beds 9 baths8,855 sq. ft.
9941 SW 60th Ct, Pinecrest, FL 33156
MLS# A11511534Listed by: ONE SOTHEBY'S INTERNATIONAL REALTY
Local realty services provided by:CENTURY 21 North East, CENTURY 21 AllPoints Realty
Information deemed reliable but not guaranteed. Information is provided, in part, by Greater Miami MLS. This information being provided is for consumer's personal, non-commercial use and may not be used for any other purpose other than to identify prospective properties consumers may be interested in purchasing.
Popular neighborhoods near East Kendall, Miami, FL
Zip codes near East Kendall, Miami, FL
- 33126 homes for sale
- 33133 homes for sale
- 33134 homes for sale
- 33135 homes for sale
- 33143 homes for sale
- 33144 homes for sale
- 33145 homes for sale
- 33146 homes for sale
- 33155 homes for sale
- 33156 homes for sale
- 33157 homes for sale
- 33158 homes for sale
- 33165 homes for sale
- 33173 homes for sale
- 33174 homes for sale
- 33175 homes for sale
- 33176 homes for sale
- 33183 homes for sale
- 33186 homes for sale
- 33189 homes for sale
Protect your home and budget from life's surprises with an Assurant Home Warranty, backed by a partner that supports you through every step of homeownership. Explore Plans.
©2026 Century 21 Real Estate LLC. All rights reserved. CENTURY 21®, the CENTURY 21 Logo and C21® are service marks owned by Century 21 Real Estate LLC. Century 21 Real Estate LLC fully supports the principles of the Fair Housing Act and the Equal Opportunity Act. Each office is independently owned and operated. Listing information is deemed reliable but not guaranteed accurate.