- Brandon, Dublin homes for sale
- Brookside, Columbus homes for sale
- Dexter Falls, Columbus homes for sale
- Don Scott, Columbus homes for sale
- Hayden Falls, Dublin homes for sale
- Henderson Heights, Columbus homes for sale
- Knolls West, Columbus homes for sale
- Misty Meadows, Columbus homes for sale
- Muirfield Village, Dublin homes for sale
- Northcrest, Columbus homes for sale
- Northwest Columbus, Dublin homes for sale
- Olentangy High Bluffs, Columbus homes for sale
- Olentangy Park, Columbus homes for sale
- Sawmill Park, Dublin homes for sale
- Shannon Heights, Dublin homes for sale
- Smoky Row, Liberty homes for sale
- Sycamore Hills, Columbus homes for sale
- The Gables, Columbus homes for sale
- Western Hills, Columbus homes for sale
- Worthington Hills, Columbus homes for sale
Foxboro, Columbus, OH - homes for sale
11 of 11 results displayed
- Coming Soon
 $335,000Coming Soon3 beds 2 baths
2425 Sanford Drive, Columbus, OH 43235
MLS# 226008899Listed by: EXP REALTY, LLC 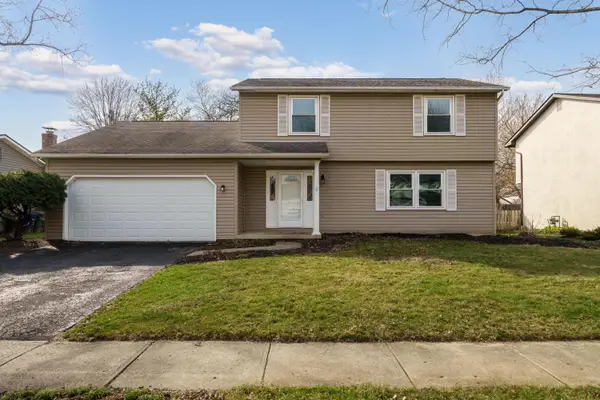 $325,000Active3 beds 3 baths2,186 sq. ft.
7641 Old Foxe Court, Columbus, OH 43235
MLS# 226006818Listed by: KELLER WILLIAMS CAPITAL PTNRS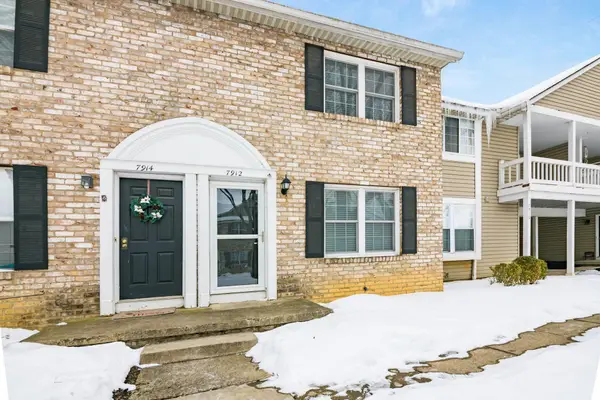 $225,000Active2 beds 2 baths1,024 sq. ft.
7912 Meadowhaven Boulevard, Columbus, OH 43235
MLS# 226004006Listed by: BEST HOMES REAL ESTATE LTD.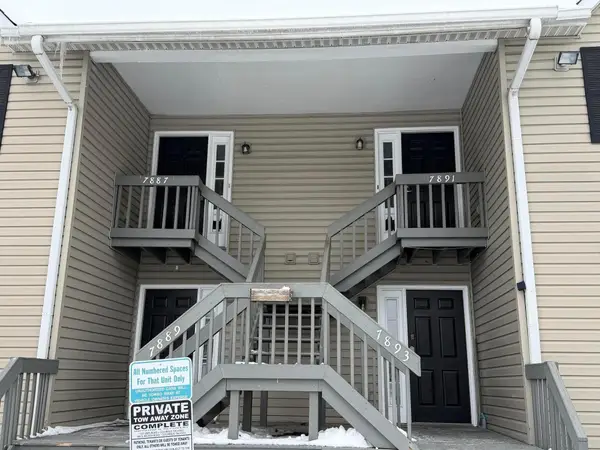 $175,000Active2 beds 1 baths840 sq. ft.
7891 Thornfield Lane, Columbus, OH 43235
MLS# 226003024Listed by: COLDWELL BANKER REALTY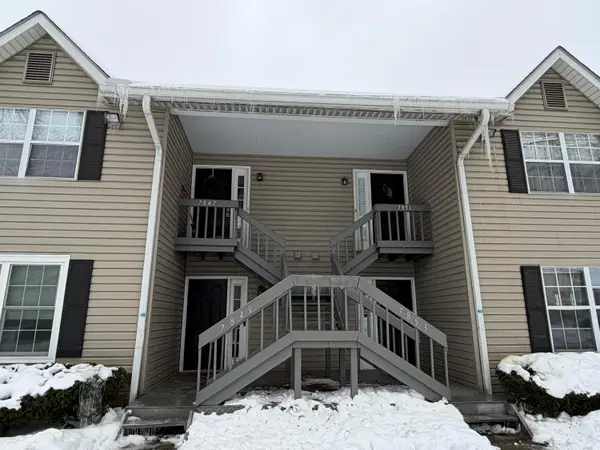 $175,000Active2 beds 1 baths840 sq. ft.
7847 Meadowhaven Boulevard, Columbus, OH 43235
MLS# 226003016Listed by: COLDWELL BANKER REALTY $175,000Active2 beds 1 baths840 sq. ft.
7853 Meadowhaven Boulevard, Columbus, OH 43235
MLS# 226003020Listed by: COLDWELL BANKER REALTY $175,000Active2 beds 1 baths840 sq. ft.
7887 Thornfield Lane, Columbus, OH 43235
MLS# 226003021Listed by: COLDWELL BANKER REALTY $435,000Active3 beds 2 baths1,547 sq. ft.
2392 Dunsworth Drive, Columbus, OH 43235
MLS# 225039949Listed by: BEYCOME BROKERAGE REALTY LLC- Open Sat, 1 to 3pm
 $385,000Active3 beds 2 baths1,386 sq. ft.
2469 Sandstrom Drive, Columbus, OH 43235
MLS# 225035287Listed by: SIGNATURE REAL ESTATE  $174,000Active2 beds 1 baths840 sq. ft.
7871 Thornfield Lane, Columbus, OH 43235
MLS# 225032256Listed by: RED 1 REALTY $234,500Active2 beds 2 baths1,264 sq. ft.
7917 Meadowhaven Boulevard, Columbus, OH 43235
MLS# 225021171Listed by: RE/MAX PREMIER CHOICE
Local realty services provided by:CENTURY 21 HomeStar
All information deemed reliable but not guaranteed and should be independently verified. All properties are subject to prior sale, change or withdrawal. Neither listing broker(s) nor CENTURY 21 HomeStar shall be responsible for any typographical errors, misinformation, misprints and shall be held totally harmless.
Popular neighborhoods near Foxboro, Columbus, OH
Zip codes near Foxboro, Columbus, OH
- 43016 homes for sale
- 43017 homes for sale
- 43026 homes for sale
- 43035 homes for sale
- 43065 homes for sale
- 43081 homes for sale
- 43082 homes for sale
- 43085 homes for sale
- 43201 homes for sale
- 43202 homes for sale
- 43211 homes for sale
- 43212 homes for sale
- 43214 homes for sale
- 43220 homes for sale
- 43221 homes for sale
- 43224 homes for sale
- 43229 homes for sale
- 43231 homes for sale
- 43235 homes for sale
- 43240 homes for sale
Counties near Foxboro, Columbus, OH
- Champaign County homes for sale
- Clark County homes for sale
- Crawford County homes for sale
- Delaware County homes for sale
- Fairfield County homes for sale
- Fayette County homes for sale
- Franklin County homes for sale
- Greene County homes for sale
- Hardin County homes for sale
- Knox County homes for sale
- Licking County homes for sale
- Logan County homes for sale
- Madison County homes for sale
- Marion County homes for sale
- Morrow County homes for sale
- Perry County homes for sale
- Pickaway County homes for sale
- Ross County homes for sale
- Union County homes for sale
- Wyandot County homes for sale
Protect your home and budget from life's surprises with an Assurant Home Warranty, backed by a partner that supports you through every step of homeownership. Explore Plans.
©2026 Century 21 Real Estate LLC. All rights reserved. CENTURY 21®, the CENTURY 21 Logo and C21® are service marks owned by Century 21 Real Estate LLC. Century 21 Real Estate LLC fully supports the principles of the Fair Housing Act and the Equal Opportunity Act. Each office is independently owned and operated. Listing information is deemed reliable but not guaranteed accurate.