- Ashland Park, Lexington homes for sale
- Aylesford Place, Lexington homes for sale
- Bryan Station, Lexington homes for sale
- Castlewood, Lexington homes for sale
- District 1, Lexington homes for sale
- District 6, Lexington homes for sale
- Eastland Parkway, Lexington homes for sale
- Fairway, Lexington homes for sale
- Georgetown Street, Lexington homes for sale
- Glens at Greendale, Lexington homes for sale
- Griffin Gate, Lexington homes for sale
- Historic South Hill, Lexington homes for sale
- Kenwick, Lexington homes for sale
- Liberty Area, Lexington homes for sale
- Martin Luther King, Lexington homes for sale
- Meadows/Loudon, Lexington homes for sale
- North Upper Street, Lexington homes for sale
- Northside, Lexington homes for sale
- Radcliffe, Lexington homes for sale
- William Wells Brown, Lexington homes for sale
Joyland, Lexington, KY - homes for sale
15 of 15 results displayed
- New
 $310,000Active3 beds 4 baths1,400 sq. ft.
1813 Eden Cove, Lexington, KY 40505
MLS# 26005889Listed by: KELLER WILLIAMS BLUEGRASS REALTY  $258,000Pending3 beds 1 baths1,500 sq. ft.
604 Freeman Drive, Lexington, KY 40505
MLS# 26005620Listed by: STEWART & CO REALTY LLC $225,000Pending3 beds 1 baths975 sq. ft.
604 Parkside Drive, Lexington, KY 40505
MLS# 26004975Listed by: LIFSTYL REAL ESTATE $269,999Pending3 beds 2 baths1,365 sq. ft.
603 Eden Road, Lexington, KY 40505
MLS# 26004978Listed by: DIY FLAT FEE.COM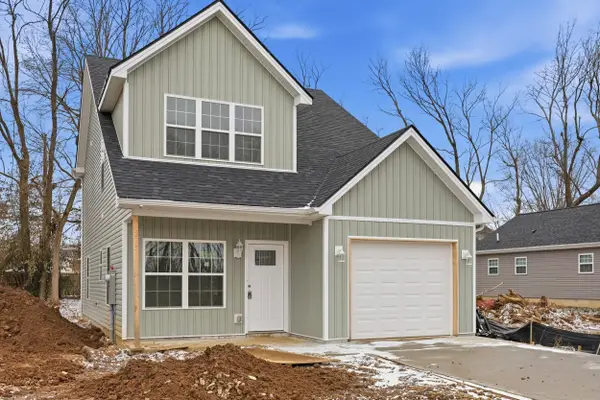 $319,000Pending3 beds 3 baths1,491 sq. ft.
720 Harrison Trace, Lexington, KY 40505
MLS# 26003996Listed by: NATIONAL REAL ESTATE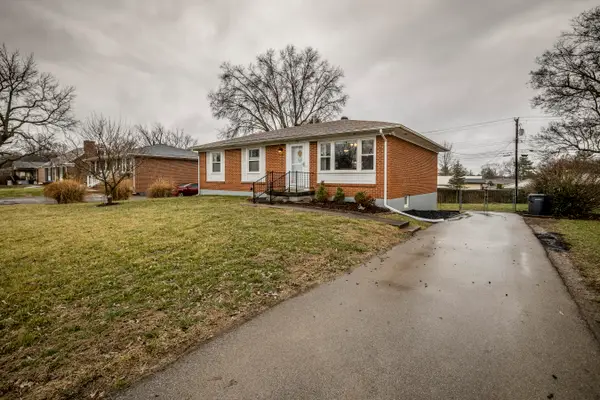 $295,000Pending3 beds 2 baths2,147 sq. ft.
760 Faulkner Avenue, Lexington, KY 40505
MLS# 26003973Listed by: EXP REALTY, LLC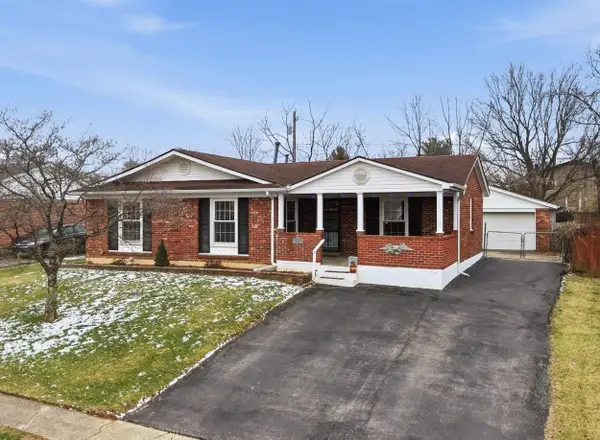 $294,900Pending3 beds 2 baths1,584 sq. ft.
744 Kingston Road, Lexington, KY 40505
MLS# 26003452Listed by: UNITED REAL ESTATE BLUEGRASS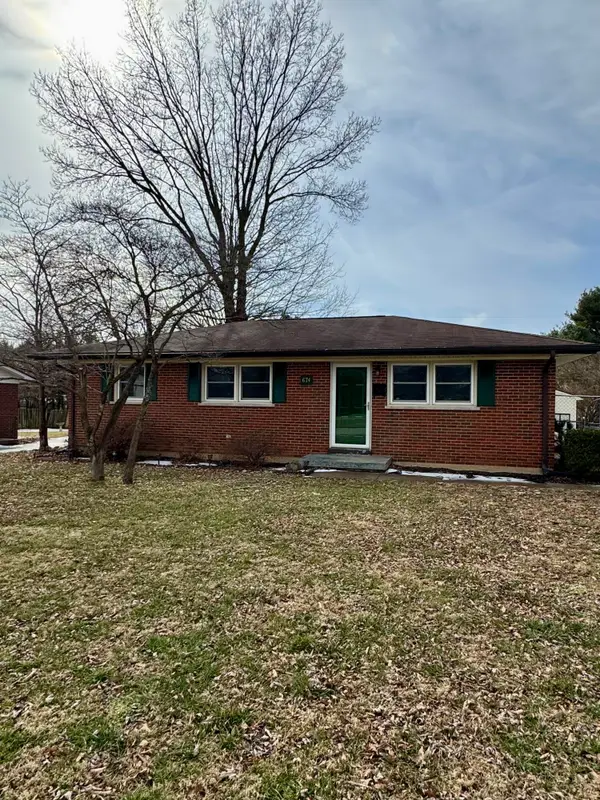 $219,000Pending3 beds 1 baths1,025 sq. ft.
674 Leslie Court, Lexington, KY 40505
MLS# 26002967Listed by: UNITED REAL ESTATE BLUEGRASS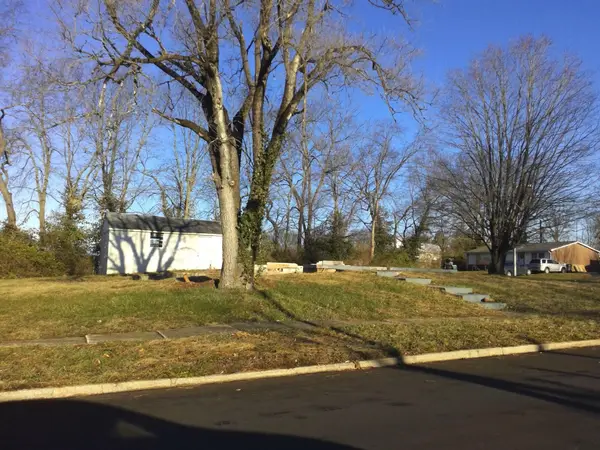 $100,000Active0.49 Acres
2339 Pierson Drive, Lexington, KY 40505
MLS# 26002399Listed by: RED 1 REALTY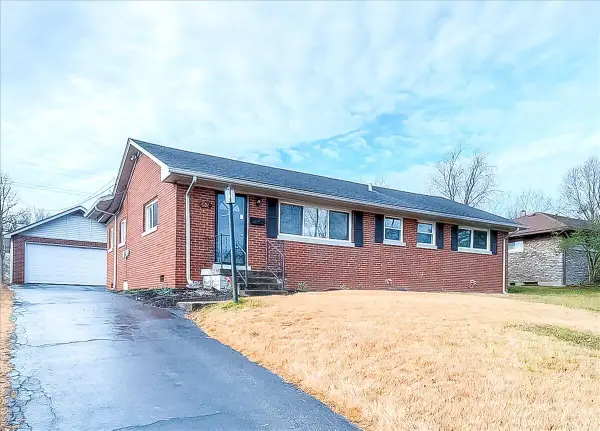 $259,900Pending3 beds 2 baths1,300 sq. ft.
606 Freeman Drive, Lexington, KY 40505
MLS# 26000855Listed by: PLUM TREE REALTY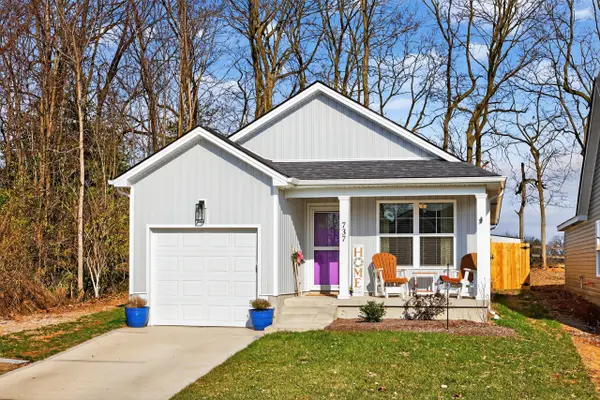 $302,000Pending3 beds 2 baths1,312 sq. ft.
737 Harrison Trace, Lexington, KY 40505
MLS# 26000109Listed by: LIFSTYL REAL ESTATE $314,000Active3 beds 3 baths1,884 sq. ft.
729 Burgoyne Court, Lexington, KY 40505
MLS# 25506203Listed by: PLUM TREE REALTY $395,000Pending2.91 Acres
2275 N Broadway, Lexington, KY 40505
MLS# 25505693Listed by: SOUTHERN CHARM REALTY $244,500Active3 beds 2 baths1,457 sq. ft.
2465 Wanda Court, Lexington, KY 40505
MLS# 25502045Listed by: THWAITES REALTORS LLC $297,900Active3 beds 2 baths1,284 sq. ft.
729 Harrison Trace, Lexington, KY 40505
MLS# 25500548Listed by: GUIDE REALTY, INC.
Local realty services provided by:CENTURY 21 Advantage Realty
Popular neighborhoods near Joyland, Lexington, KY
Zip codes near Joyland, Lexington, KY
- 40324 homes for sale
- 40347 homes for sale
- 40356 homes for sale
- 40361 homes for sale
- 40383 homes for sale
- 40390 homes for sale
- 40391 homes for sale
- 40502 homes for sale
- 40503 homes for sale
- 40504 homes for sale
- 40505 homes for sale
- 40507 homes for sale
- 40508 homes for sale
- 40509 homes for sale
- 40511 homes for sale
- 40513 homes for sale
- 40514 homes for sale
- 40515 homes for sale
- 40516 homes for sale
- 40517 homes for sale
Counties near Joyland, Lexington, KY
- Anderson County homes for sale
- Bath County homes for sale
- Bourbon County homes for sale
- Boyle County homes for sale
- Clark County homes for sale
- Estill County homes for sale
- Fayette County homes for sale
- Franklin County homes for sale
- Garrard County homes for sale
- Grant County homes for sale
- Harrison County homes for sale
- Jessamine County homes for sale
- Madison County homes for sale
- Mercer County homes for sale
- Montgomery County homes for sale
- Nicholas County homes for sale
- Owen County homes for sale
- Robertson County homes for sale
- Scott County homes for sale
- Woodford County homes for sale
Protect your home and budget from life's surprises with an Assurant Home Warranty, backed by a partner that supports you through every step of homeownership. Explore Plans.
©2026 Century 21 Real Estate LLC. All rights reserved. CENTURY 21®, the CENTURY 21 Logo and C21® are service marks owned by Century 21 Real Estate LLC. Century 21 Real Estate LLC fully supports the principles of the Fair Housing Act and the Equal Opportunity Act. Each office is independently owned and operated. Listing information is deemed reliable but not guaranteed accurate.