- Albany homes for sale
- Alexander homes for sale
- Athens Township homes for sale
- Athens homes for sale
- Canaan homes for sale
- Creola homes for sale
- Elk homes for sale
- Lee homes for sale
- Lodi homes for sale
- McArthur homes for sale
- Nelsonville homes for sale
- New Plymouth homes for sale
- Scipio homes for sale
- Starr homes for sale
- Swan homes for sale
- Vinton homes for sale
- Ward homes for sale
- Washington homes for sale
- Waterloo homes for sale
- York homes for sale
45766, OH - homes for sale
2 of 2 results displayed
- New
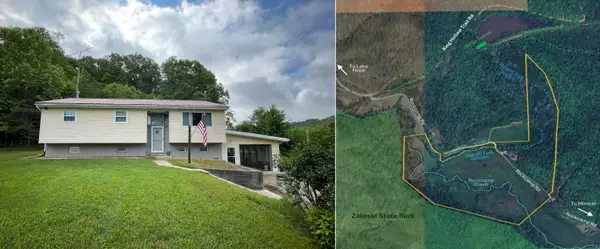 $829,000Active5 beds 2 baths1,352 sq. ft.
960 Rockcamp Road, New Marshfield, OH 45766
MLS# 226023193Listed by: HOMECOIN.COM 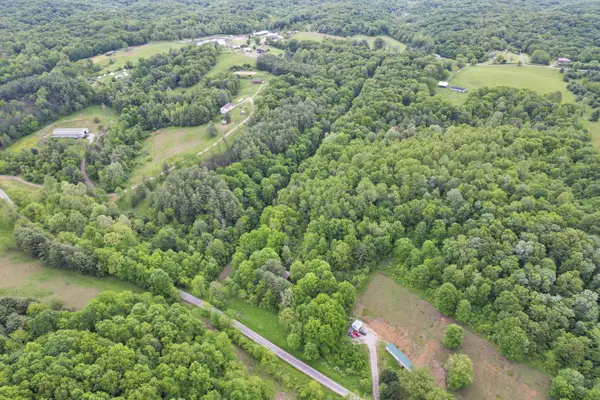 $190,000Active15 Acres
11250 Grass Run Road, New Marshfield, OH 45766
MLS# 225019277Listed by: KELLER WILLIAMS CONSULTANTS
Local realty services provided by:CENTURY 21 Premiere Properties
All information deemed reliable but not guaranteed and should be independently verified. All properties are subject to prior sale, change or withdrawal. Neither listing broker(s) nor CENTURY 21 Premiere Properties shall be responsible for any typographical errors, misinformation, misprints and shall be held totally harmless.
Popular searches near 45766
Popular neighborhoods near 45766
- Abby Trails, Canal Winchester homes for sale
- Beech Wood Trails, Pataskala homes for sale
- Blacklick Estates, Columbus homes for sale
- Brice, Canal Winchester homes for sale
- Cedar Heights, Lancaster homes for sale
- East Columbus, Columbus homes for sale
- Eastland, Columbus homes for sale
- George's Creek, Canal Winchester homes for sale
- Hazelwood, Pataskala homes for sale
- Independence Village, Canal Winchester homes for sale
- Madison Mills, Columbus homes for sale
- Oakmont, Columbus homes for sale
- Shannon Square, Canal Winchester homes for sale
- Sixth Ward, Portsmouth homes for sale
- Three Rivers, Groveport homes for sale
- Turnberry, Pickerington homes for sale
- Walnut Heights, Columbus homes for sale
- White Ash, Canal Winchester homes for sale
- Williams Creek, Columbus homes for sale
- Winchester, Groveport homes for sale
Counties near New Marshfield, 45766
- Athens County homes for sale
- Fairfield County homes for sale
- Gallia County homes for sale
- Hocking County homes for sale
- Jackson County homes for sale
- Jackson County homes for sale
- Lawrence County homes for sale
- Mason County homes for sale
- Meigs County homes for sale
- Morgan County homes for sale
- Muskingum County homes for sale
- Noble County homes for sale
- Perry County homes for sale
- Pickaway County homes for sale
- Pike County homes for sale
- Ross County homes for sale
- Vinton County homes for sale
- Washington County homes for sale
- Wirt County homes for sale
- Wood County homes for sale
Protect your home and budget from life's surprises with an Assurant Home Warranty, backed by a partner that supports you through every step of homeownership. Explore Plans.
©2026 Century 21 Real Estate LLC. All rights reserved. CENTURY 21®, the CENTURY 21 Logo and C21® are service marks owned by Century 21 Real Estate LLC. Century 21 Real Estate LLC fully supports the principles of the Fair Housing Act and the Equal Opportunity Act. Each office is independently owned and operated. Listing information is deemed reliable but not guaranteed accurate.