- Annadale, Staten Island homes for sale
- Avenel, Avenel homes for sale
- Fords, Fords homes for sale
- Harbortown, Perth Amboy homes for sale
- Hopelawn, Perth Amboy homes for sale
- Huguenot, Staten Island homes for sale
- Iselin, Iselin homes for sale
- Keasbey, Keasbey homes for sale
- La Mer, Parlin homes for sale
- Menlo Park, Edison homes for sale
- Pleasant Plains, Staten Island homes for sale
- Port Reading, Sewaren homes for sale
- Prince's Bay, Staten Island homes for sale
- Richmond Valley, Staten Island homes for sale
- South Shore, Staten Island homes for sale
- Tottenville, Staten Island homes for sale
- Tottenville Beach, Staten Island homes for sale
- West Shore, Staten Island homes for sale
- Woodbridge Proper, Woodbridge homes for sale
- Woodrow, Staten Island homes for sale
Perth Amboy, NJ - homes for sale
2 of 2 results displayed
- Coming Soon
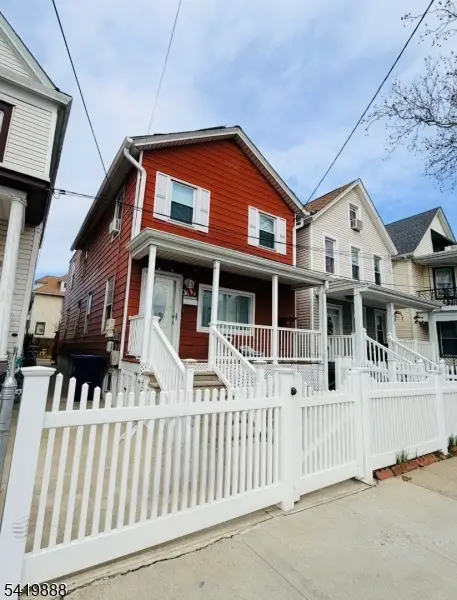 $475,000Coming Soon3 beds 3 baths
300 Washington St, Perth Amboy City, NJ 08861
MLS# 4016822Listed by: LIM BANCES REALTY - Open Sat, 1 to 3pm
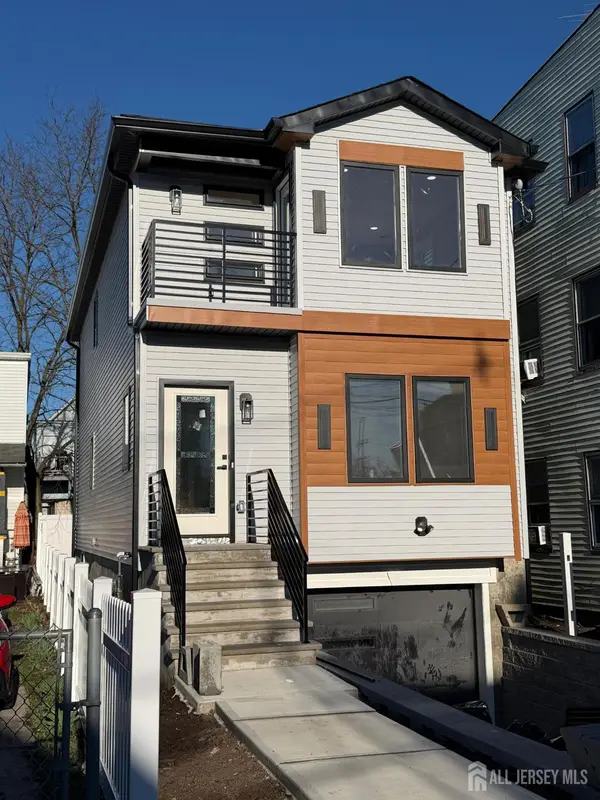 $650,000Active4 beds 3 baths
-589 Elizabeth Street, Perth Amboy, NJ 08861
MLS# 2612315RListed by: UNITED R.E. OF NORTH JERSEY
Local realty services provided by:CENTURY 21 Full Service Realty, CENTURY 21 Charles Smith Agency, Inc.
The data relating to real estate for sale on this website comes in part from the IDX Program of Garden State Multiple Listing Service, L.L.C. Real estate listings held by other brokerage firms are marked as IDX Listing. Information deemed reliable but not guaranteed. 2026 Garden State Multiple Listing Service, L.L.C. All rights reserved. Notice: The dissemination of listings on this website does not constitute the consent required by N.J.A.C. 11:5.6.1 (n) for the advertisement of listings exclusively for sale by another broker. Any such consent must be obtained in writing from the listing broker. This information is being provided for Consumers' personal, non-commercial use and may not be used for any purpose other than to identify prospective properties Consumers may be interested in purchasing. Date Last Updated March 27, 2026
The data relating to real estate for sale on this web-site comes in part from the Internet Listing Display database of the CENTRAL JERSEY MULTIPLE LISTING SYSTEM, INC. Real estate listings held by brokerage firms other than this site-owner are marked with the ILD logo. The CENTRAL JERSEY MULTIPLE LISTING SYSTEM, INC does not warrant the accuracy, quality, reliability, suitability, completeness, usefulness or effectiveness of any information provided. The information being provided is for consumers' personal, non-commercial use and may not be used for any purpose other than to identify properties the consumer may be interested in purchasing or renting. Copyright 2026, CENTRAL JERSEY MULTIPLE LISTING SYSTEM, INC. All rights reserved”. The CENTRAL JERSEY MULTIPLE LISTING SYSTEM, INC retains all rights, title and interest in and to its trademarks, service marks and copyrighted material.
Neighborhoods near Perth Amboy, NJ
Popular searches near Perth Amboy, NJ
- Aberdeen homes for sale
- Avenel homes for sale
- Carteret homes for sale
- Cliffwood homes for sale
- Cliffwood Beach homes for sale
- Colonia homes for sale
- Fords homes for sale
- Hopelawn homes for sale
- Iselin homes for sale
- Keasbey homes for sale
- Laurence Harbor homes for sale
- Madison Park homes for sale
- Metuchen homes for sale
- Parlin homes for sale
- Port Reading homes for sale
- Rahway homes for sale
- Sayreville homes for sale
- South Amboy homes for sale
- Woodbridge homes for sale
- Woodbridge Township homes for sale
Protect your home and budget from life's surprises with an Assurant Home Warranty, backed by a partner that supports you through every step of homeownership. Explore Plans.
©2026 Century 21 Real Estate LLC. All rights reserved. CENTURY 21®, the CENTURY 21 Logo and C21® are service marks owned by Century 21 Real Estate LLC. Century 21 Real Estate LLC fully supports the principles of the Fair Housing Act and the Equal Opportunity Act. Each office is independently owned and operated. Listing information is deemed reliable but not guaranteed accurate.