- Alta Loma homes for sale
- Bloomington homes for sale
- Chino homes for sale
- Claremont homes for sale
- Eastvale homes for sale
- Fontana homes for sale
- Jurupa homes for sale
- Jurupa Valley homes for sale
- La Verne homes for sale
- Lytle Creek homes for sale
- Mira Loma homes for sale
- Montclair homes for sale
- Mt Baldy homes for sale
- Ontario homes for sale
- Phillips Ranch homes for sale
- Pomona homes for sale
- Rancho Cucamonga homes for sale
- Rialto homes for sale
- San Antonio Heights homes for sale
- Upland homes for sale
91730, CA - homes for sale
13 of 13 results displayed
- Open Sat, 11am to 2pmNew
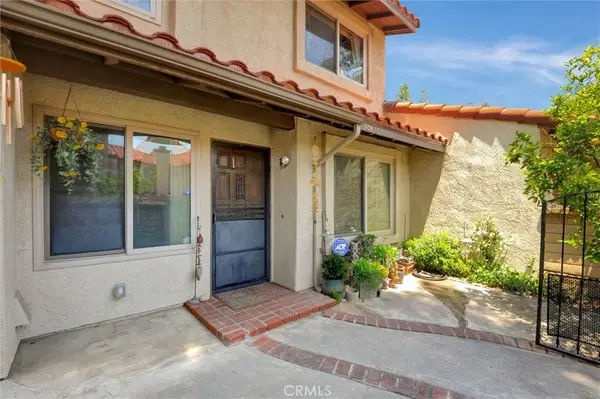
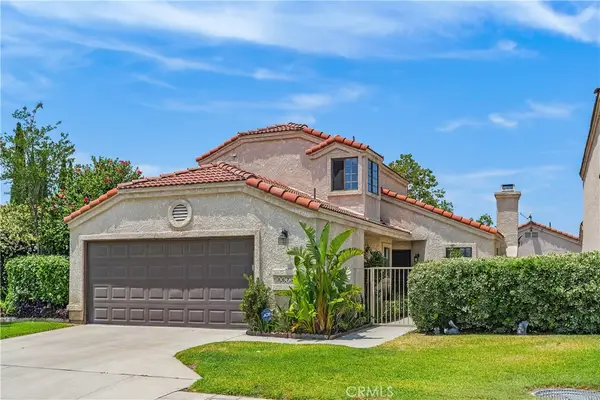 $670,000Active4 beds 3 baths1,613 sq. ft.
8672 San Miguel Place, Rancho Cucamonga, CA 91730
MLS# IG26126045Listed by: FIRST TEAM REAL ESTATE - Open Sat, 12 to 3pmNew
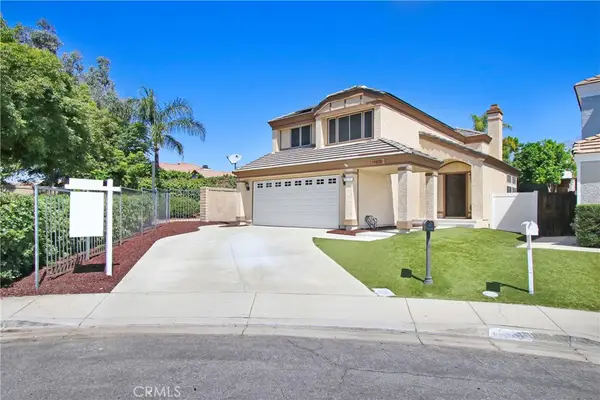
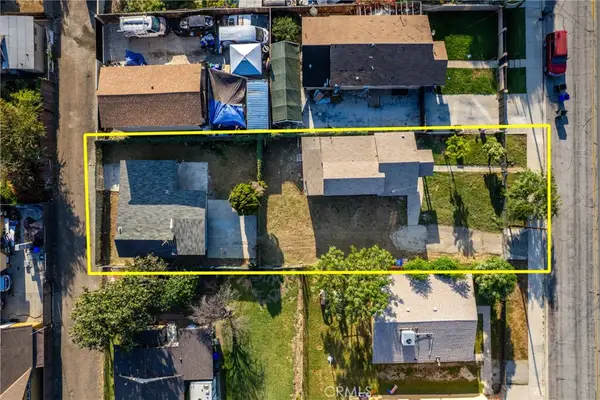
 $750,000Active4 beds 2 baths1,440 sq. ft.
8028 Orangewood Drive, Rancho Cucamonga, CA 91730
MLS# PW26123432Listed by: ELEVATE REAL ESTATE AGENCY - Open Sat, 12 to 3pmNew
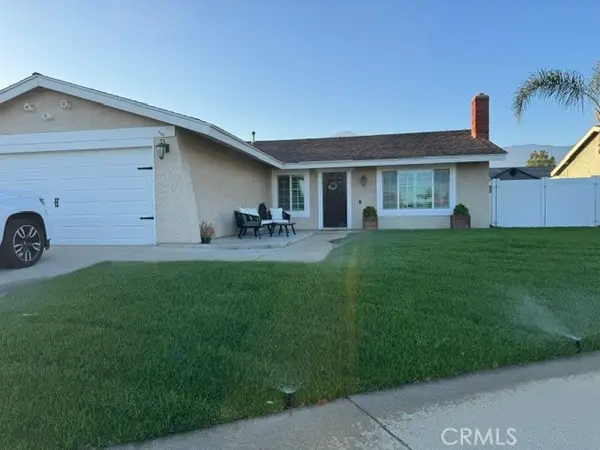
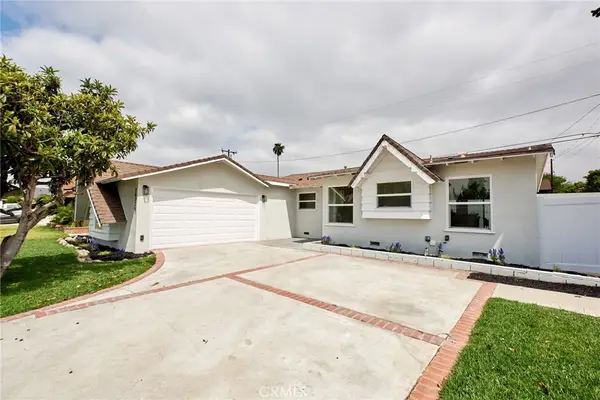
 $739,900Active3 beds 2 baths1,134 sq. ft.
9805 Devon Street, Rancho Cucamonga, CA 91730
MLS# IV26125656Listed by: PACIFIC HOME BROKERS - Open Sat, 12 to 3pmNew
 $739,900Active3 beds 2 baths1,134 sq. ft.
9805 Devon Street, Rancho Cucamonga, CA 91730
MLS# IV26125656Listed by: PACIFIC HOME BROKERS - Open Sun, 12 to 3pmNew
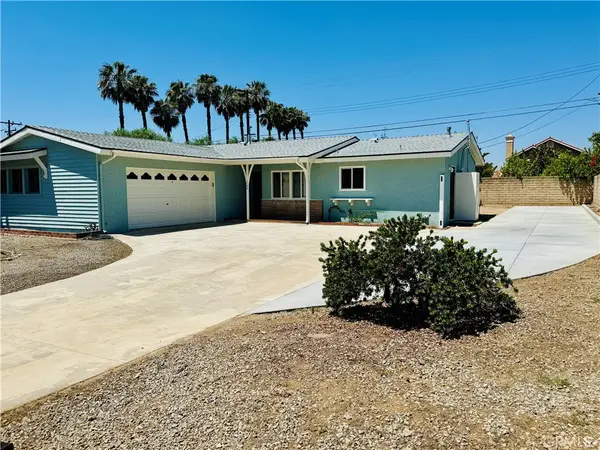
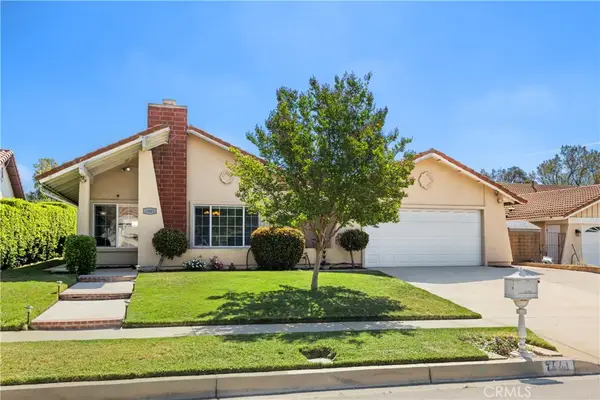
 $799,900Active4 beds 3 baths1,957 sq. ft.
11070 Brentwood, Rancho Cucamonga, CA 91730
MLS# CV26124218Listed by: COMPASS - Coming SoonOpen Sat, 1 to 3pm
 $775,000Coming Soon3 beds 2 baths
10478 Candlewood, Rancho Cucamonga, CA 91730
MLS# IG26123279Listed by: CENTURY 21 LOIS LAUER REALTY - Open Sat, 10am to 1pmNew
 $525,000Active3 beds 3 baths1,480 sq. ft.
9757 La Monica Drive, Rancho Cucamonga, CA 91730
MLS# CV26121615Listed by: ELEVATE REAL ESTATE AGENCY - Open Sat, 12 to 3pmNew
 $785,000Active4 beds 2 baths1,293 sq. ft.
7444 Via Serena, Rancho Cucamonga, CA 91730
MLS# CV26121148Listed by: KELLER WILLIAMS REALTY COLLEGE PARK - Coming Soon
 $2,299,000Coming Soon5 beds 4 baths
8089 Camino Predera, Rancho Cucamonga, CA 91730
MLS# CV26114520Listed by: THE AGENCY - Open Sat, 10 to 1pm
 $529,999Active3 beds 3 baths1,480 sq. ft.
9861 Paloma Court, Rancho Cucamonga, CA 91730
MLS# CV26109764Listed by: LOCAL PROFESSIONAL REALTY - Open Sun, 11am to 2pm
 $799,888Active4 beds 2 baths1,200 sq. ft.
9777 Feron, Rancho Cucamonga, CA 91730
MLS# CV26108199Listed by: CENTURY 21 SYNERGIA REALTY - Open Thu, 5pm to 7am
 $750,000Active3 beds 2 baths1,576 sq. ft.
10230 Dorset, Rancho Cucamonga, CA 91730
MLS# CV26104742Listed by: RE/MAX INNOVATIONS - Open Sat, 11am to 2pm
 $800,000Active4 beds 2 baths1,956 sq. ft.
7441 Mesada Street, Rancho Cucamonga, CA 91730
MLS# SW26087565Listed by: REDFIN CORPORATION
Local realty services provided by:CENTURY 21 Select Real Estate, Inc., CENTURY 21 Affiliated
The information being provided by California Regional MLS (Southern California) is for the consumer's personal, non-commercial use and may not be used for any purpose other than to identify prospective properties consumer may be interested in purchasing. Any information relating to real estate for sale referenced on this web site comes from the Internet Data Exchange (IDX) program of the California Regional MLS (Southern California). CENTURY 21 Select Real Estate, Inc. is not a Multiple Listing Service (MLS), nor does it offer MLS access. This website is a service of CENTURY 21 Select Real Estate, Inc., a broker participant of California Regional MLS (Southern California). This web site may reference real estate listing(s) held by a brokerage firm other than the broker and/or agent who owns this web site.
The accuracy of all information, regardless of source, including but not limited to open house information, square footages and lot sizes, is deemed reliable but not guaranteed and should be personally verified through personal inspection by and/or with the appropriate professionals. The data contained herein is copyrighted by California Regional MLS (Southern California) and is protected by all applicable copyright laws. Any unauthorized dissemination of this information is in violation of copyright laws and is strictly prohibited.
Copyright 2021 California Regional MLS (Southern California). All rights reserved.
This information is deemed reliable but not guaranteed. You should rely on this information only to decide whether or not to further investigate a particular property. BEFORE MAKING ANY OTHER DECISION, YOU SHOULD PERSONALLY INVESTIGATE THE FACTS (e.g. square footage and lot size) with the assistance of an appropriate professional. You may use this information only to identify properties you may be interested in investigating further. All uses except for personal, non-commercial use in accordance with the foregoing purpose are prohibited. Redistribution or copying of this information, any photographs or video tours is strictly prohibited. This information is derived from the Internet Data Exchange (IDX) service provided by San Diego MLS®. Displayed property listings may be held by a brokerage firm other than the broker and/or agent responsible for this display. The information and any photographs and video tours and the compilation from which they are derived is protected by copyright. Compilation © 2020 San Diego MLS®, Inc. SANDICOR Member Broker: Nikki Coppa
Popular searches near 91730
Popular neighborhoods near 91730
- Archibald Ranch, Ontario homes for sale
- California Commerce Center, Ontario homes for sale
- Creekside, Ontario homes for sale
- Eden Glen, Ontario homes for sale
- Etiwanda, Rancho Cucamonga homes for sale
- Foothill Boulevard, Rancho Cucamonga homes for sale
- Harvest at Upland, Upland homes for sale
- North Etiwanda, Rancho Cucamonga homes for sale
- Ontario Center, Ontario homes for sale
- Parkside, Ontario homes for sale
- Rancho Fontana, Fontana homes for sale
- Rancho Santa Ana del Chino, Ontario homes for sale
- Red Hills Rancho Homes, Rancho Cucamonga homes for sale
- San Antonio Heights, Upland homes for sale
- Southeast Rancho Cucamonga, Rancho Cucamonga homes for sale
- Southwest Rancho Cucamonga, Rancho Cucamonga homes for sale
- Terra Vista, Rancho Cucamonga homes for sale
- Upland Hills, Upland homes for sale
- Victoria, Rancho Cucamonga homes for sale
- West End, Fontana homes for sale
Protect your home and budget from life's surprises with an Assurant Home Warranty, backed by a partner that supports you through every step of homeownership. Explore Plans.
©2026 Century 21 Real Estate LLC. All rights reserved. CENTURY 21®, the CENTURY 21 Logo and C21® are service marks owned by Century 21 Real Estate LLC. Century 21 Real Estate LLC fully supports the principles of the Fair Housing Act and the Equal Opportunity Act. Each office is independently owned and operated. Listing information is deemed reliable but not guaranteed accurate.