- Andros Isle, West Palm Beach homes for sale
- Baywinds, West Palm Beach homes for sale
- Breakers West, West Palm Beach homes for sale
- Crestwood, West Palm Beach homes for sale
- French Quarter, Wellington homes for sale
- Golden Lakes, West Palm Beach homes for sale
- La Mancha, West Palm Beach homes for sale
- Loxahatchee Groves, Loxahatchee homes for sale
- Madison Green, West Palm Beach homes for sale
- Palm Beach Little Ranches, Wellington homes for sale
- Park Place, Wellington homes for sale
- Pinewood, Wellington homes for sale
- Pinewood East 2, Wellington homes for sale
- Saratoga, West Palm Beach homes for sale
- South Shore, Wellington homes for sale
- Sugar Pond Manor, Wellington homes for sale
- The Willows, West Palm Beach homes for sale
- Village Walk, Royal Palm Beach homes for sale
- Wellingtons Edge, Wellington homes for sale
- Worthington, West Palm Beach homes for sale
Royal Palm Beach, FL - homes for sale
187 of 187 results displayed
- New
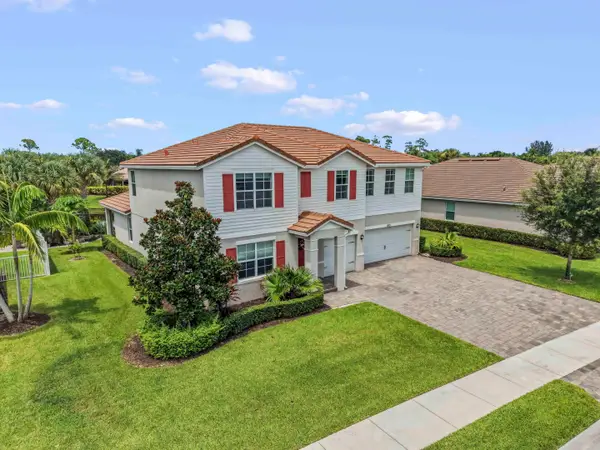 $825,000Active6 beds 4 baths3,784 sq. ft.
11971 Cypress Key Way, Royal Palm Beach, FL 33411
MLS# B26054973Listed by: KW RESERVE PALM BEACH - New
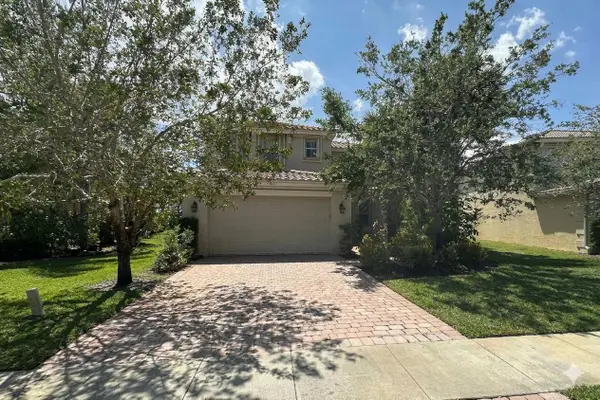 $589,900Active4 beds 3 baths2,295 sq. ft.
2709 Pienza Circle, Royal Palm Beach, FL 33411
MLS# B26054814Listed by: MAINSTAY BROKERAGE LLC - New
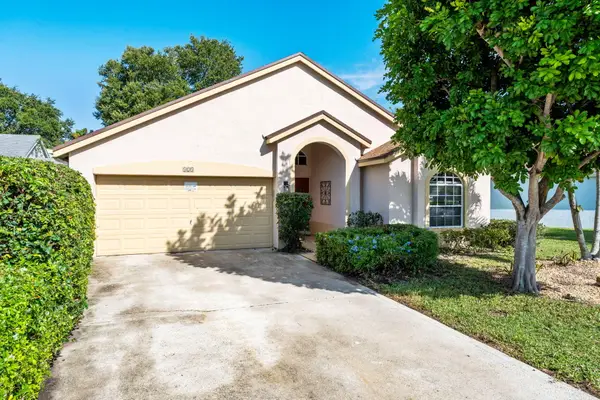 $515,000Active3 beds 2 baths1,758 sq. ft.
125 Saratoga Boulevard E, Royal Palm Beach, FL 33411
MLS# B26054584Listed by: LIFESTYLE INTERNATIONAL REALTY - New
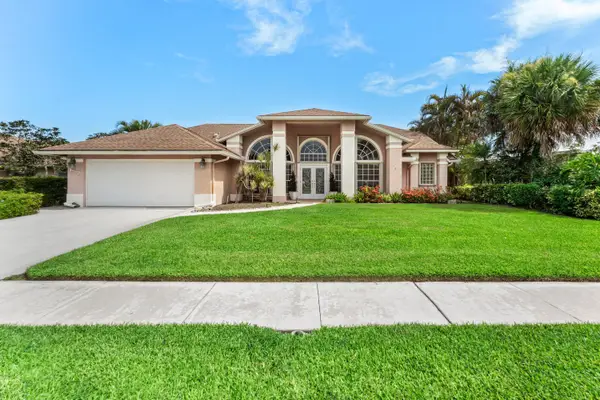 $599,900Active4 beds 2 baths2,147 sq. ft.
157 Monterey Way, Royal Palm Beach, FL 33411
MLS# B26054295Listed by: RE/MAX PRESTIGE REALTY/RPB - New
 $1,050,000Active5 beds 4 baths4,267 sq. ft.
2643 Arbor Lane, Royal Palm Beach, FL 33411
MLS# B26054066Listed by: PALM BEACH PROPERTIES - New
 $549,900Active5 beds 3 baths2,677 sq. ft.
11431 Sage Meadow Terrace, Royal Palm Beach, FL 33411
MLS# B26054012Listed by: SAINT ENTERPRISES RE INVST CRP - Open Sat, 12 to 2pmNew
 $669,900Active3 beds 2 baths1,806 sq. ft.
111 Camelot Court, Royal Palm Beach, FL 33411
MLS# B26053751Listed by: VANTASURE REALTY LLC - New
 $689,900Active4 beds 3 baths2,417 sq. ft.
93 Santa Monica Avenue, Royal Palm Beach, FL 33411
MLS# B26053755Listed by: ILLUSTRATED PROPERTIES LLC (WE - Open Sat, 12 to 2pmNew
 $539,000Active3 beds 2 baths1,866 sq. ft.
134 Galiano Street, Royal Palm Beach, FL 33411
MLS# B26053467Listed by: CONTINENTAL PROPERTIES, INC. - New
 $430,000Active3 beds 3 baths1,960 sq. ft.
880 Camellia Drive, Royal Palm Beach, FL 33411
MLS# B26053204Listed by: GOOD DEAL REALTY LLC - New
 $334,900Active3 beds 2 baths1,347 sq. ft.
84 Conaskonk Circle, Royal Palm Beach, FL 33411
MLS# B26052991Listed by: KW RESERVE PALM BEACH - New
 $789,700Active4 beds 3 baths2,625 sq. ft.
118 Fernwood Crescent, Royal Palm Beach, FL 33411
MLS# B26052516Listed by: PREFERRED PROPERTIES, INC. - New
 $650,000Active4 beds 2 baths2,028 sq. ft.
139 Galiano St, Royal Palm Beach, FL 33411
MLS# A12053958Listed by: MIAMI INTERNATIONAL REALESTATE - New
 $619,900Active4 beds 2 baths1,766 sq. ft.
111 Meadow Woode Drive, Royal Palm Beach, FL 33411
MLS# B26052341Listed by: KELLER WILLIAMS REALTY - WELLI - Open Sun, 1 to 3pmNew
 $594,999Active3 beds 2 baths1,557 sq. ft.
126 Sandpiper Avenue, Royal Palm Beach, FL 33411
MLS# B26052345Listed by: BARR AGENCY REAL ESTATE - Open Sat, 11am to 1pmNew
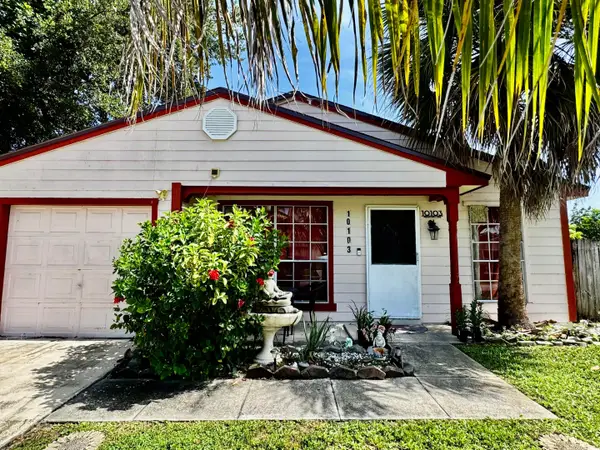 $409,999Active3 beds 2 baths1,085 sq. ft.
10103 Pinafore Lane, Royal Palm Beach, FL 33411
MLS# B26052037Listed by: DALTON WADE INC - New
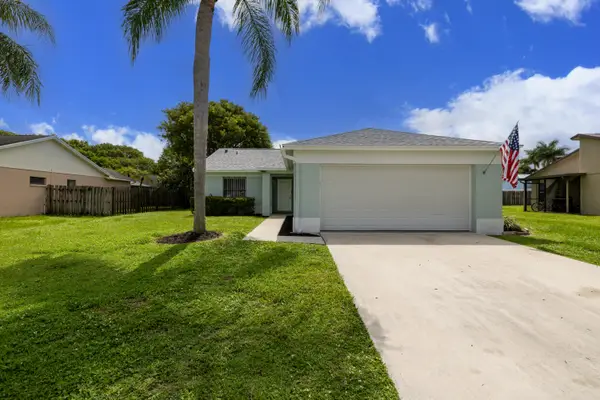 $480,000Active3 beds 2 baths1,232 sq. ft.
1322 Denlow Lane, Royal Palm Beach, FL 33411
MLS# B26050544Listed by: REDFIN CORPORATION - New
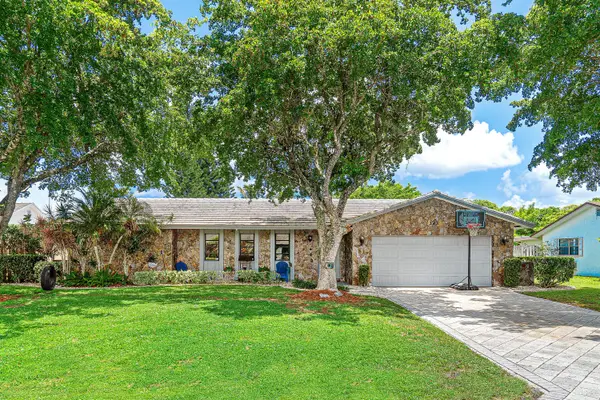 $540,000Active4 beds 2 baths1,792 sq. ft.
348 Sandpiper Avenue, Royal Palm Beach, FL 33411
MLS# B26051478Listed by: THE KEYES COMPANY - New
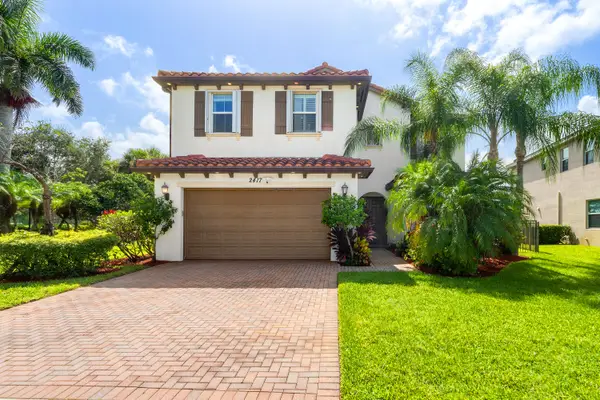 $745,000Active5 beds 5 baths2,834 sq. ft.
2417 Bellarosa Circle, Royal Palm Beach, FL 33411
MLS# B26051307Listed by: FOSTERS REALTY  $539,999Pending3 beds 2 baths1,705 sq. ft.
108 Gibraltar Street, Royal Palm Beach, FL 33411
MLS# B26050951Listed by: REALTY ONE GROUP MVP $447,500Active2 beds 2 baths816 sq. ft.
1304 Donwoods Lane, Royal Palm Beach, FL 33411
MLS# B26050540Listed by: TRUEWAY REALTY LLC $365,000Active3 beds 2 baths1,506 sq. ft.
100 Sunshine Boulevard, Royal Palm Beach, FL 33411
MLS# B26050552Listed by: HIGHLIGHT REALTY CORP/LW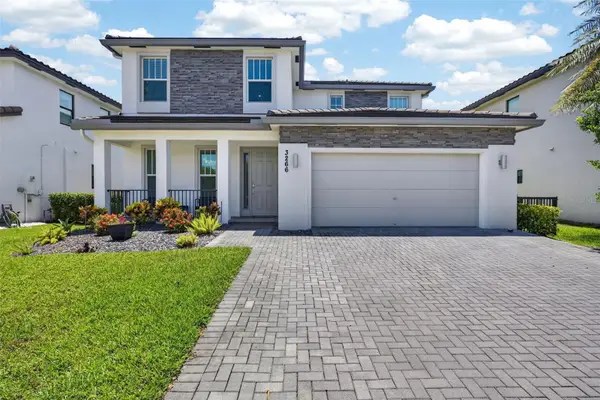 $705,000Active4 beds 3 baths2,259 sq. ft.
3266 Dunning Drive, ROYAL PALM BEACH, FL 33411
MLS# TB8526356Listed by: BHHS FLORIDA PROPERTIES GROUP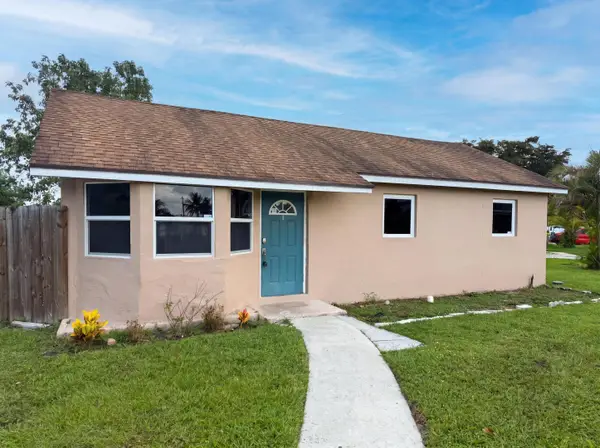 $455,000Active4 beds 2 baths1,372 sq. ft.
752 Orchid Drive, Royal Palm Beach, FL 33411
MLS# B26049656Listed by: OPENDOOR BROKERAGE LLC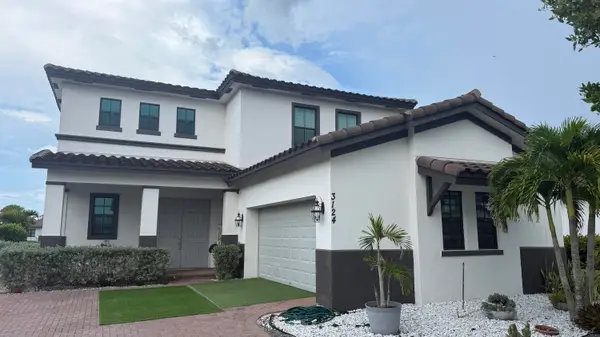 $787,900Active5 beds 3 baths2,932 sq. ft.
3124 Streng Lane, Royal Palm Beach, FL 33411
MLS# B26049370Listed by: RE/MAX GOLD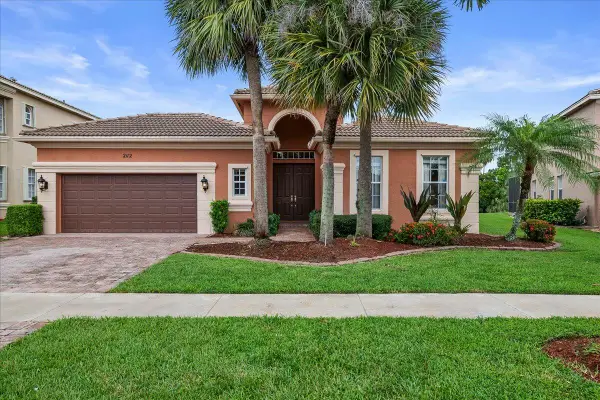 $575,000Active3 beds 2 baths2,232 sq. ft.
2112 Bellcrest Court, Royal Palm Beach, FL 33411
MLS# B26049372Listed by: KELLER WILLIAMS REALTY - WELLI $375,000Pending3 beds 2 baths1,158 sq. ft.
764 Camellia Drive, Royal Palm Beach, FL 33411
MLS# B26048854Listed by: AVANTI WAY REALTY LLC $350,000Active3 beds 2 baths1,350 sq. ft.
10 Seneca Court, Royal Palm Beach, FL 33411
MLS# B26048839Listed by: EXP REALTY LLC $495,000Active3 beds 2 baths1,758 sq. ft.
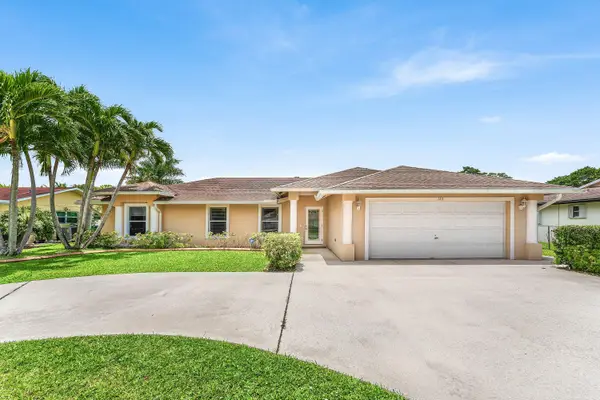
223 Bobwhite Road, Royal Palm Beach, FL 33411
MLS# B26048722Listed by: RE/MAX PRESTIGE REALTY/LW $700,000Active4 beds 2 baths2,616 sq. ft.
9377 Madewood Court, Royal Palm Beach, FL 33411
MLS# B26048564Listed by: LPT REALTY, LLC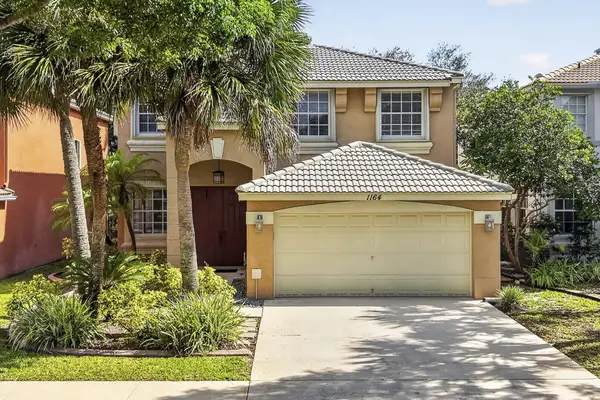 $555,000Active4 beds 3 baths2,424 sq. ft.
1164 Oakwater Drive, Royal Palm Beach, FL 33411
MLS# B26048447Listed by: THE KEYES COMPANY $561,999Active3 beds 2 baths1,659 sq. ft.
427 Las Palmas Street, Royal Palm Beach, FL 33411
MLS# B26048351Listed by: RELIANT REALTY ERA POWERED $249,900Active2 beds 2 baths1,120 sq. ft.
291 Amber Court, Royal Palm Beach, FL 33411
MLS# B26048099Listed by: KELLER WILLIAMS REALTY - WELLI $565,000Active4 beds 3 baths2,537 sq. ft.
143 Hamilton Terrace, Royal Palm Beach, FL 33414
MLS# B26048023Listed by: RE/MAX DIRECT $369,000Active3 beds 1 baths933 sq. ft.
749 Camellia Drive, Royal Palm Beach, FL 33411
MLS# B26048055Listed by: RE/MAX PRESTIGE REALTY/RPB $385,000Active2 beds 2 baths1,158 sq. ft.
10685 Bobbie Lane, Royal Palm Beach, FL 33411
MLS# B26047915Listed by: LPT REALTY, LLC $549,000Active5 beds 3 baths2,601 sq. ft.
624 Garden Cress Trail, Royal Palm Beach, FL 33411
MLS# B26047816Listed by: COMPASS FLORIDA, LLC $585,000Active4 beds 3 baths2,058 sq. ft.
149 Bellezza Terrace, Royal Palm Beach, FL 33411
MLS# B26047460Listed by: RE/MAX SERVICES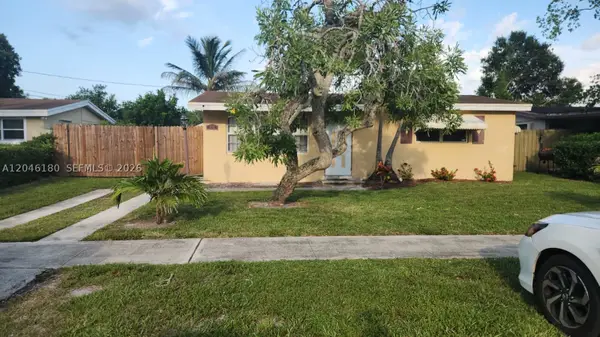 $365,000Active2 beds 1 baths885 sq. ft.
772 Gardenia Dr, Royal Palm Beach, FL 33411
MLS# A12046180Listed by: BEACHFRONT REALTY INC $700,000Active5 beds 3 baths3,564 sq. ft.
2520 Glendale Place, Royal Palm Beach, FL 33411
MLS# B26047192Listed by: FLORIDA COASTAL LIVING INC $265,000Active3 beds 2 baths1,298 sq. ft.
191 Mastic Tree Court, Royal Palm Beach, FL 33411
MLS# B26046831Listed by: EXP REALTY LLC $619,000Active4 beds 3 baths2,236 sq. ft.
397 La Mancha Avenue, Royal Palm Beach, FL 33411
MLS# B26046217Listed by: COLDWELL BANKER REALTY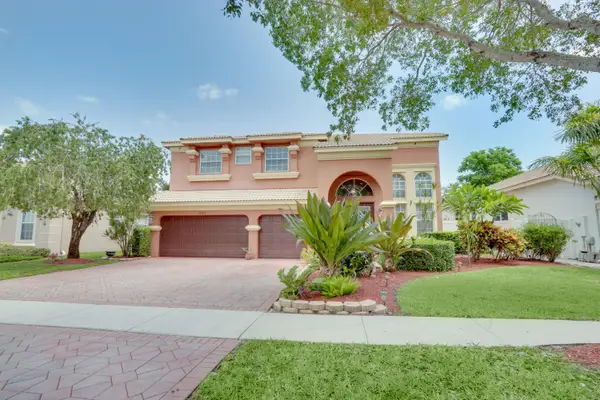 $835,000Active5 beds 3 baths3,626 sq. ft.
1773 Annandale Circle, Royal Palm Beach, FL 33411
MLS# B26045996Listed by: SELECTED HOMES REALTY LLC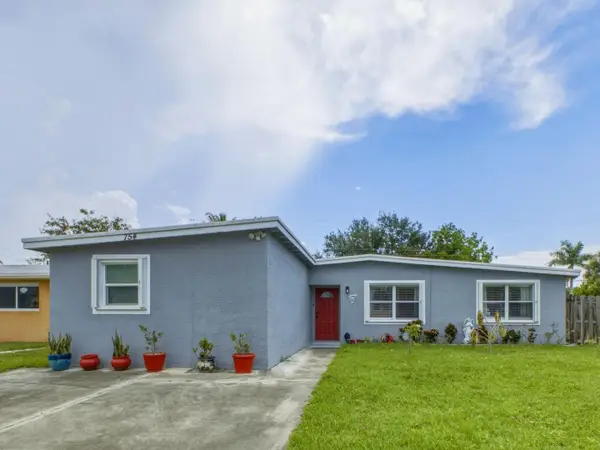 $477,000Active3 beds 2 baths1,158 sq. ft.
754 Hibiscus Drive, Royal Palm Beach, FL 33411
MLS# B26045859Listed by: MY REALTY GROUP, LLC.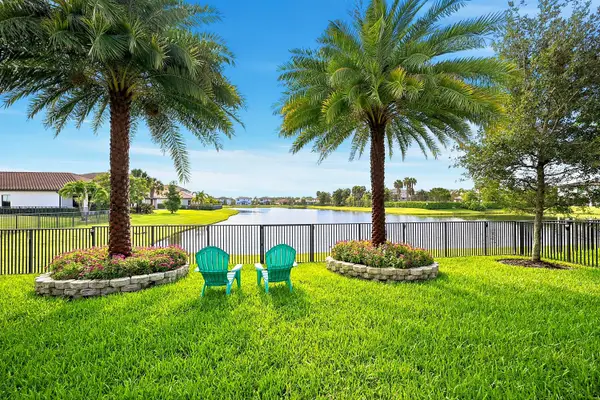 $735,000Active4 beds 3 baths2,464 sq. ft.
3322 Brinely Place, Royal Palm Beach, FL 33411
MLS# B26045442Listed by: KELLER WILLIAMS REALTY CONSULTANTS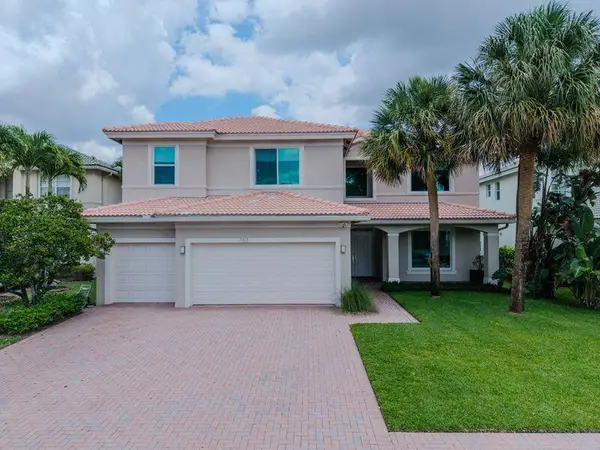 $910,000Active5 beds 4 baths3,967 sq. ft.
163 Bella Vista Way, Royal Palm Beach, FL 33411
MLS# B26045368Listed by: ATLANTIC FLORIDA PROPERTIES INC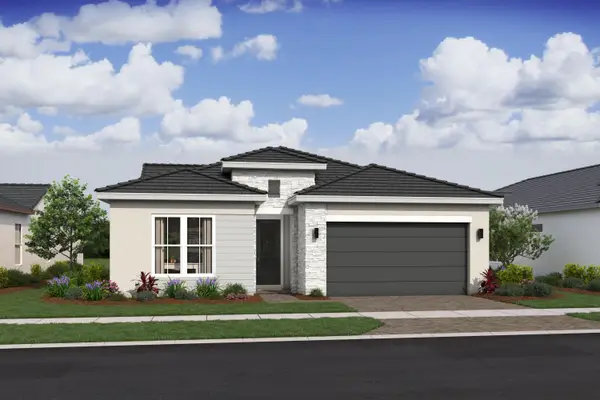 $899,995Active3 beds 3 baths2,026 sq. ft.
158 Parkside Way #11, Royal Palm Beach, FL 33414
MLS# B26045269Listed by: K HOVNANIAN FLORIDA REALTY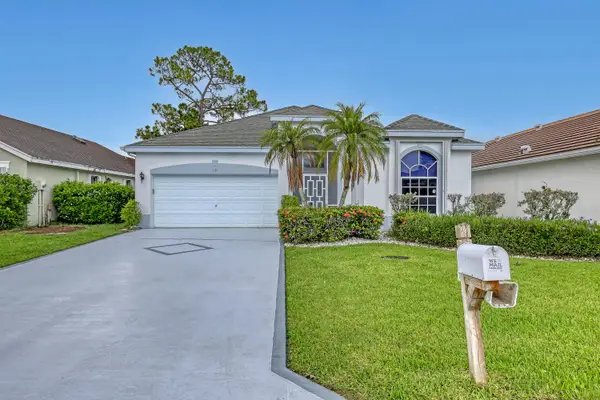 $489,900Active3 beds 2 baths1,629 sq. ft.
101 Meadowlands Drive, Royal Palm Beach, FL 33411
MLS# B26045130Listed by: COLDWELL BANKER REALTY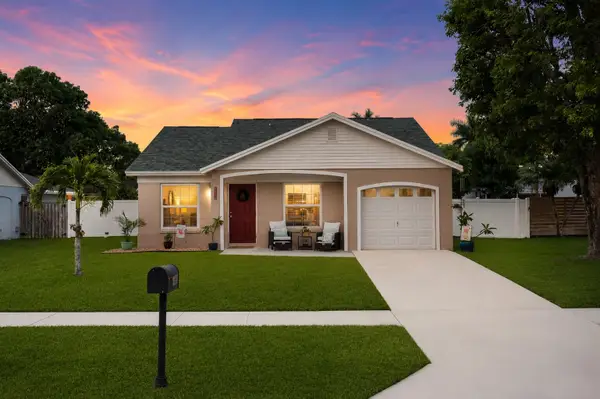 $489,000Active3 beds 2 baths1,158 sq. ft.
1450 Denlow Lane, Royal Palm Beach, FL 33411
MLS# B26044758Listed by: UNITED REALTY GROUP, INC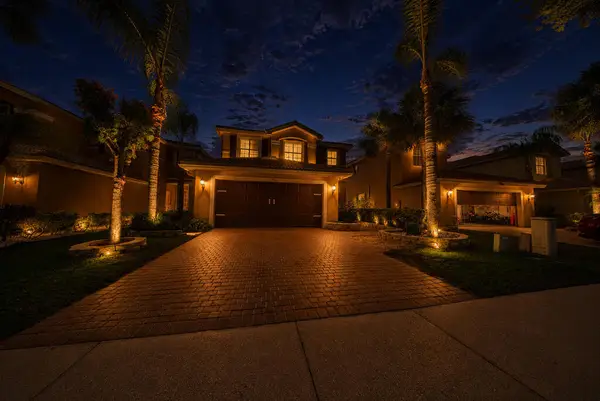 $599,000Active4 beds 3 baths2,008 sq. ft.
11436 Blue Violet Lane, Royal Palm Beach, FL 33411
MLS# B26044604Listed by: EXIT REALTY PREMIER ELITE $499,000Pending3 beds 2 baths1,882 sq. ft.
1132 Concert Way, Royal Palm Beach, FL 33411
MLS# B26043919Listed by: RE/MAX OCEAN PROPERTIES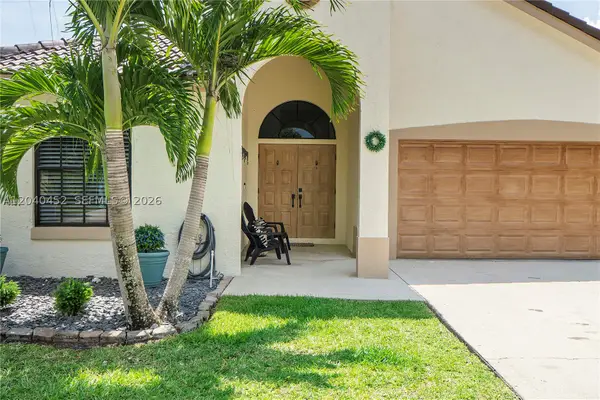 $525,000Active3 beds 2 baths1,422 sq. ft.
124 Preserve Dr, Royal Palm Beach, FL 33411
MLS# A12040452Listed by: BLUE REALTY OF PALM BEACH, LLC. $339,900Active3 beds 2 baths1,448 sq. ft.
148 Village Walk Drive #24, Royal Palm Beach, FL 33411
MLS# B26043326Listed by: HOME FREE TODAY REALTY $899,000Active7 beds 4 baths4,068 sq. ft.
198 Sparrow Drive, Royal Palm Beach, FL 33411
MLS# B26043190Listed by: HOT TEAM REALTY & INVESTMT SRV $529,000Active4 beds 2 baths1,605 sq. ft.
120 Swan Parkway W, Royal Palm Beach, FL 33411
MLS# B26043060Listed by: DOWNING STREET REALTY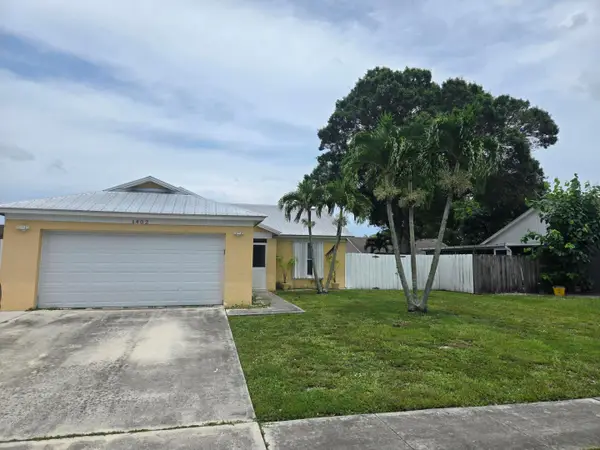 $524,900Active3 beds 2 baths1,232 sq. ft.
1402 Denlow Lane, Royal Palm Beach, FL 33411
MLS# B26042965Listed by: PALM BEACH REAL ESTATE SERVICES LLC $395,000Pending3 beds 2 baths1,636 sq. ft.
180 Par Drive, Royal Palm Beach, FL 33411
MLS# B26042815Listed by: EXP REALTY LLC $450,000Pending3 beds 2 baths1,832 sq. ft.
264 Las Palmas Street, Royal Palm Beach, FL 33411
MLS# B26042704Listed by: LEIBOWITZ REALTY GROUP, LLC./PBG $535,000Active3 beds 2 baths1,549 sq. ft.
117 Sherwood Drive, Royal Palm Beach, FL 33411
MLS# B26042397Listed by: SERHANT $750,000Active4 beds 3 baths2,936 sq. ft.
2035 Reston Circle, Royal Palm Beach, FL 33411
MLS# B26041465Listed by: THE KEYES COMPANY $915,765Active5 beds 4 baths2,899 sq. ft.
146 Parkside Way #12, Royal Palm Beach, FL 33414
MLS# B26041418Listed by: K HOVNANIAN FLORIDA REALTY $996,705Active5 beds 4 baths3,256 sq. ft.
154 Parkside Way #14, Royal Palm Beach, FL 33414
MLS# B26041435Listed by: K HOVNANIAN FLORIDA REALTY $496,000Pending4 beds 2 baths1,496 sq. ft.
1108 Sonata Way, Royal Palm Beach, FL 33411
MLS# B26040082Listed by: DOUGLAS ELLIMAN WELLINGTON $449,900Active2 beds 2 baths1,625 sq. ft.
132 Van Gogh Cove, BRADENTON, FL 34212
MLS# A4696677Listed by: ANCHOR DOWN REAL ESTATE $265,000Active3 beds 2 baths1,298 sq. ft.
325 Pennington Court, Royal Palm Beach, FL 33411
MLS# B26040136Listed by: KELLER WILLIAMS REALTY - WELLI $535,000Active3 beds 2 baths1,785 sq. ft.
106 Venetian Lane, Royal Palm Beach, FL 33411
MLS# B26039469Listed by: NICKLAUS VANCE $739,000Active4 beds 3 baths2,873 sq. ft.
2060 Reston Circle, Royal Palm Beach, FL 33411
MLS# B26039345Listed by: RE/MAX DIRECT $675,000Active5 beds 3 baths2,700 sq. ft.
127 Miramar Avenue, Royal Palm Beach, FL 33411
MLS# B26039100Listed by: RE/MAX DIRECT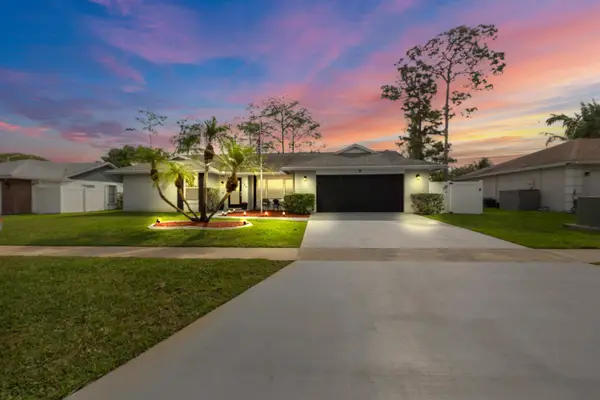 $564,900Pending3 beds 2 baths1,752 sq. ft.
125 Parkwood Drive, Royal Palm Beach, FL 33411
MLS# B26010075Listed by: RE/MAX PRESTIGE REALTY/WELLINGTON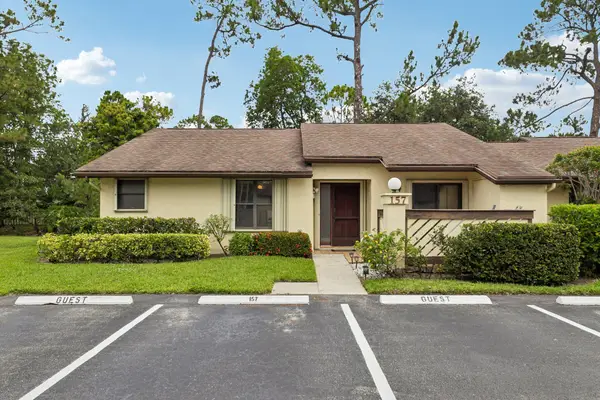 $239,999Active3 beds 2 baths1,298 sq. ft.
157 Pinto Palm Court, Royal Palm Beach, FL 33411
MLS# B26038687Listed by: UNITED REALTY GROUP INC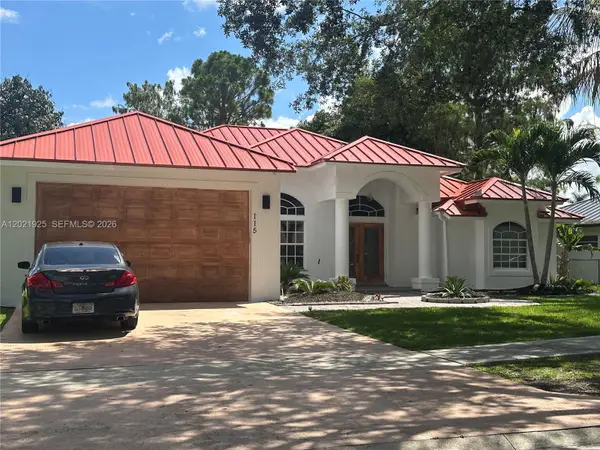 $615,000Active3 beds 2 baths1,708 sq. ft.
115 Kapok Crescent, Royal Palm Beach, FL 33411
MLS# A12021925Listed by: DALTON WADE INC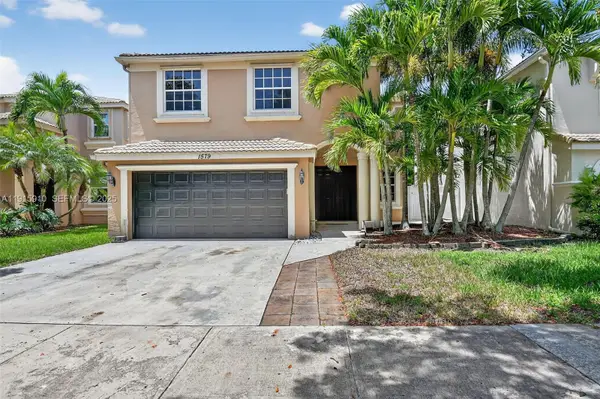 $559,000Active5 beds 3 baths2,693 sq. ft.
1579 Briar Oak Drive, Royal Palm Beach, FL 33411
MLS# A11915910Listed by: COMPASS FLORIDA, LLC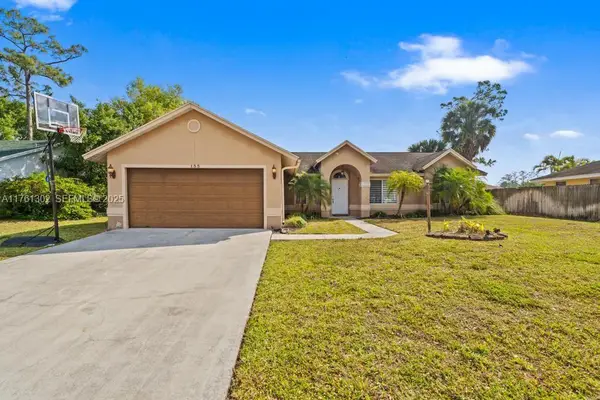 $575,000Active3 beds 2 baths1,589 sq. ft.
155 Kings Way, Royal Palm Beach, FL 33411
MLS# A11761302Listed by: REALTY ONE GROUP EVOLUTION $729,999Active5 beds 4 baths3,401 sq. ft.
140 Bellezza Terrace, Royal Palm Beach, FL 33411
MLS# B26038585Listed by: RE/MAX DIRECT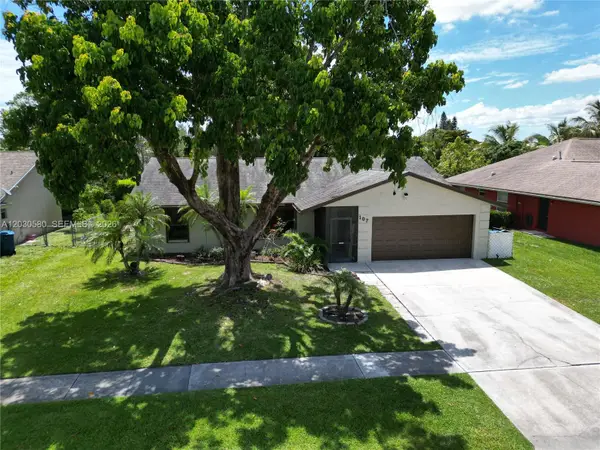 $545,000Active3 beds 2 baths1,546 sq. ft.
107 Starling Ave, Royal Palm Beach, FL 33411
MLS# A12030580Listed by: SEARCH BROWARD REAL ESTATE $580,000Active4 beds 3 baths2,038 sq. ft.
140 Bilbao Street, Royal Palm Beach, FL 33411
MLS# B26038274Listed by: KW RESERVE PALM BEACH $814,000Active5 beds 3 baths3,017 sq. ft.
9386 Madewood Court, Royal Palm Beach, FL 33411
MLS# B26037850Listed by: COLDWELL BANKER REALTY $575,000Active5 beds 3 baths2,693 sq. ft.
1327 Isleworth Court, Royal Palm Beach, FL 33411
MLS# B26037854Listed by: ATLANTIC FLORIDA PROPERTIES INC $425,000Active3 beds 2 baths1,460 sq. ft.
113 Cordoba Circle, Royal Palm Beach, FL 33411
MLS# B26037382Listed by: COMPASS FLORIDA LLC $625,000Active3 beds 2 baths2,088 sq. ft.
2404 Bellarosa Circle, Royal Palm Beach, FL 33411
MLS# B26037203Listed by: BERKSHIRE HATHAWAY FLORIDA REALTY $310,000Active2 beds 2 baths1,347 sq. ft.
55 Seminole Drive, ROYAL PALM BEACH, FL 33411
MLS# O6413904Listed by: OMNIONE REALTY GROUP, INC. $669,000Active4 beds 3 baths2,259 sq. ft.
3265 Dunning Dr, Royal Palm Beach, FL 33411
MLS# A12031169Listed by: MACKEN REALTY INC $598,000Active5 beds 3 baths2,677 sq. ft.
11487 Blue Violet Lane, Royal Palm Beach, FL 33411
MLS# B26036663Listed by: PARTNERSHIP REALTY INC.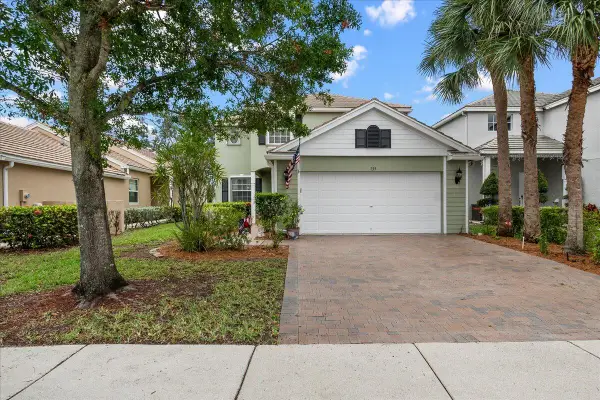 $585,000Active4 beds 3 baths2,537 sq. ft.
135 Hamilton Terrace, West Palm Beach, FL 33414
MLS# B26036654Listed by: KELLER WILLIAMS REALTY - WELLI $995,000Active5 beds 4 baths4,267 sq. ft.
1831 Waldorf Drive, Royal Palm Beach, FL 33411
MLS# B26036421Listed by: B2B REALTY LLC $400,000Pending3 beds 2 baths1,020 sq. ft.
10150 Yeoman Lane, Royal Palm Beach, FL 33411
MLS# B26036458Listed by: PREFERRED SHORE LLC $777,999Active4 beds 3 baths3,496 sq. ft.
2285 Ridgewood Circle, Royal Palm Beach, FL 33411
MLS# B26036264Listed by: HIGHLIGHT REALTY CORP/LW $615,000Active3 beds 2 baths2,153 sq. ft.
100 Greenwood Court, Royal Palm Beach, FL 33411
MLS# B26036302Listed by: RELIANT REALTY ERA POWERED $644,000Active3 beds 2 baths1,891 sq. ft.
3011 Strada Court, Royal Palm Beach, FL 33411
MLS# B26035612Listed by: LISETTE CAMINO $624,900Active3 beds 3 baths2,046 sq. ft.
2886 Bellarosa Circle, Royal Palm Beach, FL 33411
MLS# B26035517Listed by: REAL BROKER, LLC $624,999Active3 beds 2 baths2,251 sq. ft.
310 Venice Boulevard, Royal Palm Beach, FL 33411
MLS# B26035121Listed by: KELLER WILLIAMS REALTY - WELLI $539,999Active3 beds 3 baths1,671 sq. ft.
102 E Royal Pine Cir, Royal Palm Beach, FL 33411
MLS# B26034859Listed by: KEYES CO $739,900Active5 beds 3 baths3,024 sq. ft.
2392 Bellarosa Circle, Royal Palm Beach, FL 33411
MLS# B26034643Listed by: COLDWELL BANKER REALTY $499,000Active4 beds 2 baths1,851 sq. ft.
104 W Swan Pkwy Parkway W, Royal Palm Beach, FL 33411
MLS# B26034416Listed by: REALTY ONE GROUP INNOVATION $535,000Active3 beds 2 baths1,498 sq. ft.
98 Pintail Court, Royal Palm Beach, FL 33411
MLS# B26034127Listed by: KELLER WILLIAMS REALTY JUPITER $754,000Active4 beds 3 baths2,686 sq. ft.
106 Segovia Court, Royal Palm Beach, FL 33411
MLS# B26033994Listed by: COLDWELL BANKER REALTY $520,000Pending3 beds 2 baths1,494 sq. ft.
112 Laurel Way, Royal Palm Beach, FL 33411
MLS# B26033846Listed by: KW RESERVE PALM BEACH $990,000Active5 beds 4 baths3,894 sq. ft.
9334 Madewood Court, Royal Palm Beach, FL 33411
MLS# B26033728Listed by: HIGH CLASS REALTY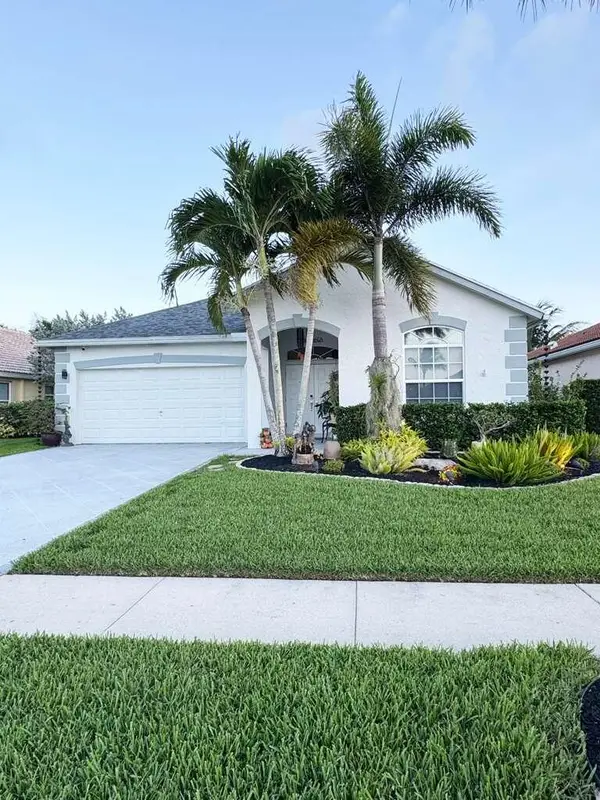 $530,000Pending3 beds 2 baths1,610 sq. ft.
109 Derby Lane, Royal Palm Beach, FL 33411
MLS# B26033715Listed by: LOKATION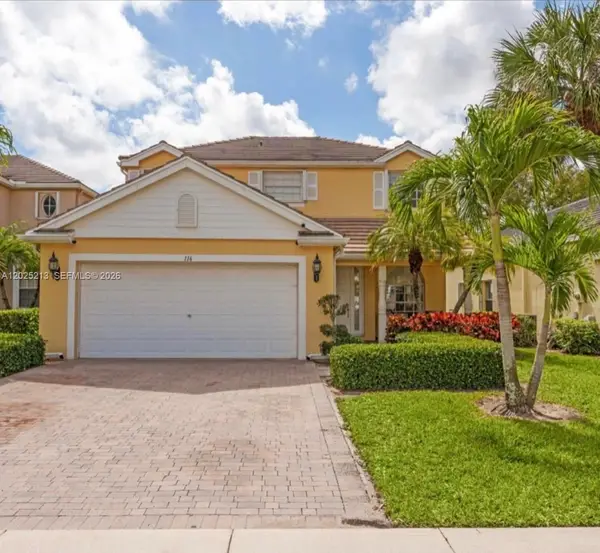 $540,000Active4 beds 3 baths2,204 sq. ft.
116 Berenger Walk, Royal Palm Beach, FL 33414
MLS# A12025213Listed by: LONDON FOSTER REALTY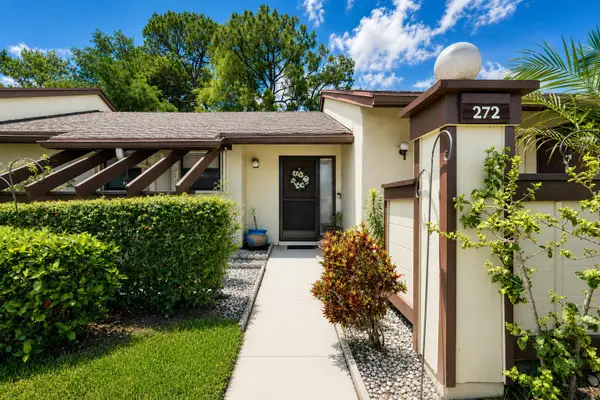 $225,000Active2 beds 2 baths1,120 sq. ft.
272 Beaver Dam Court, Royal Palm Beach, FL 33411
MLS# B26032775Listed by: LANG REALTY - BOYNTON BEACH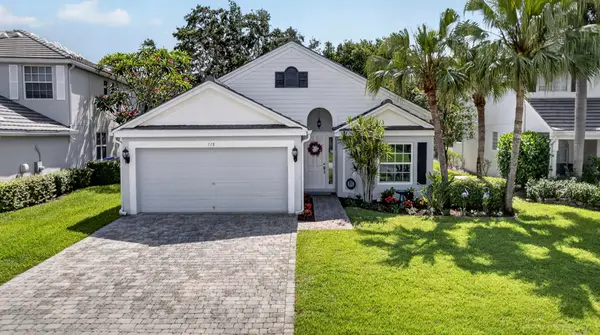 $499,000Active3 beds 3 baths1,613 sq. ft.
118 Kensington Way, Royal Palm Beach, FL 33414
MLS# B26032722Listed by: RE/MAX PRESTIGE REALTY/WELLINGTON $665,000Active4 beds 2 baths2,616 sq. ft.
8948 New Hope Court, Royal Palm Beach, FL 33411
MLS# R11161665Listed by: ZHEMUKHOVA $589,000Active4 beds 3 baths2,262 sq. ft.
214 Berenger Walk, Royal Palm Beach, FL 33414
MLS# B26032190Listed by: THE CORCORAN GROUP $625,000Active4 beds 3 baths2,287 sq. ft.
2101 Belcara Court, West Palm Beach, FL 33411
MLS# B26031732Listed by: KELLER WILLIAMS REALTY - WELLI $225,000Active2 beds 2 baths1,523 sq. ft.
154 Ramblewood Circle, Royal Palm Beach, FL 33411
MLS# B26031344Listed by: ECHO FINE PROPERTIES $499,000Active3 beds 2 baths1,085 sq. ft.
10117 Mikado Lane, Royal Palm Beach, FL 33411
MLS# B26031346Listed by: TREASURE PROPERTY GROUP LLC $525,000Active3 beds 2 baths1,708 sq. ft.
105 Monterey Way, Royal Palm Beach, FL 33411
MLS# B26030945Listed by: VLASEK REAL ESTATE GROUP $739,000Active4 beds 3 baths3,065 sq. ft.
3179 Streng Lane, Royal Palm Beach, FL 33411
MLS# B26030786Listed by: BLUE VIEW REAL ESTATE $449,650Active7 beds 8 baths
00 West Palm Gardens, Brumalia, Mandeville,jamaica, Manchester,
MLS# A11918733Listed by: PRA AND COMPANY REALTORS $479,900Pending3 beds 2 baths1,317 sq. ft.
10079 Yeoman Lane, Royal Palm Beach, FL 33411
MLS# B26030642Listed by: HOME EXPRESS REALTY INC $605,000Active5 beds 3 baths1,960 sq. ft.
103 Prado Street, Royal Palm Beach, FL 33411
MLS# B26030164Listed by: COMPASS FLORIDA LLC- Open Thu, 9am to 7pm
 $500,000Pending3 beds 3 baths1,622 sq. ft.
118 Waterway, Royal Palm Beach, FL 33411
MLS# B26029203Listed by: OPENDOOR BROKERAGE LLC  $1,150,000Active5 beds 3 baths3,496 sq. ft.
2214 Ridgewood Circle, Royal Palm Beach, FL 33411
MLS# B26029611Listed by: THE KEYES COMPANY $228,500Active2 beds 2 baths1,120 sq. ft.
238 Bald Eagle Court, Royal Palm Beach, FL 33411
MLS# B26027803Listed by: EXP REALTY LLC $540,000Pending3 beds 2 baths1,793 sq. ft.
160 Royal Pine Circle S, Royal Palm Beach, FL 33411
MLS# B26025855Listed by: KELLER WILLIAMS REALTY BOCA RATON $495,000Active3 beds 2 baths1,629 sq. ft.
113 Saratoga Blvd Boulevard E, Royal Palm Beach, FL 33411
MLS# B26025527Listed by: EXP REALTY LLC $535,000Active3 beds 2 baths1,408 sq. ft.
144 Bilbao Street, Royal Palm Beach, FL 33411
MLS# B26025417Listed by: KELLER WILLIAMS REALTY OF THE TREASURE COAST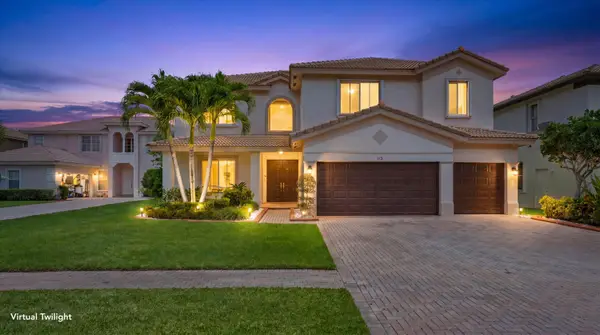 $825,000Active5 beds 4 baths3,967 sq. ft.
112 Ibisca Terrace, Royal Palm Beach, FL 33411
MLS# B26024461Listed by: CONCIERGE PROPERTIES LLC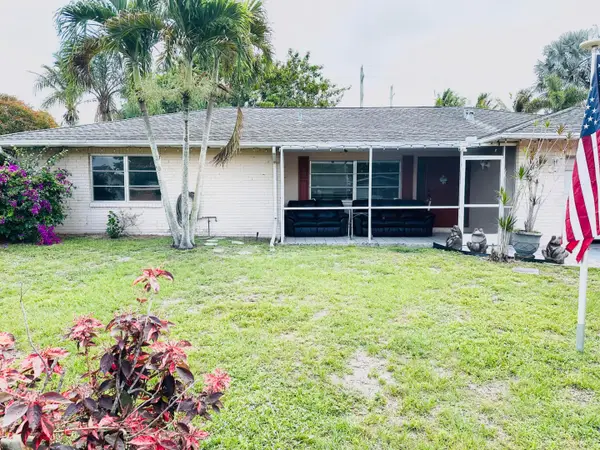 $425,000Active2 beds 2 baths1,446 sq. ft.
234 Sandpiper Avenue, Royal Palm Beach, FL 33411
MLS# B26024521Listed by: TRIPLE CROWN PROPERTIES $574,900Active3 beds 2 baths1,401 sq. ft.
109 Gibraltar Street, Royal Palm Beach, FL 33411
MLS# B26022200Listed by: RELIANT REALTY ERA POWERED $1,066,065Active5 beds 5 baths3,684 sq. ft.
113 Parkside Way #99, Royal Palm Beach, FL 33414
MLS# B26021577Listed by: K HOVNANIAN FLORIDA REALTY $945,035Active4 beds 3 baths2,796 sq. ft.
138 Parkside Way #10, Royal Palm Beach, FL 33414
MLS# B26021571Listed by: K HOVNANIAN FLORIDA REALTY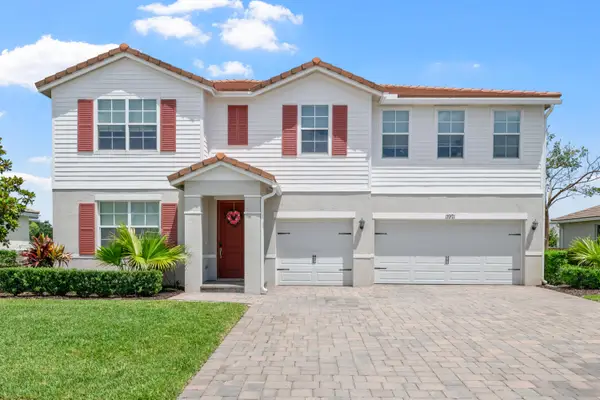 $819,900Active5 beds 4 baths3,784 sq. ft.
11971 Cypress Key Way, Royal Palm Beach, FL 33411
MLS# B26020800Listed by: PREMIER BROKERS INTERNATIONAL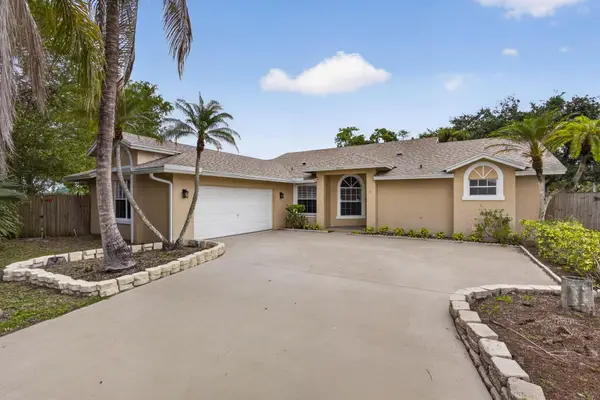 $675,985Active3 beds 2 baths2,000 sq. ft.
103 Oxford Court, Royal Palm Beach, FL 33411
MLS# B26019971Listed by: SWIFT REAL ESTATE SERVICES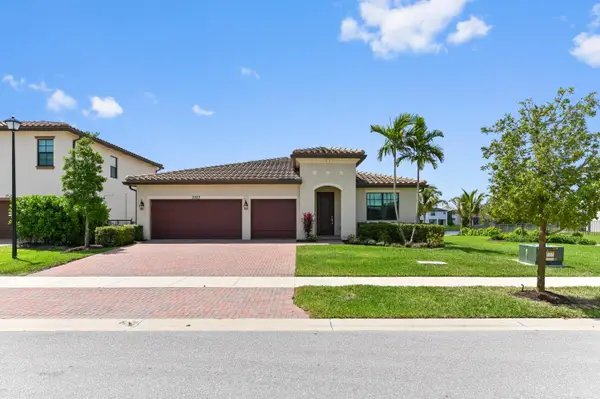 $719,900Active5 beds 2 baths2,300 sq. ft.
3523 Haldin Place, Royal Palm Beach, FL 33411
MLS# B26019980Listed by: KW RESERVE PALM BEACH $499,999Active3 beds 2 baths1,289 sq. ft.
762 Gardenia Drive, Royal Palm Beach, FL 33411
MLS# B26019551Listed by: LPT REALTY, LLC $623,900Active3 beds 3 baths2,400 sq. ft.
2215 Arterra Court, Royal Palm Beach, FL 33411
MLS# B26018869Listed by: WEICHERT, REALTORS - TRUE QUALITY SERVICE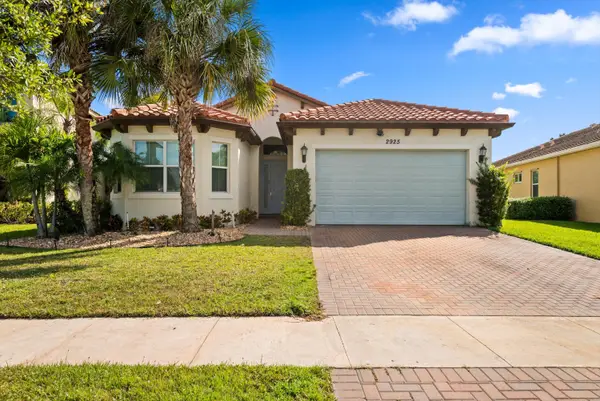 $640,000Active3 beds 3 baths2,287 sq. ft.
2925 Bellarosa Circle, Royal Palm Beach, FL 33411
MLS# B26017196Listed by: RH REALTY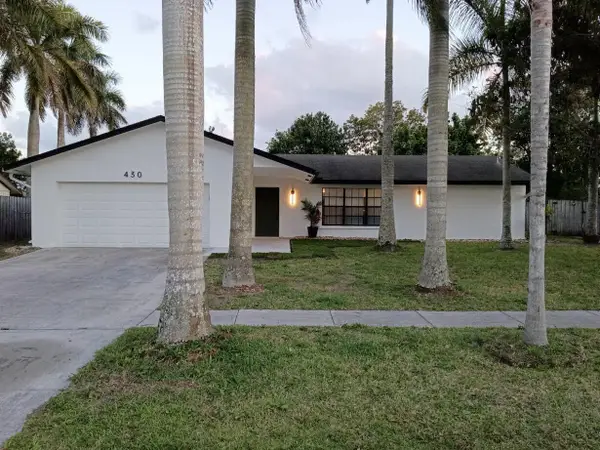 $585,000Active3 beds 2 baths1,699 sq. ft.
430 La Mancha Avenue, Royal Palm Beach, FL 33411
MLS# B26016538Listed by: PARTNERSHIP REALTY INC. $809,000Active4 beds 3 baths2,727 sq. ft.
2903 Fontana Lane, Royal Palm Beach, FL 33411
MLS# B26015848Listed by: LUX BROKERAGE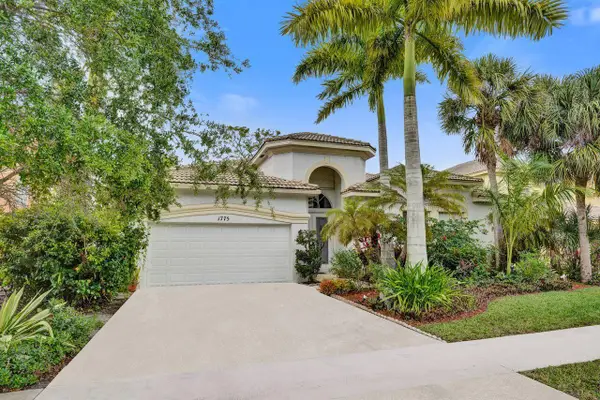 $614,500Active4 beds 3 baths2,471 sq. ft.
1775 Annandale Circle, Royal Palm Beach, FL 33411
MLS# B26014567Listed by: COLDWELL BANKER REALTY $254,000Active2 beds 2 baths1,295 sq. ft.
178 Ramblewood Circle, Royal Palm Beach, FL 33411
MLS# B26013659Listed by: REALTY ONE GROUP INNOVATION $632,000Active5 beds 3 baths2,778 sq. ft.
2430 Westmont Drive, Royal Palm Beach, FL 33411
MLS# B26013039Listed by: REAL BROKER, LLC $420,000Active4 beds 2 baths1,464 sq. ft.
121 Prestige Drive, Royal Palm Beach, FL 33411
MLS# B26012494Listed by: BLUE LIGHTHOUSE REALTY, INC $478,000Active3 beds 2 baths1,812 sq. ft.
112 Lancaster Way, Royal Palm Beach, FL 33414
MLS# B26010979Listed by: EXP REALTY LLC $650,000Active4 beds 3 baths2,831 sq. ft.
2462 Westmont Place, Royal Palm Beach, FL 33411
MLS# B26010156Listed by: COMPASS FLORIDA LLC $564,900Pending3 beds 2 baths1,752 sq. ft.
125 Parkwood Drive, Royal Palm Beach, FL 33411
MLS# B26010075Listed by: RE/MAX PRESTIGE REALTY/WELLINGTON $560,000Active2 beds 2 baths1,360 sq. ft.
324 Sandpiper Avenue, Royal Palm Beach, FL 33411
MLS# B26009948Listed by: ONE SOTHEBY'S INTERNATIONAL RE $619,000Active3 beds 2 baths2,058 sq. ft.
167 Ponce De Leon Street, Royal Palm Beach, FL 33411
MLS# B26009860Listed by: PREMIER LISTINGS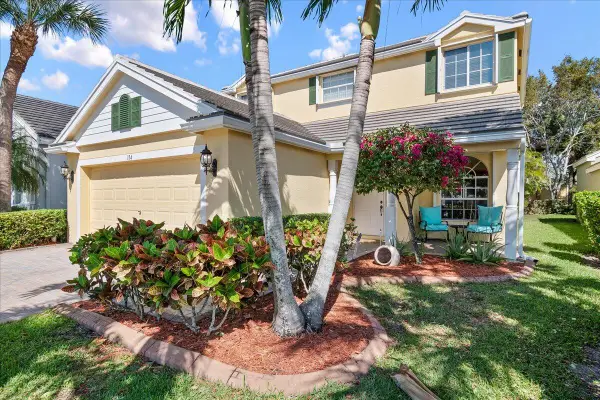 $599,900Active4 beds 3 baths2,267 sq. ft.
114 Lancaster Way, Royal Palm Beach, FL 33414
MLS# B26009294Listed by: KELLER WILLIAMS REALTY - WELLI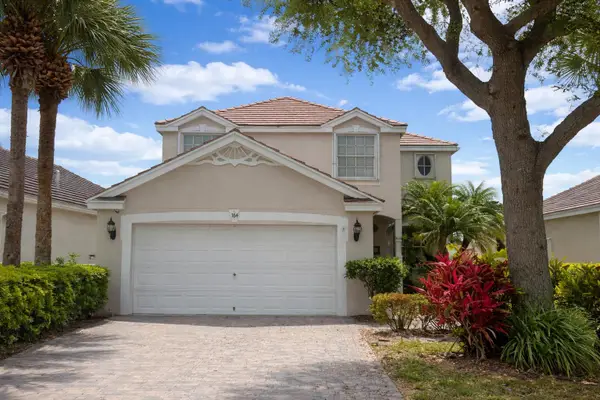 $615,000Active4 beds 3 baths2,478 sq. ft.
164 Berenger Walk, Royal Palm Beach, FL 33414
MLS# B26007936Listed by: UNITED REALTY GROUP, INC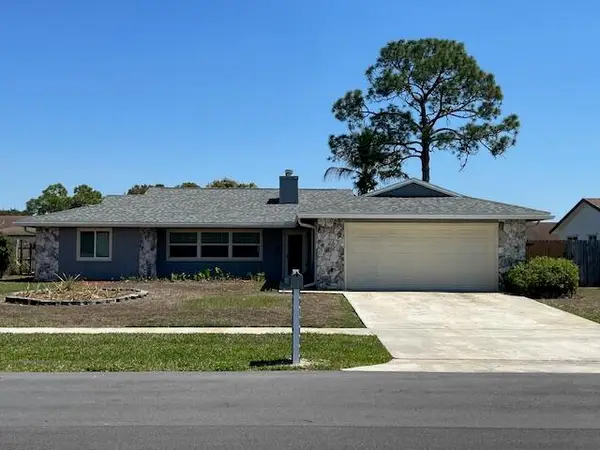 $529,900Active3 beds 2 baths1,419 sq. ft.
414 Las Palmas Street, Royal Palm Beach, FL 33411
MLS# B26007280Listed by: RE/MAX PRESTIGE REALTY/WELLINGTON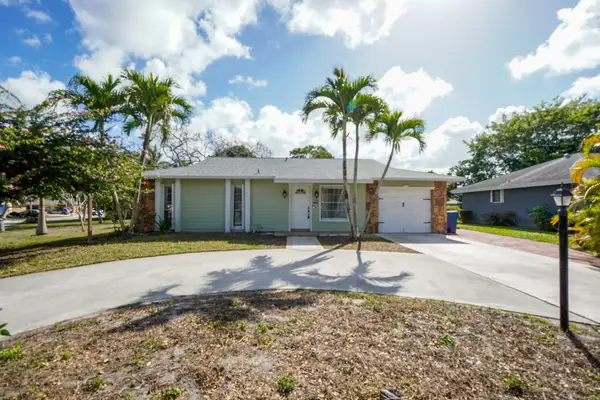 $534,000Active4 beds 2 baths1,605 sq. ft.
120 W Swan Pkwy W, Royal Palm Beach, FL 33411
MLS# B26006547Listed by: DOWNING STREET REALTY $270,000Active3 beds 2 baths1,120 sq. ft.
499 Iron Forge Court, Royal Palm Beach, FL 33411
MLS# B26003999Listed by: SUBARAN'S INT'L REALTY $699,900Active5 beds 3 baths2,778 sq. ft.
2015 Reston Circle, Royal Palm Beach, FL 33411
MLS# B26001105Listed by: LOSEE REAL ESTATE GROUP $254,700Active3 beds 2 baths1,686 sq. ft.
108 Village Walk Drive, Royal Palm Beach, FL 33411
MLS# B26000003Listed by: CGI REALTY $584,900Active3 beds 2 baths2,418 sq. ft.
129 Bilbao Street, Royal Palm Beach, FL 33411
MLS# R11169530Listed by: HOME FREE TODAY REALTY $849,995Pending3 beds 3 baths2,026 sq. ft.
142 Parkside Way #11, Royal Palm Beach, FL 33414
MLS# R11167892Listed by: K HOVNANIAN FLORIDA REALTY $1,064,795Pending5 beds 5 baths3,684 sq. ft.
150 Parkside Way #13, Royal Palm Beach, FL 33414
MLS# R11167894Listed by: K HOVNANIAN FLORIDA REALTY $849,000Active5 beds 3 baths2,875 sq. ft.
1325 Whitcombe Drive, Royal Palm Beach, FL 33411
MLS# R11167836Listed by: IJL REAL ESTATE GROUP LLC $469,900Active3 beds 3 baths1,613 sq. ft.
120 Hamilton Terrace, Royal Palm Beach, FL 33414
MLS# F10549457Listed by: TRANS GLOBAL REALTY, INC. $211,000Active3 beds 2 baths1,298 sq. ft.
248 Brandywine Court, Royal Palm Beach, FL 33411
MLS# R11114624Listed by: COMPASS FLORIDA LLC $310,000Active3 beds 2 baths1,686 sq. ft.
139 Meander Circle, Royal Palm Beach, FL 33411
MLS# R11115343Listed by: DONOHUE REAL ESTATE, LLC $649,000Active3 beds 3 baths2,046 sq. ft.
2849 Bellarosa Circle, Royal Palm Beach, FL 33411
MLS# R11138083Listed by: REALTY CONNECTION LINK LLC $520,000Active3 beds 2 baths1,812 sq. ft.
159 Berenger Walk, Royal Palm Beach, FL 33414
MLS# R11162397Listed by: FREEDOM REALTY OF AMERICA, LLC $589,900Active3 beds 2 baths1,766 sq. ft.
102 Brook Woode Court, Royal Palm Beach, FL 33411
MLS# R11164048Listed by: PREMIER BROKERS INTERNATIONAL $465,000Active3 beds 2 baths2,081 sq. ft.
2431 Westmont Drive, Royal Palm Beach, FL 33411
MLS# R11164604Listed by: LOKATION $589,000Active3 beds 2 baths1,650 sq. ft.
146 Fernwood Crescent, Royal Palm Beach, FL 33411
MLS# R11165529Listed by: SWIFT REAL ESTATE SERVICES
 $719,990Active5 beds 3 baths3,496 sq. ft.
2236 Ridgewood Circle, Royal Palm Beach, FL 33411
MLS# R11166132Listed by: CENTURY 21 TENACE REALTY $170,000Active2 beds 2 baths1,112 sq. ft.
64 Macadamia Court, Royal Palm Beach, FL 33411
MLS# F10545478Listed by: UNITED REALTY GROUP INC. $339,900Active3 beds 2 baths1,676 sq. ft.
115 Ramblewood Circle, Royal Palm Beach, FL 33411
MLS# R11116503Listed by: LISETTE CAMINO $699,000Active4 beds 3 baths2,558 sq. ft.
120 Saratoga Boulevard W, Royal Palm Beach, FL 33411
MLS# R11158597Listed by: ELITE VISION REALTY LLC $300,000Active3 beds 2 baths1,686 sq. ft.
135 Meander Circle, Royal Palm Beach, FL 33411
MLS# R11150666Listed by: REGENCY PROPERTY ASSET MGMT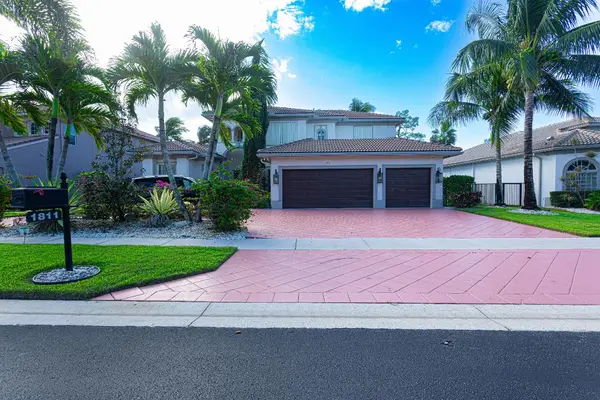 $920,000Active5 beds 4 baths3,390 sq. ft.
1811 Waldorf Drive, Royal Palm Beach, FL 33411
MLS# R11152880Listed by: PARTNERSHIP REALTY INC. $545,500Pending4 beds 3 baths1,599 sq. ft.
849 Camellia Drive, Royal Palm Beach, FL 33411
MLS# R11157463Listed by: VOLANTE REALTY GROUP LLC $669,000Active3 beds 3 baths2,253 sq. ft.
3144 Streng Lane, Royal Palm Beach, FL 33411
MLS# R11157630Listed by: ASSURED REALTY OF FLORIDA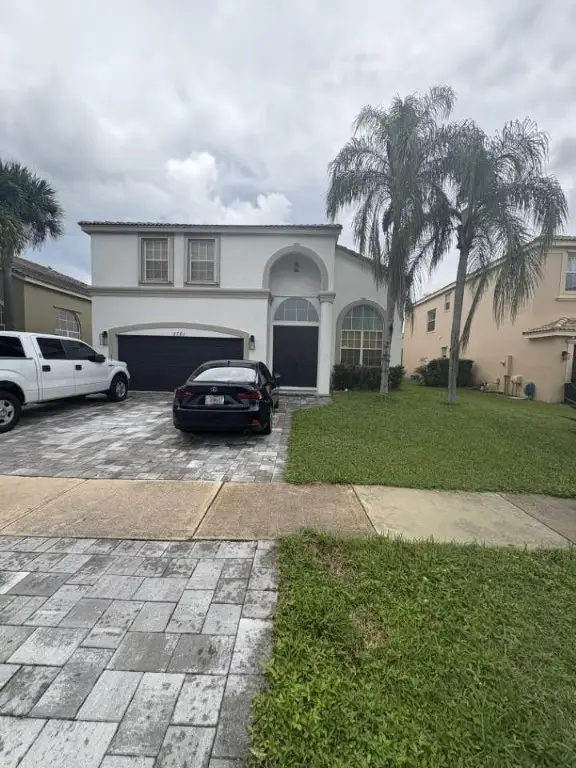 $629,000Active4 beds 3 baths2,936 sq. ft.
2761 Misty Oaks Circle, Royal Palm Beach, FL 33411
MLS# F10532132Listed by: LOKATION $304,000Active3 beds 2 baths1,448 sq. ft.
125 Ramblewood Circle, Royal Palm Beach, FL 33411
MLS# R11147047Listed by: LAER REALTY PARTNERS BOWEN/WELLINGTON $430,000Active3 beds 3 baths1,714 sq. ft.
11434 Silk Carnation Way, Royal Palm Beach, FL 33411
MLS# R11156927Listed by: HIGHLIGHT REALTY CORP/LW $589,900Active4 beds 2 baths2,023 sq. ft.
112 Cocoplum Circle, Royal Palm Beach, FL 33411
MLS# R11155711Listed by: STANDARD REALTY GROUP LLC $640,000Active3 beds 2 baths1,970 sq. ft.
132 Chestnut Circle, ROYAL PALM BEACH, FL 33411
MLS# S5140503Listed by: NAIM REAL ESTATE LLC $306,900Active3 beds 2 baths1,279 sq. ft.
3 Aspen At Bella Terra, Imperial, MO 63010
MLS# 25081374Listed by: LISTWITHFREEDOM.COM INC $250,000Pending4 beds 2 baths1,740 sq. ft.
158 Alcazar Street, Royal Palm Beach, FL 33411
MLS# 1061978Listed by: UNITED REALTY GROUP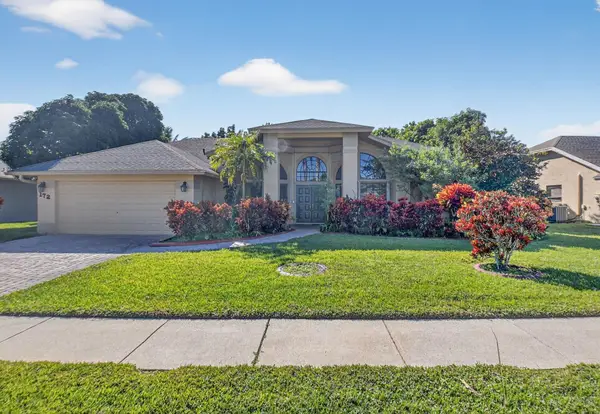 $595,000Active3 beds 2 baths2,037 sq. ft.
172 Monterey Way, Royal Palm Beach, FL 33411
MLS# R11140624Listed by: COLDWELL BANKER REALTY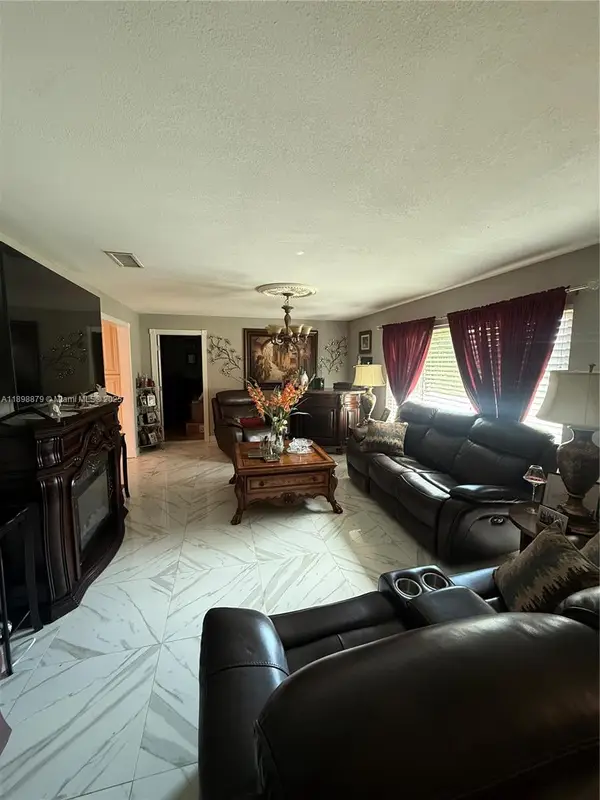 $590,000Active4 beds 2 baths1,912 sq. ft.
126 Sunflower Cir, Royal Palm Beach, FL 33411
MLS# A11898879Listed by: UNITED REALTY GROUP INC $520,000Pending3 beds 2 baths1,867 sq. ft.
188 Gulfstream Cir, Royal Palm Beach, FL 33411
MLS# A11874026Listed by: HOME VALUE REALTY, LLC $599,000Pending5 beds 3 baths2,677 sq. ft.
571 Calamint Pt, Royal Palm Beach, FL 33411
MLS# A11879768Listed by: XCELLENCE REALTY $419,600Active5 beds 3 baths
00 Mandeville, Manchester Hills Jamaica, Manchester, FL
MLS# A11853001Listed by: PRA AND COMPANY REALTORS $799,000Active4 beds 3 baths3,135 sq. ft.
2879 Bellarosa Circle, Royal Palm Beach, FL 33411
MLS# R11161229Listed by: REALTY ONE GROUP INNOVATION $600,000Active5 beds 3 baths2,512 sq. ft.
111 Berenger Walk, Royal Palm Beach, FL 33414
MLS# F10538556Listed by: REALTY HUB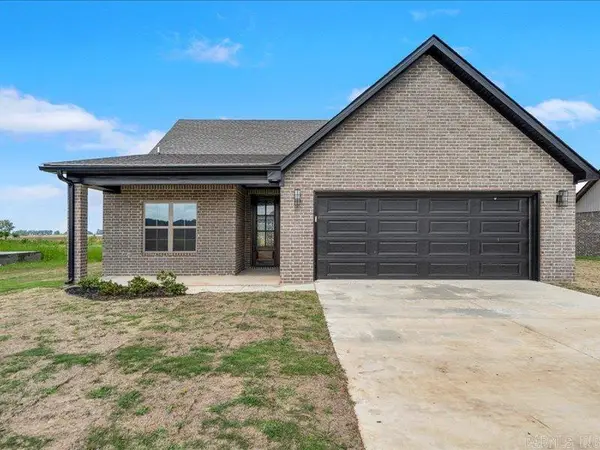 $288,800Active3 beds 2 baths1,500 sq. ft.
173 Pintail Pointe, Manila, AR 72442
MLS# 26001115Listed by: ERA DOTY REAL ESTATE $288,800Active3 beds 2 baths1,600 sq. ft.
177 Pintail Pointe, Manila, AR 72442
MLS# 26001117Listed by: ERA DOTY REAL ESTATE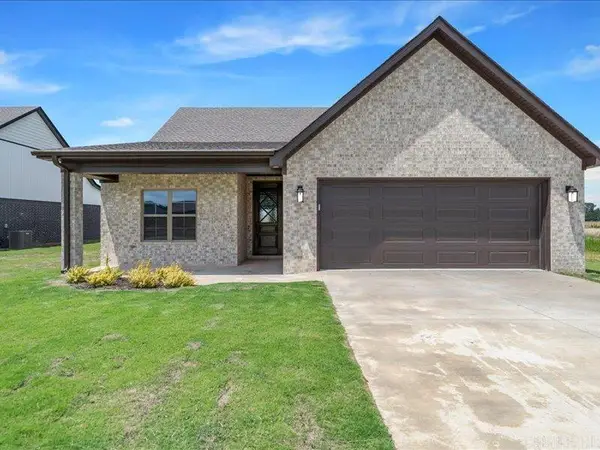 $279,800Active3 beds 2 baths1,500 sq. ft.
189 Pintail Pointe, Manila, AR 72442
MLS# 26001114Listed by: ERA DOTY REAL ESTATE $575,000Active3 beds 2 baths1,589 sq. ft.
155 Kings Way, Royal Palm Beach, FL 33411
MLS# A11761302Listed by: REALTY ONE GROUP EVOLUTION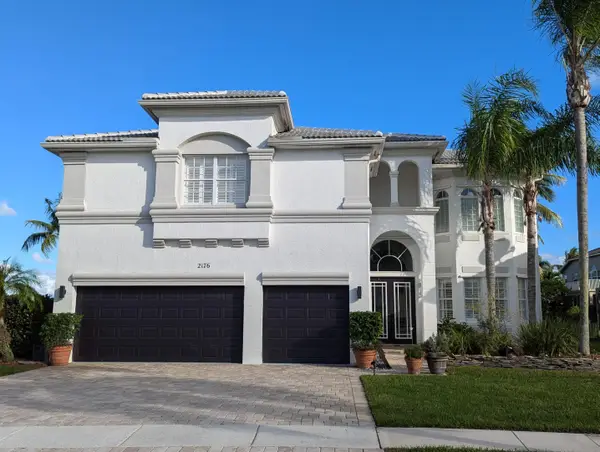 $1,150,000Active5 beds 5 baths3,974 sq. ft.
2176 Bellcrest Circle, Royal Palm Beach, FL 33411
MLS# B26000142Listed by: RE/MAX PRESTIGE REALTY/RPB $589,000Active4 beds 3 baths2,193 sq. ft.
104 Segura Street, Royal Palm Beach, FL 33411
MLS# R10841276Listed by: PALM BEACH INTERNATIONAL RLTY.
Local realty services provided by:CENTURY 21 Hansen Realty, CENTURY 21 Carioti, CENTURY 21 North East, CENTURY 21 Community, CENTURY 21 Lighthouse Realty, CENTURY 21 Combs & Associates Real Estate
Information deemed reliable but not guaranteed. Information is provided, in part, by Greater Miami MLS. This information being provided is for consumer's personal, non-commercial use and may not be used for any other purpose other than to identify prospective properties consumers may be interested in purchasing. SEFMLS Member Broker: Albert Carioti
The information being provided by Stellar Mls is for the consumer's personal, non-commercial use and may not be used for any purpose other than to identify prospective properties consumer may be interested in purchasing. Any information relating to real estate for sale referenced on this web site comes from the Internet Data Exchange (IDX) program of the Stellar Mls. CENTURY 21 North East is not a Multiple Listing Service (MLS), nor does it offer MLS access. This website is a service of CENTURY 21 North East, a broker participant of Stellar Mls. This web site may reference real estate listing(s) held by a brokerage firm other than the broker and/or agent who owns this web site.
The accuracy of all information, regardless of source, including but not limited to open house information, square footages and lot sizes, is deemed reliable but not guaranteed and should be personally verified through personal inspection by and/or with the appropriate professionals. The data contained herein is copyrighted by Stellar Mls and is protected by all applicable copyright laws. Any unauthorized dissemination of this information is in violation of copyright laws and is strictly prohibited.
Properties in listings may have been sold or may no longer be available.
Copyright 2026 Stellar Mls. All rights reserved. MFRMLS Member Broker: Jim D’Amico
Copyright 2026 Mid-America Regional Information Systems. All rights reserved. Listings courtesy of Mid-America Regional Information Systems as distributed by MLS GRID <Last Updated July 21, 2026. Mid-America Regional Information Systems provides content displayed here (“provided content”) on an “as is” basis and makes no representations or warranties regarding the provided content, including, but not limited to those of non-infringement, timeliness, accuracy, or completeness. Individuals and companies using information presented are responsible for verification and validation of information they utilize and present to their customers and clients. Mid-America Regional Information Systems will not be liable for any damage or loss resulting from use of the provided content or the products available through Portals, IDX, VOW, and/or Syndication. Recipients of this information shall not resell, redistribute, reproduce, modify, or otherwise copy any portion thereof without the expressed written consent of Mid-America Regional Information Systems. MO_MARIS Member Broker: Danielle Little
Information deemed reliable but not guaranteed. Information is provided, in part, by Brevard MLS. This information being provided is for consumer's personal, non-commercial use and may not be used for any other purpose other than to identify prospective properties consumers may be interested in purchasing.
Neighborhoods near Royal Palm Beach, FL
Zip codes near Royal Palm Beach, FL
- 33401 homes for sale
- 33403 homes for sale
- 33405 homes for sale
- 33406 homes for sale
- 33407 homes for sale
- 33409 homes for sale
- 33411 homes for sale
- 33412 homes for sale
- 33413 homes for sale
- 33414 homes for sale
- 33415 homes for sale
- 33417 homes for sale
- 33418 homes for sale
- 33449 homes for sale
- 33460 homes for sale
- 33461 homes for sale
- 33463 homes for sale
- 33467 homes for sale
- 33470 homes for sale
- 33480 homes for sale
Popular searches near Royal Palm Beach, FL
- Atlantis homes for sale
- Greenacres homes for sale
- Haverhill homes for sale
- Kenwood Estates homes for sale
- Lake Belvedere Estates homes for sale
- Lake Clarke Shores homes for sale
- Lake Worth homes for sale
- Loxahatchee Groves homes for sale
- Mangonia Park homes for sale
- Palm Springs homes for sale
- Pine Air homes for sale
- Plantation Mobile Home Park homes for sale
- Royal Palm Beach-West Jupiter homes for sale
- Royal Palm Estates homes for sale
- Schall Circle homes for sale
- The Acreage homes for sale
- Wellington homes for sale
- West Palm Beach homes for sale
- Westgate homes for sale
- Westlake homes for sale
Protect your home and budget from life's surprises with an Assurant Home Warranty, backed by a partner that supports you through every step of homeownership. Explore Plans.
©2026 Century 21 Real Estate LLC. All rights reserved. CENTURY 21®, the CENTURY 21 Logo and C21® are service marks owned by Century 21 Real Estate LLC. Century 21 Real Estate LLC fully supports the principles of the Fair Housing Act and the Equal Opportunity Act. Each office is independently owned and operated. Listing information is deemed reliable but not guaranteed accurate.