- Aurora City Center, Aurora homes for sale
- Aurora Highlands, Aurora homes for sale
- Aurora Knolls, Aurora homes for sale
- Center Pointe, Aurora homes for sale
- Centretech, Aurora homes for sale
- Horseshoe Park, Aurora homes for sale
- Lakeshore, Aurora homes for sale
- Meadow Wood, Aurora homes for sale
- Nevin Village Green, Aurora homes for sale
- Quail Run Condominiums, Aurora homes for sale
- Rocky Ridge, Aurora homes for sale
- Sable Cove, Aurora homes for sale
- Sable Ridge, Aurora homes for sale
- Side Creek, Aurora homes for sale
- Southeast Crossing, Aurora homes for sale
- Sterling Hills, Aurora homes for sale
- The Great Plains Lifestyle Community Condominiums, Aurora homes for sale
- Tollgate Overlook, Aurora homes for sale
- Willow Park, Aurora homes for sale
- Woodrim Crossing, Aurora homes for sale
Aurora, CO - homes for sale
300 of 2,293 results displayed
- New
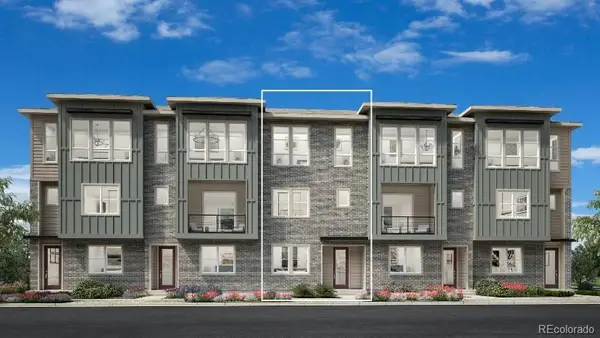
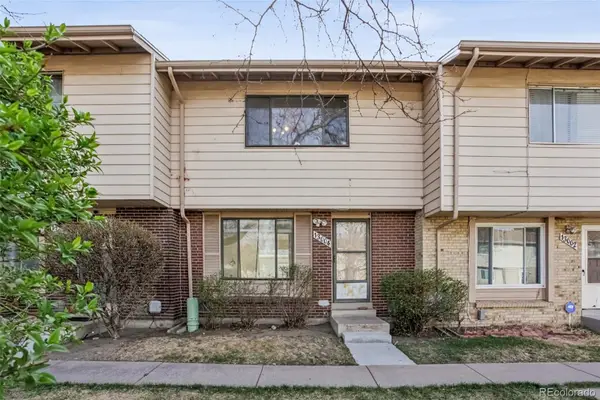
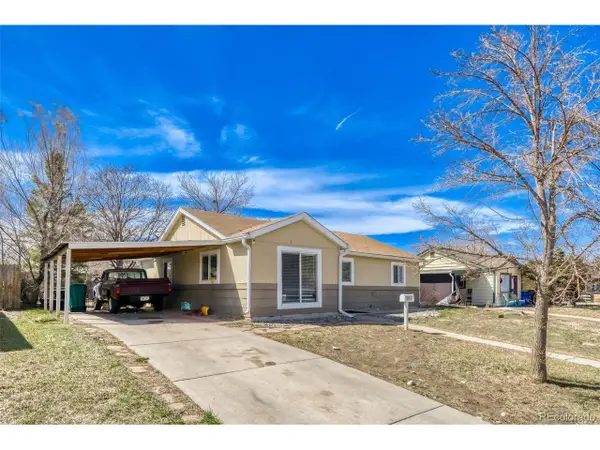
 $550,000Active3 beds 3 baths2,905 sq. ft.
1305 S Biloxi Ct, Aurora, CO 80018
MLS# 2689911Listed by: Aria Khosravi - New
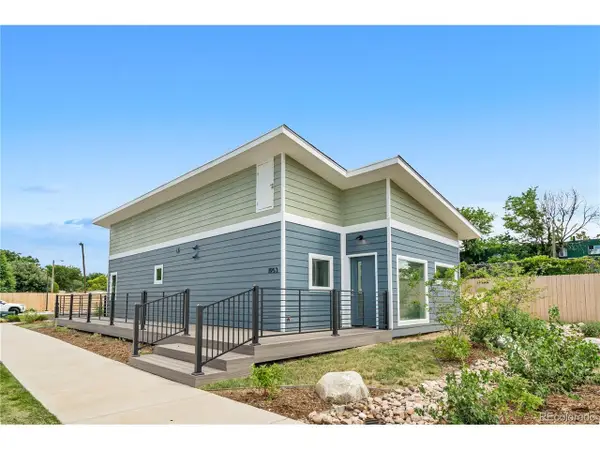
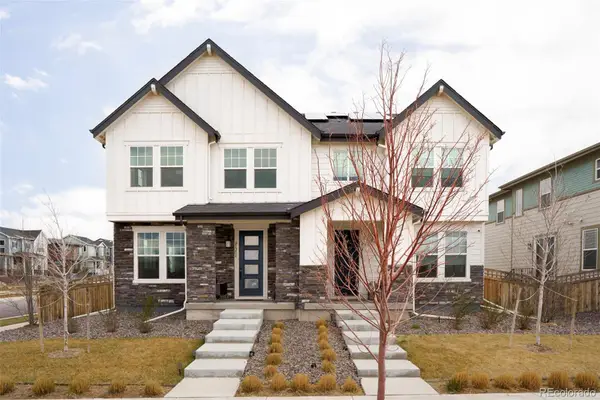
 $1,375,000Active3 beds 3 baths4,367 sq. ft.
8363 S Winnipeg Ct, Aurora, CO 80016
MLS# 2565378Listed by: Compass - Denver - New
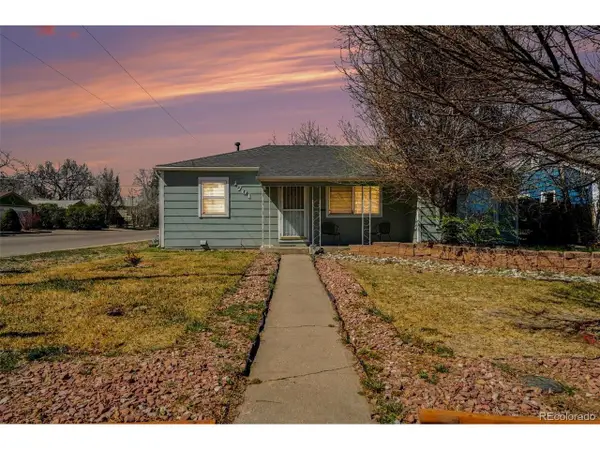
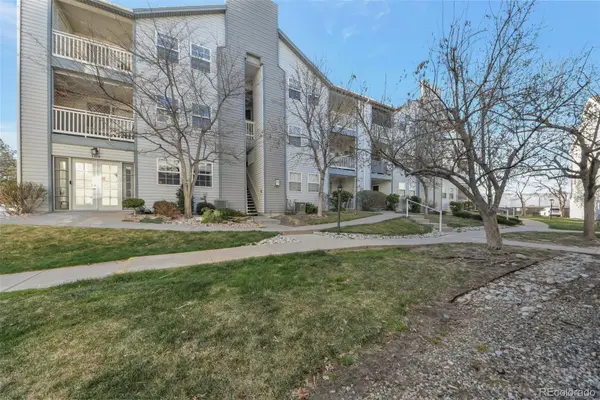
 $338,700Active3 beds 2 baths1,473 sq. ft.
12662 E Warren Dr #B, Aurora, CO 80014
MLS# 4521568Listed by: Kentwood Real Estate DTC, LLC - New
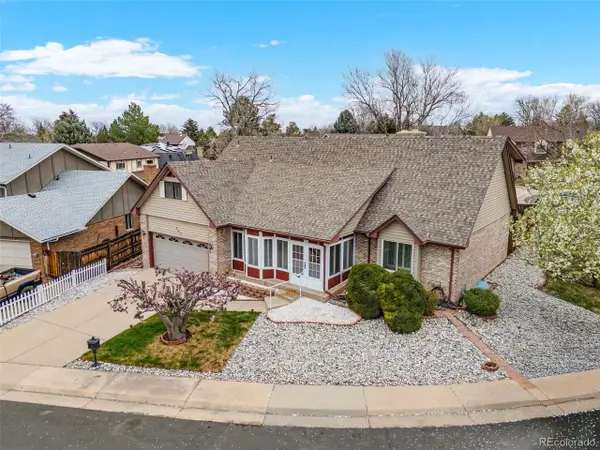
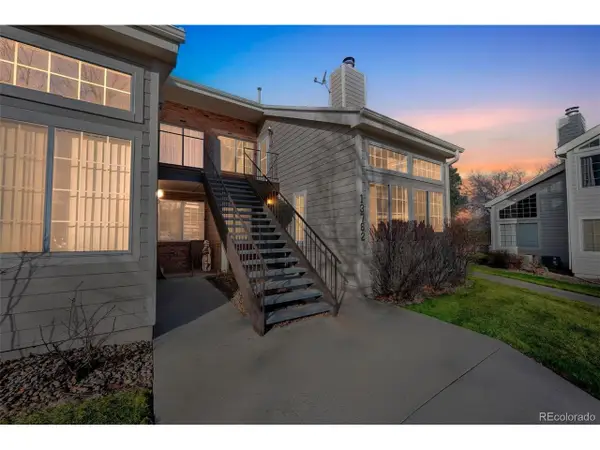
 $399,900Active2 beds 3 baths2,154 sq. ft.
15361 E Louisiana Ave, Aurora, CO 80017
MLS# 7597220Listed by: Thrive Real Estate Group - New
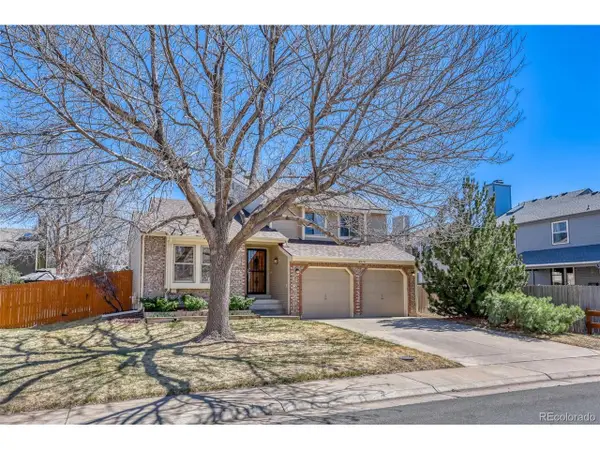
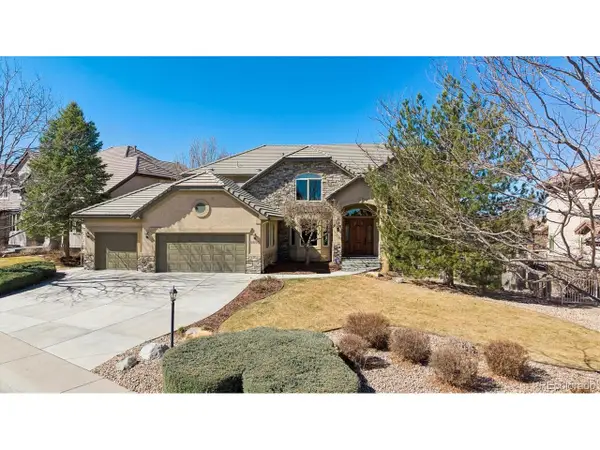
 $775,000Active5 beds 4 baths3,848 sq. ft.
5835 S Danube Cir, Aurora, CO 80015
MLS# 9631884Listed by: Colorado Premier Properties - New
 $490,000Active3 beds 3 baths2,237 sq. ft.
16565 E Girard Ave, Aurora, CO 80013
MLS# 2101681Listed by: Rocky Mountain Real Estate Inc - New
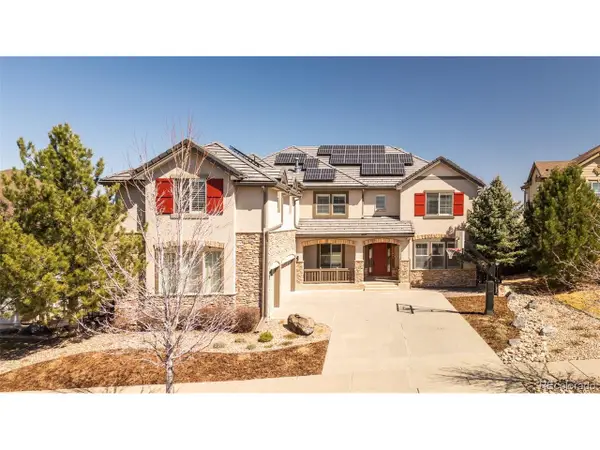
 $840,000Active4 beds 4 baths4,198 sq. ft.
5646 S Grand Baker Ct, Aurora, CO 80016
MLS# 4676836Listed by: Redfin Corporation - Open Sat, 11am to 1pmNew
 $700,000Active7 beds 4 baths4,473 sq. ft.
25160 E Ellsworth Dr, Aurora, CO 80018
MLS# 7901750Listed by: Keller Williams DTC - New
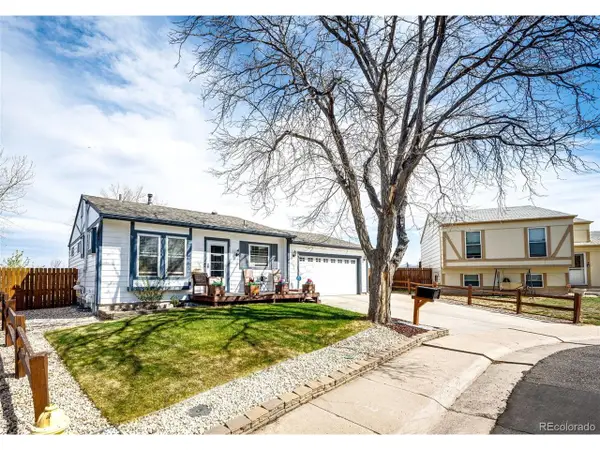
 $434,900Active3 beds 2 baths1,320 sq. ft.
1205 S Telluride St, Aurora, CO 80017
MLS# 8099012Listed by: Keller Williams DTC - New
 $95,000Active3 beds 2 baths1,056 sq. ft.
14470 E 13th Avenue, Aurora, CO 80011
MLS# 1756616Listed by: THE GROSSNICKLE GROUP
- New
 $539,000Active3 beds 3 baths1,985 sq. ft.
25664 E Byers Dr, Aurora, CO 80018
MLS# 4553449Listed by: Re Professionals Llc - New
 $899,000Active3 beds 4 baths3,448 sq. ft.
7243 S Kellerman Way, Aurora, CO 80016
MLS# 8237790Listed by: HomeSmart - Open Thu, 3:30 to 5:30pmNew
 $200,000Active1 beds 1 baths564 sq. ft.
4292 S Salida Way #12, Aurora, CO 80013
MLS# 8343249Listed by: Realty One Group Premier Colorado - New
 $400,000Active3 beds 3 baths1,450 sq. ft.
21239 E 65th Dr, Aurora, CO 80019
MLS# 9067495Listed by: Kerrie A. Young (Independent) - New
 $649,950Active6 beds 4 baths2,933 sq. ft.
1607 S Oakland St, Aurora, CO 80012
MLS# 9155848Listed by: Compass - Denver - Coming Soon
 $365,000Coming Soon2 beds 3 baths
10310 E Jewell Avenue #57, Aurora, CO 80247
MLS# 2051678Listed by: LIV SOTHEBY'S INTERNATIONAL REALTY - New
 $450,000Active3 beds 2 baths1,200 sq. ft.
17551 E Temple Dr, Aurora, CO 80015
MLS# 4002846Listed by: Madison & Company Properties - New
 $300,000Active2 beds 1 baths856 sq. ft.
18624 E Saratoga Pl, Aurora, CO 80015
MLS# 7616346Listed by: Weichert Realtors Professionals - New
 $499,900Active3 beds 2 baths1,664 sq. ft.
20571 E Coolidge Pl, Aurora, CO 80011
MLS# 8487076Listed by: RE/MAX Professionals - New
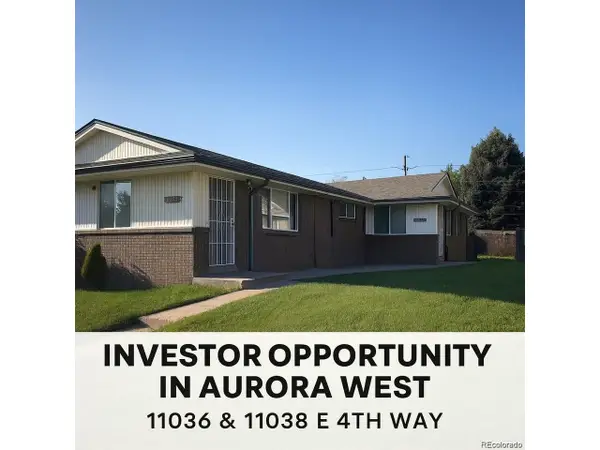 $1,092,000Active8 beds 4 baths3,692 sq. ft.
11036 E 4th Way, Aurora, CO 80010
MLS# 6370251Listed by: Joy of the Rockies Realty - New
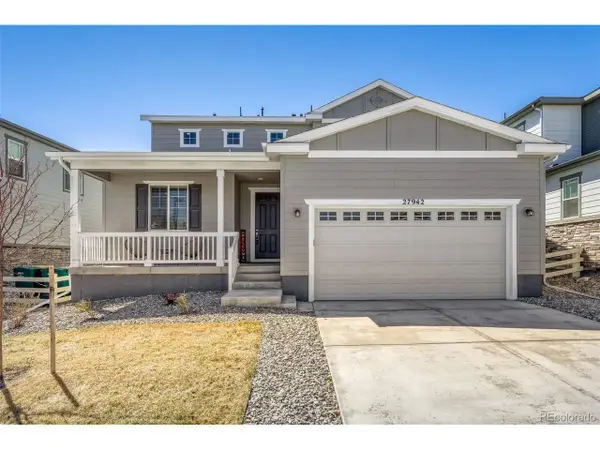 $774,000Active4 beds 4 baths4,352 sq. ft.
27942 E Glasgow Pl, Aurora, CO 80016
MLS# 7022511Listed by: HomeSmart - Coming Soon
 $1,325,000Coming Soon7 beds 5 baths
24996 E Geddes Circle, Aurora, CO 80016
MLS# 2145108Listed by: COLDWELL BANKER REALTY 44 - New
 $640,000Active3 beds 4 baths2,574 sq. ft.
7354 S Memphis St, Aurora, CO 80016
MLS# 8023425Listed by: RE Brokers - New
 $645,950Active3 beds 2 baths3,888 sq. ft.
Address Withheld By Seller, Aurora, CO 80018
MLS# 8230319Listed by: Richmond Realty Inc - New
 $1,075,000Active14 beds 6 baths5,456 sq. ft.
14200 E 22nd Pl, Aurora, CO 80011
MLS# 2161589Listed by: HomeSmart - New
 $1,025,000Active13 beds 6 baths5,456 sq. ft.
14220 E 22nd Pl, Aurora, CO 80011
MLS# 7379076Listed by: HomeSmart - New
 $1,195,000Active5 beds 5 baths4,808 sq. ft.
6735 S Catawba Way, Aurora, CO 80016
MLS# 1997688Listed by: Brokers Guild Real Estate - New
 $820,000Active4 beds 4 baths4,646 sq. ft.
7595 S Quantock Ct, Aurora, CO 80016
MLS# 4925346Listed by: Redfin Corporation - New
 $850,000Active4 beds 4 baths4,498 sq. ft.
21753 E Rowland Cir, Aurora, CO 80016
MLS# 6384190Listed by: Compass - Denver - Coming Soon
 $418,000Coming Soon3 beds 3 baths
24380 E 42nd Avenue, Aurora, CO 80019
MLS# 9491657Listed by: COLDWELL BANKER REALTY 18 - New
 $375,000Active3 beds 3 baths1,765 sq. ft.
2373 N Elmira St, Aurora, CO 80010
MLS# 6518158Listed by: HomeSmart - New
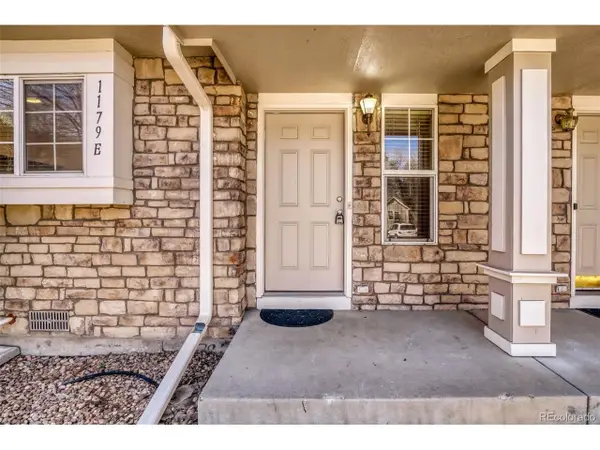 $314,000Active3 beds 3 baths1,148 sq. ft.
1179 S Waco St #E, Aurora, CO 80017
MLS# 6823373Listed by: Sonrise Preferred Properties - New
 $375,000Active3 beds 3 baths1,765 sq. ft.
2371 N Elmira Street, Aurora, CO 80010
MLS# 8311018Listed by: HOMESMART - Open Sat, 11am to 4pmNew
 $697,500Active3 beds 2 baths4,258 sq. ft.
3966 N Catawba Way, Aurora, CO 80019
MLS# 4954900Listed by: Brokers Guild Real Estate - New
 $365,000Active2 beds 2 baths817 sq. ft.
Address Withheld By Seller, Aurora, CO 80017
MLS# 9271266Listed by: Megastar Realty - New
 $395,000Active2 beds 1 baths1,032 sq. ft.
880 Lansing Street, Aurora, CO 80010
MLS# 7217096Listed by: RESIDENT REALTY SOUTH METRO - New$179,900Active2 beds 2 baths840 sq. ft.
364 S Ironton St #128, Aurora, CO 80012
MLS# 8928308Listed by: Keller Williams DTC - New
 $430,000Active3 beds 2 baths1,172 sq. ft.
20561 E Coolidge Place, Aurora, CO 80011
MLS# 4696695Listed by: HOMESMART - New
 $429,900Active3 beds 2 baths1,240 sq. ft.
15716 E Exposition Dr, Aurora, CO 80017
MLS# 1772607Listed by: Brokers Guild Real Estate - New
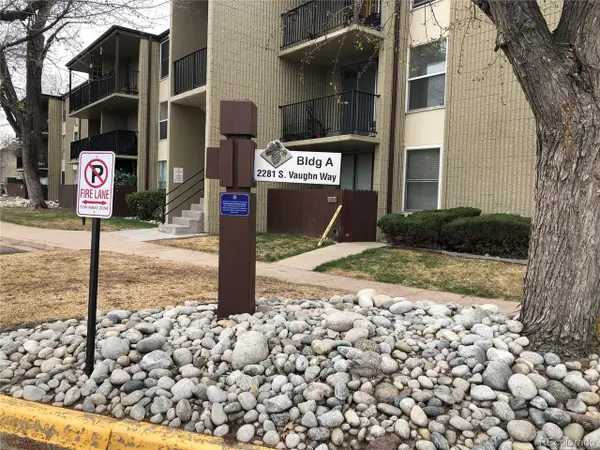 $185,000Active2 beds 2 baths972 sq. ft.
2281 Vaughn #A-306, Aurora, CO 80014
MLS# 9436634Listed by: RH Broker - New
 $185,000Active2 beds 2 baths972 sq. ft.
2281 Vaughn #306, Aurora, CO 80014
MLS# 9436634Listed by: RH BROKER - New
 $595,000Active3 beds 3 baths1,825 sq. ft.
20969 E Quincy Dr, Aurora, CO 80015
MLS# 8515183Listed by: First Team Real Estate - New
 $235,000Active1 beds 1 baths872 sq. ft.
11123 E Alameda Ave #101, Aurora, CO 80012
MLS# 2198385Listed by: Compass - Denver - New
 $830,000Active4 beds 4 baths3,874 sq. ft.
7204 S Ukraine St, Aurora, CO 80016
MLS# 5429663Listed by: Total Realty Corp. - New
 $343,000Active2 beds 1 baths1,125 sq. ft.
1957 Blackhawk St, Aurora, CO 80011
MLS# 7671629Listed by: HomeSmart - New
 $340,000Active2 beds 1 baths1,013 sq. ft.
1959 Blackhawk St, Aurora, CO 80011
MLS# 9087951Listed by: HomeSmart - Open Sat, 12 to 2pmNew
 $590,000Active4 beds 4 baths2,734 sq. ft.
2779 S Waco Way, Aurora, CO 80013
MLS# 7087345Listed by: Lifestyle International Realty - New
 $795,000Active4 beds 4 baths4,082 sq. ft.
6584 S Quantock Ct, Aurora, CO 80016
MLS# 3251953Listed by: Brokers Guild Real Estate - New
 $925,000Active4 beds 5 baths5,468 sq. ft.
4745 S Helena Way, Aurora, CO 80015
MLS# 2925378Listed by: NAV Real Estate - New
 $220,000Active2 beds 2 baths945 sq. ft.
14434 E Colorado Dr #101, Aurora, CO 80012
MLS# 5484964Listed by: RE/MAX Professionals - New
 $470,000Active4 beds 3 baths3,528 sq. ft.
3085 S Pagosa St, Aurora, CO 80013
MLS# 3418458Listed by: HomeSmart Realty - New
 $594,900Active3 beds 3 baths3,418 sq. ft.
21473 E 59th Pl, Aurora, CO 80019
MLS# 4567788Listed by: RE/MAX Professionals - New
 $129,964Active1 beds 1 baths482 sq. ft.
932 S Dearborn Way #18, Aurora, CO 80012
MLS# 5329260Listed by: KELLER WILLIAMS INTEGRITY REAL ESTATE LLC - New
 $230,000Active2 beds 2 baths1,000 sq. ft.
14469 E 1st Drive #A12, Aurora, CO 80011
MLS# 5959673Listed by: COLDWELL BANKER REALTY 24 - New
 $500,000Active4 beds 4 baths1,948 sq. ft.
6257 N Kirk Street, Aurora, CO 80019
MLS# 6219315Listed by: COLDWELL BANKER REALTY 56 - New
 $495,000Active4 beds 4 baths1,755 sq. ft.
6265 N Kirk Street, Aurora, CO 80019
MLS# 9589605Listed by: COLDWELL BANKER REALTY 56 - New
 $340,000Active3 beds 2 baths960 sq. ft.
1953 Blackhawk St, Aurora, CO 80011
MLS# 4743991Listed by: HomeSmart - New
 $425,000Active4 beds 2 baths1,600 sq. ft.
1701 Ironton St, Aurora, CO 80010
MLS# 5456871Listed by: Keller Williams Realty Urban Elite - Open Sat, 12 to 2pmNew
 $575,000Active5 beds 4 baths4,052 sq. ft.
262 S Salem Ct, Aurora, CO 80012
MLS# 7754398Listed by: Compass - Denver - New
 $625,000Active4 beds 4 baths3,300 sq. ft.
15993 E Loyola Drive, Aurora, CO 80013
MLS# 1982090Listed by: REALTY ONE GROUP PREMIER - New
 $499,800Active3 beds 3 baths1,524 sq. ft.
19570 E Sunset Circle, Aurora, CO 80015
MLS# 6936473Listed by: BROKERS GUILD HOMES - Open Sat, 10am to 2pmNew
 $569,000Active6 beds 2 baths1,860 sq. ft.
2356 Florence Street, Aurora, CO 80010
MLS# 8565727Listed by: DENVER REAL ESTATE PROFESSIONALS - New
 $445,000Active3 beds 2 baths1,774 sq. ft.
740 Ironton St, Aurora, CO 80010
MLS# 1054999Listed by: Daniels Group Real Estate - New
 $549,000Active4 beds 3 baths1,855 sq. ft.
11538 E Highline Pl, Aurora, CO 80010
MLS# 3355185Listed by: Keller Williams Realty Downtown LLC - New
 $369,900Active3 beds 1 baths912 sq. ft.
719 S Macon Way, Aurora, CO 80012
MLS# 4511258Listed by: RE/MAX Alliance - New
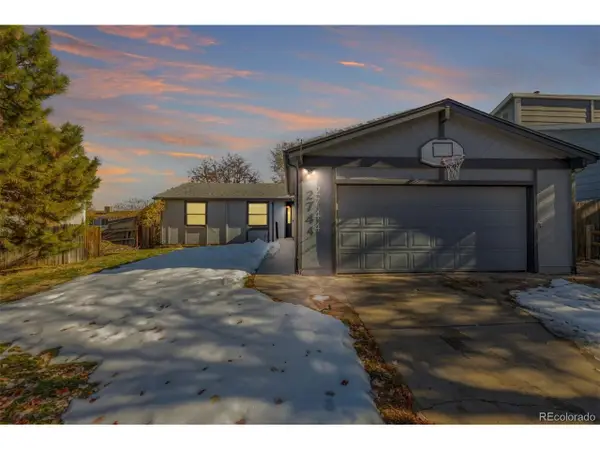 $485,000Active3 beds 2 baths2,144 sq. ft.
2744 S Pitkin St, Aurora, CO 80013
MLS# 5552736Listed by: Engel & Volkers Denver - New
 $189,999Active1 beds 1 baths560 sq. ft.
17053 E Tennessee Dr #104, Aurora, CO 80017
MLS# 7003971Listed by: Real Broker, LLC DBA Real - New
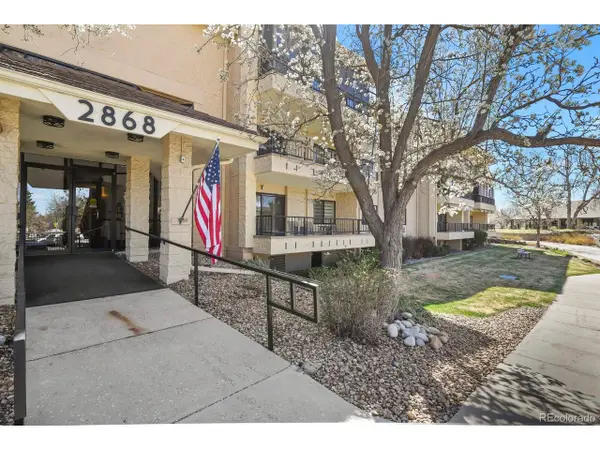 $354,000Active2 beds 2 baths1,200 sq. ft.
2868 S Heather Gardens Way #B 250-109, Aurora, CO 80014
MLS# 6231804Listed by: HomeSmart - New
 $500,000Active5 beds 2 baths1,662 sq. ft.
17557 E Chenango Drive, Aurora, CO 80015
MLS# 6055353Listed by: EXIT REALTY DTC, CHERRY CREEK, PIKES PEAK. - New
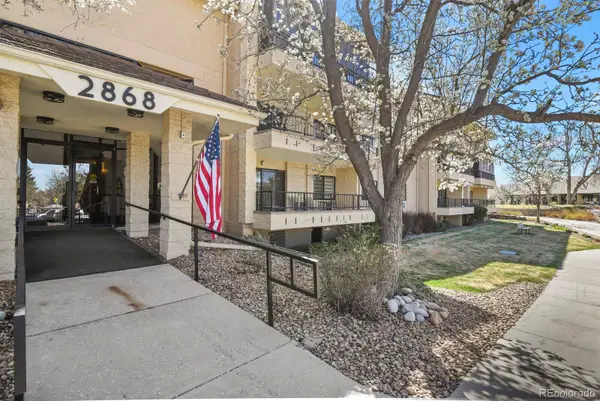 $354,000Active2 beds 2 baths1,200 sq. ft.
2868 S Heather Gardens Way #109, Aurora, CO 80014
MLS# 6231804Listed by: HOMESMART - New
 $230,000Active1 beds 1 baths725 sq. ft.
Address Withheld By Seller, Aurora, CO 80014
MLS# 2220181Listed by: Amy Bergan Real Estate - New
 $315,000Active2 beds 1 baths862 sq. ft.
23510 E Alamo Place #E, Aurora, CO 80016
MLS# 3081504Listed by: RE/MAX PROFESSIONALS - New
 $475,000Active3 beds 2 baths1,408 sq. ft.
19661 E Bethany Dr, Aurora, CO 80013
MLS# 2041135Listed by: Compass - Denver - New
 $250,000Active2 beds 2 baths1,208 sq. ft.
2191 S Victor St #D, Aurora, CO 80014
MLS# 4041322Listed by: eXp Realty, LLC - New
 $764,491Active2 beds 2 baths3,403 sq. ft.
8791 S Quemoy St, Aurora, CO 80016
MLS# 7231600Listed by: Valor Real Estate, LLC - New
 $479,000Active4 beds 3 baths2,478 sq. ft.
3460 S Halifax Way, Aurora, CO 80013
MLS# 2097720Listed by: Mathisen Real Estate - Open Sat, 11am to 1pmNew
 $474,900Active2 beds 3 baths1,360 sq. ft.
1980 S Fultondale Court, Aurora, CO 80018
MLS# 3965539Listed by: KELLER WILLIAMS ACTION REALTY LLC  $542,500Pending4 beds 3 baths3,240 sq. ft.
15681 E Jefferson Ave, Aurora, CO 80013
MLS# 2264814Listed by: HomeSmart- New
 $285,000Active2 beds 1 baths940 sq. ft.
17146 E Tennessee Dr, Aurora, CO 80017
MLS# 5125206Listed by: Wisdom Real Estate - New
 $535,000Active3 beds 2 baths3,393 sq. ft.
26873 E Archer Ave, Aurora, CO 80018
MLS# 6422870Listed by: 8z Real Estate - New
 $609,900Active4 beds 3 baths2,316 sq. ft.
3963 Flat Rock St, Aurora, CO 80019
MLS# 7387463Listed by: HomeSmart Realty - New
 $525,000Active4 beds 3 baths2,072 sq. ft.
3770 S Walden St, Aurora, CO 80013
MLS# 8702873Listed by: Redfin Corporation - Open Sat, 11am to 1pmNew
 $380,000Active2 beds 2 baths1,468 sq. ft.
4251 S Blackhawk Cir #3C, Aurora, CO 80014
MLS# 9995412Listed by: Madison & Company Properties - New
 $460,000Active3 beds 3 baths2,374 sq. ft.
2827 S Xanadu Way, Aurora, CO 80014
MLS# 2310191Listed by: BROKERS GUILD HOMES - New
 $430,000Active3 beds 2 baths1,662 sq. ft.
4822 S Quintero Cir, Aurora, CO 80015
MLS# 3337868Listed by: Sterling Real Estate Group Inc - New
 $278,500Active2 beds 2 baths936 sq. ft.
2179 S Scranton Way #103, Aurora, CO 80014
MLS# 6399618Listed by: Keller Williams DTC  $520,000Pending4 beds 3 baths3,066 sq. ft.
3177 S Mobile Way, Aurora, CO 80013
MLS# 4903678Listed by: KEY MASTER REAL ESTATE $919,900Pending6 beds 5 baths4,547 sq. ft.
24980 E Roxbury Place, Aurora, CO 80016
MLS# 7762512Listed by: KELLER WILLIAMS DTC- New
 $490,000Active3 beds 2 baths1,662 sq. ft.
5162 S Richfield St, Aurora, CO 80015
MLS# 7684959Listed by: Jason Mitchell Real Estate Colorado, LLC - New
 $515,000Active5 beds 3 baths2,300 sq. ft.
343 Galena St, Aurora, CO 80010
MLS# 8048693Listed by: 4 JA Realty, LLC - New
 $520,000Active2 beds 2 baths1,423 sq. ft.
4616 S Malaya Court, Aurora, CO 80015
MLS# 4700961Listed by: COMPASS - DENVER - Open Wed, 11am to 4pmNew
 $395,000Active2 beds 3 baths1,362 sq. ft.
20597 E 62nd Drive, Aurora, CO 80019
MLS# 2910215Listed by: COLDWELL BANKER REALTY 56 - New
 $305,000Active2 beds 2 baths1,085 sq. ft.
2662 S Cathay Way #303, Aurora, CO 80013
MLS# 3713763Listed by: COLORADO REAL ESTATE EXPERTS - Open Wed, 11am to 4pmNew
 $430,000Active3 beds 3 baths1,479 sq. ft.
20567 E 62nd Drive, Aurora, CO 80019
MLS# 6137052Listed by: COLDWELL BANKER REALTY 56 - New
 $425,000Active3 beds 2 baths1,632 sq. ft.
2233 Kenton Street, Aurora, CO 80010
MLS# 7830696Listed by: GATHER REALTY - New
 $525,000Active4 beds 4 baths2,094 sq. ft.
20257 E College Place, Aurora, CO 80013
MLS# 7633935Listed by: EXP REALTY, LLC - Open Wed, 11am to 4pmNew
 $525,000Active4 beds 4 baths1,911 sq. ft.
6273 N Jebel St, Aurora, CO 80019
MLS# 2060938Listed by: Coldwell Banker Realty 56 - New
 $115,000Active1 beds 1 baths700 sq. ft.
364 S Ironton St #419, Aurora, CO 80012
MLS# 2122333Listed by: Atlas Real Estate Group - New
 $270,000Active2 beds 2 baths1,008 sq. ft.
Address Withheld By Seller, Aurora, CO 80013
MLS# 3444894Listed by: Blue Pebble Homes - New
 $529,000Active3 beds 4 baths2,267 sq. ft.
3749 S Dayton Way, Aurora, CO 80014
MLS# 4291345Listed by: A Better Way Realty - New
 $549,900Active3 beds 3 baths3,009 sq. ft.
3338 N Haleyville Ct, Aurora, CO 80019
MLS# 8760703Listed by: RE/MAX Professionals - Open Wed, 11am to 4pmNew
 $525,000Active4 beds 4 baths1,911 sq. ft.
6273 N Jebel Street, Aurora, CO 80019
MLS# 2060938Listed by: COLDWELL BANKER REALTY 56 - New
 $500,000Active3 beds 3 baths1,469 sq. ft.
22182 E Belleview Place, Aurora, CO 80015
MLS# 2606322Listed by: COMPASS - DENVER - New
 $290,000Active3 beds 2 baths1,120 sq. ft.
13004 E Kansas Place, Aurora, CO 80012
MLS# 4834575Listed by: BEACON PROPERTY MANAGEMENT LLC - New
 $500,000Active3 beds 3 baths1,721 sq. ft.
21208 E 63rd Avenue, Aurora, CO 80019
MLS# 7984775Listed by: MILEHIMODERN - New
 $590,000Active3 beds 3 baths2,702 sq. ft.
4974 S Evanston St, Aurora, CO 80015
MLS# 2278093Listed by: Colorado Realty NOW, Inc - New
 $1,300,000Active5 beds 5 baths6,845 sq. ft.
26746 E Peakview Dr, Aurora, CO 80016
MLS# 4196454Listed by: Milehimodern - New
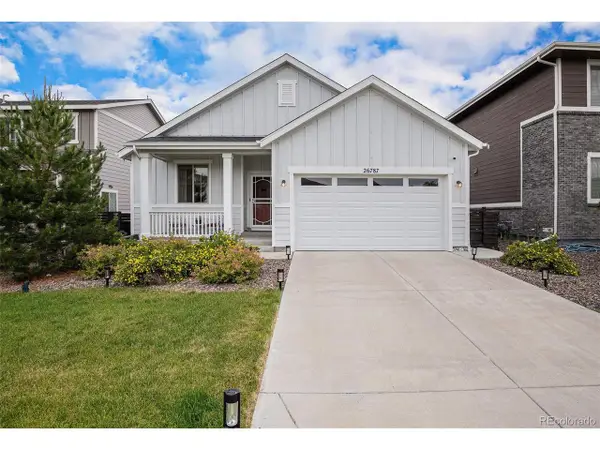 $485,000Active3 beds 2 baths1,686 sq. ft.
26787 E Maple Ave, Aurora, CO 80018
MLS# 7039532Listed by: Compass - Denver  $430,000Pending4 beds 2 baths2,352 sq. ft.
3101 Victor St, Aurora, CO 80011
MLS# 7991612Listed by: Keller Williams DTC- New
 $485,000Active4 beds 2 baths2,168 sq. ft.
15199 E Walsh Place, Aurora, CO 80012
MLS# 3170270Listed by: ORCHARD BROKERAGE LLC - New
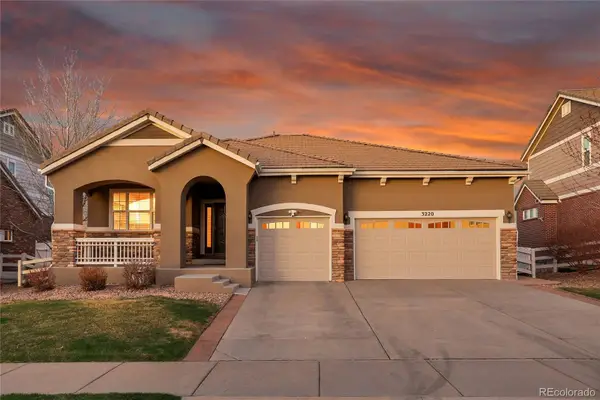 $750,000Active4 beds 4 baths3,526 sq. ft.
3220 S Nepal Way, Aurora, CO 80013
MLS# 4850065Listed by: EXIT REALTY DTC, CHERRY CREEK, PIKES PEAK. - New
 $630,000Active5 beds 4 baths3,160 sq. ft.
25404 E 2nd Avenue, Aurora, CO 80018
MLS# 6136058Listed by: RE/MAX PROFESSIONALS - New
 $825,000Active4 beds 4 baths4,479 sq. ft.
23930 E Minnow Drive, Aurora, CO 80016
MLS# 7580748Listed by: MILEHIMODERN - New
 $520,000Active5 beds 3 baths3,620 sq. ft.
2713 S Paris Place, Aurora, CO 80014
MLS# 8379049Listed by: TOTAL REALTY CORP.  $575,000Pending4 beds 4 baths3,073 sq. ft.
19121 E Hampden Dr, Aurora, CO 80013
MLS# 5015088Listed by: MB Bellissimo Homes- New
 $485,000Active3 beds 2 baths1,694 sq. ft.
2623 S Halifax Ct, Aurora, CO 80013
MLS# 9037080Listed by: eXp Realty, LLC - New
 $635,000Active4 beds 4 baths3,926 sq. ft.
24306 E Ohio Drive, Aurora, CO 80018
MLS# 2076854Listed by: KELLER WILLIAMS PREFERRED REALTY - New
 $380,000Active2 beds 2 baths1,080 sq. ft.
3970 N Rome St, Aurora, CO 80019
MLS# 5328643Listed by: Keller Williams DTC - New
 $269,000Active1 beds 1 baths824 sq. ft.
2003 S Helena St #D, Aurora, CO 80013
MLS# 9940831Listed by: Mondo West Real Estate - New
 $399,000Active2 beds 2 baths1,324 sq. ft.
1052 Lewiston Street, Aurora, CO 80011
MLS# 9631311Listed by: LIV SOTHEBY'S INTERNATIONAL REALTY - New
 $675,000Active6 beds 4 baths3,031 sq. ft.
21929 E Stanford Cir, Aurora, CO 80015
MLS# 9869306Listed by: Orchard Brokerage LLC - New
 $608,000Active4 beds 4 baths3,032 sq. ft.
5563 S Elk Ct, Aurora, CO 80016
MLS# 9930688Listed by: eXp Realty, LLC - New
 $350,000Active2 beds 2 baths1,254 sq. ft.
1746 Galena St, Aurora, CO 80010
MLS# 3250996Listed by: Keller Williams DTC - New
 $315,000Active3 beds 3 baths1,152 sq. ft.
1640 S Ivory Cir #B, Aurora, CO 80017
MLS# 8895407Listed by: Milehimodern - New
 $189,900Active1 beds 1 baths544 sq. ft.
17477 E Rice Circle #F, Aurora, CO 80015
MLS# 6674507Listed by: EXP REALTY, LLC - New
 $785,000Active6 beds 5 baths5,178 sq. ft.
6047 S Ukraine Street, Aurora, CO 80015
MLS# 7040472Listed by: REDFIN CORPORATION - New
 $199,000Active2 beds 1 baths840 sq. ft.
17050 E Ford Drive #102, Aurora, CO 80017
MLS# 7383937Listed by: RE/MAX PROFESSIONALS - New
 $675,000Active4 beds 3 baths2,820 sq. ft.
11335 E Arkansas Ave, Aurora, CO 80012
MLS# 8706620Listed by: Brokers Guild Homes - New
 $360,000Active2 beds 2 baths1,382 sq. ft.
233 S Nome Street, Aurora, CO 80012
MLS# 8899974Listed by: COLDWELL BANKER REALTY 44  $429,000Pending3 beds 2 baths2,240 sq. ft.
16812 E Mansfield Cir, Aurora, CO 80013
MLS# 4334443Listed by: Atlas Real Estate Group- New
 $590,000Active3 beds 3 baths2,118 sq. ft.
126 S Vandriver Way, Aurora, CO 80018
MLS# 5902668Listed by: KELLER WILLIAMS REALTY NORTHERN COLORADO - New
 $559,000Active3 beds 2 baths3,050 sq. ft.
5613 S Elk Court, Aurora, CO 80016
MLS# 6049114Listed by: ATLAS REAL ESTATE GROUP - New
 $740,000Active4 beds 3 baths3,704 sq. ft.
4797 S Odessa Street, Aurora, CO 80015
MLS# 8894223Listed by: KELLER WILLIAMS DTC - Open Sat, 12 to 3:30pmNew
 $550,000Active8 beds 3 baths2,352 sq. ft.
3148 Racine St, Aurora, CO 80011
MLS# 2120014Listed by: Keller Williams DTC - New
 $284,900Active3 beds 2 baths1,299 sq. ft.
15911 E Dakota Pl #301, Aurora, CO 80017
MLS# 3710070Listed by: eXp Realty, LLC - New
 $515,000Active3 beds 3 baths2,133 sq. ft.
18943 E Mercer Dr, Aurora, CO 80013
MLS# 9895633Listed by: Compass - Denver - New
 $536,849Active3 beds 2 baths1,775 sq. ft.
3338 N Duquesne Way, Aurora, CO 80019
MLS# 2728549Listed by: RE/MAX PROFESSIONALS - New
 $305,000Active2 beds 3 baths1,088 sq. ft.
14358 E Pimlico Pl #B124, Aurora, CO 80015
MLS# 4782493Listed by: Equity Colorado Real Estate - New
 $460,000Active3 beds 2 baths1,128 sq. ft.
800 Vaughn St, Aurora, CO 80011
MLS# 6908580Listed by: Century 21 Moore Real Estate - New
 $474,900Active3 beds 2 baths1,976 sq. ft.
1540 S Troy St, Aurora, CO 80012
MLS# 7326953Listed by: Real Estate Connection, LLC - New
 $609,990Active3 beds 3 baths1,942 sq. ft.
22687 E 47th Pl, Aurora, CO 80019
MLS# 7804228Listed by: Landmark Residential Brokerage - Open Sat, 11am to 3pmNew
 $1,150,000Active5 beds 6 baths5,463 sq. ft.
27790 E Links Pl, Aurora, CO 80016
MLS# 8599799Listed by: HomeSmart  $350,000Pending3 beds 3 baths2,017 sq. ft.
Address Withheld By Seller, Aurora, CO 80017
MLS# 9291399Listed by: RE/MAX of Cherry Creek- New
 $279,900Active3 beds 2 baths1,236 sq. ft.
15165 E 16th Place #201, Aurora, CO 80011
MLS# 6150590Listed by: COLDWELL BANKER REALTY 24 - New
 $585,000Active3 beds 3 baths2,332 sq. ft.
6900 S Algonquian Court, Aurora, CO 80016
MLS# 7852383Listed by: HOMESMART - New
 $614,990Active3 beds 3 baths1,942 sq. ft.
22836 E 47th Place, Aurora, CO 80019
MLS# 4155662Listed by: LANDMARK RESIDENTIAL BROKERAGE - New
 $559,000Active4 beds 2 baths2,693 sq. ft.
429 Newark Street, Aurora, CO 80010
MLS# 6741055Listed by: KELLER WILLIAMS ACTION REALTY LLC - New
 $280,000Active2 beds 2 baths1,176 sq. ft.
16808 E Gunnison Dr #6H, Aurora, CO 80017
MLS# 7464662Listed by: Amy Bergan Real Estate - New
 $562,800Active4 beds 3 baths1,694 sq. ft.
2599 S Jebel Way, Aurora, CO 80013
MLS# 4528609Listed by: CENTURY 21 ALTITUDE REAL ESTATE, LLC - New
 $474,900Active4 beds 3 baths2,325 sq. ft.
892 S Rifle Way, Aurora, CO 80017
MLS# 9157904Listed by: COMPASS - DENVER - New
 $540,000Active4 beds 3 baths2,622 sq. ft.
12386 E Bates Cir, Aurora, CO 80014
MLS# 9016423Listed by: HomeSmart - New
 $849,000Active3 beds 3 baths4,482 sq. ft.
27878 E Clifton Pl, Aurora, CO 80016
MLS# 9161089Listed by: Compass - Denver - New
 $675,000Active4 beds 3 baths3,803 sq. ft.
4144 S Liverpool Way, Aurora, CO 80013
MLS# 5652761Listed by: YOUR CASTLE REALTY LLC - New
 $509,000Active5 beds 3 baths2,303 sq. ft.
15195 E Bails Place, Aurora, CO 80012
MLS# 8680780Listed by: REAL BROKER, LLC DBA REAL - New
 $425,000Active3 beds 2 baths1,272 sq. ft.
17701 E Kansas Place, Aurora, CO 80017
MLS# 4522453Listed by: COMPASS - DENVER - New
 $335,000Active2 beds 1 baths796 sq. ft.
1328 Dayton St, Aurora, CO 80010
MLS# 2473358Listed by: Your Castle Realty LLC - New
 $440,000Active3 beds 2 baths1,291 sq. ft.
998 Toledo St, Aurora, CO 80011
MLS# 6083102Listed by: Icon Real Estate, LLC - New
 $385,000Active2 beds 2 baths1,476 sq. ft.
4024 S Carson St #203, Aurora, CO 80014
MLS# 6980405Listed by: Kentwood Real Estate DTC, LLC - New
 $450,000Active3 beds 4 baths2,218 sq. ft.
11185 E Linvale Drive, Aurora, CO 80014
MLS# 7708570Listed by: COLDWELL BANKER REALTY 44 - New
 $325,000Active3 beds 1 baths1,174 sq. ft.
3852 S Dallas St #8-107, Aurora, CO 80014
MLS# 5424914Listed by: Rocky Mountain Real Estate Inc - Open Fri, 4:30 to 6:30pmNew
 $315,000Active2 beds 2 baths1,012 sq. ft.
4085 S Crystal Circle #202, Aurora, CO 80014
MLS# 5270010Listed by: COLDWELL BANKER GLOBAL LUXURY DENVER - New
 $325,000Active3 beds 1 baths1,174 sq. ft.
3852 S Dallas Street #107, Aurora, CO 80014
MLS# 5424914Listed by: ROCKY MOUNTAIN REAL ESTATE INC - New
 $237,000Active2 beds 1 baths755 sq. ft.
12454 E Tennessee Cir #D, Aurora, CO 80012
MLS# 6824193Listed by: Your Castle Real Estate Inc - New
 $337,000Active3 beds 2 baths1,298 sq. ft.
18388 E Eldorado Pl #F, Aurora, CO 80013
MLS# 7958452Listed by: EXIT Realty DTC, Cherry Creek, Pikes Peak. - New
 $425,000Active6 beds 3 baths2,528 sq. ft.
4148 S Lewiston Circle, Aurora, CO 80013
MLS# 5430674Listed by: COLDWELL BANKER REALTY 44 - New
 $335,000Active2 beds 1 baths1,015 sq. ft.
23545 E Platte Dr #E, Aurora, CO 80016
MLS# 6109556Listed by: Equity Colorado Real Estate - New
 $330,000Active2 beds 3 baths1,568 sq. ft.
14087 E Jewell Ave, Aurora, CO 80012
MLS# 4960406Listed by: Area Pros Real Estate - New
 $425,000Active2 beds 2 baths3,060 sq. ft.
9966 E Hawaii Pl, Aurora, CO 80247
MLS# 7125033Listed by: Keller Williams Integrity Real Estate LLC - New
 $189,000Active1 beds 1 baths748 sq. ft.
4074 S Atchison Way #203, Aurora, CO 80014
MLS# 7242503Listed by: LIV Sotheby's International Realty - New
 $535,000Active3 beds 2 baths1,874 sq. ft.
26984 E Archer Ave, Aurora, CO 80018
MLS# 1055086Listed by: Coldwell Banker Realty-N Metro - New
 $389,000Active3 beds 2 baths936 sq. ft.
1372 Lima St, Aurora, CO 80010
MLS# 9122389Listed by: Brokers Guild Homes - New
 $270,000Active2 beds 1 baths974 sq. ft.
2682 S Cathay Way #205, Aurora, CO 80013
MLS# 9175013Listed by: RE/MAX Professionals - New
 $360,000Active3 beds 3 baths1,930 sq. ft.
Address Withheld By Seller, Aurora, CO 80017
MLS# 6787162Listed by: A&T Colorado Realty - New
 $529,900Active4 beds 3 baths2,178 sq. ft.
2682 S Quintero Way, Aurora, CO 80013
MLS# 9486377Listed by: HomeSmart - New
 $500,000Active4 beds 3 baths2,681 sq. ft.
398 Uvalda Street, Aurora, CO 80011
MLS# 5167614Listed by: RE/MAX OF CHERRY CREEK - New
 $514,900Active3 beds 3 baths1,591 sq. ft.
5214 S Shawnee Way, Aurora, CO 80015
MLS# 1054588Listed by: WK Real Estate - New
 $425,000Active3 beds 2 baths1,471 sq. ft.
2228 Newark St, Aurora, CO 80010
MLS# 2299119Listed by: Madison & Company Properties - New
 $500,000Active4 beds 3 baths2,252 sq. ft.
3960 S Argonne Way, Aurora, CO 80013
MLS# 4802230Listed by: EXP REALTY, LLC - Open Sat, 12am to 2pmNew
 $330,000Active2 beds 2 baths1,096 sq. ft.
3216 S Walden Ct #L, Aurora, CO 80013
MLS# 2482228Listed by: HomeSmart - New
 $475,000Active3 beds 3 baths2,628 sq. ft.
11405 E Vassar Dr, Aurora, CO 80014
MLS# 7521146Listed by: RE/MAX Alliance - New
 $1,155,000Active5 beds 5 baths5,096 sq. ft.
27500 E Lakeview Dr, Aurora, CO 80016
MLS# 8778862Listed by: Orchard Brokerage LLC  $599,900Pending3 beds 4 baths1,875 sq. ft.
18876 E Powers Dr, Aurora, CO 80015
MLS# 2591058Listed by: Beacon Real Estate Services LLC- New
 $185,000Active2 beds 1 baths930 sq. ft.
3124 S Wheeling Way #209-212, Aurora, CO 80014
MLS# 7910512Listed by: RE/MAX Professionals - New
 $185,000Active2 beds 1 baths930 sq. ft.
3124 S Wheeling Way #212, Aurora, CO 80014
MLS# 7910512Listed by: RE/MAX PROFESSIONALS - New
 $465,950Active3 beds 3 baths1,475 sq. ft.
Address Withheld By Seller, Aurora, CO 80017
MLS# 8682165Listed by: Richmond Realty Inc - New
 $825,000Active5 beds 3 baths4,942 sq. ft.
26654 E Indore Avenue, Aurora, CO 80016
MLS# 6942446Listed by: COMPASS - DENVER - New
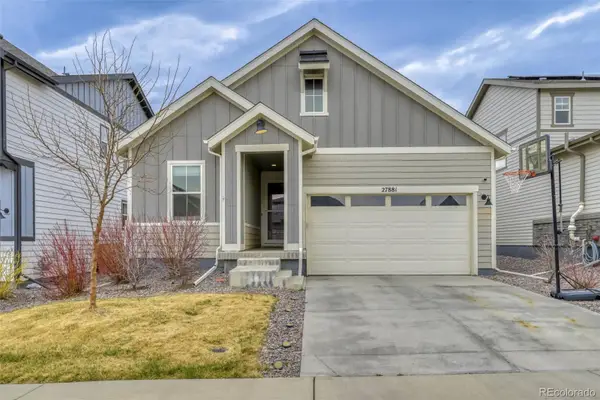 $475,000Active2 beds 2 baths1,630 sq. ft.
27881 E 7th Avenue, Aurora, CO 80018
MLS# 8496021Listed by: REAL BROKER, LLC DBA REAL - New
 $399,900Active3 beds 1 baths1,120 sq. ft.
923 Geneva St, Aurora, CO 80010
MLS# 7182408Listed by: Real Broker, LLC DBA Real - New
 $600,000Active4 beds 4 baths3,251 sq. ft.
5078 S Tempe Way, Aurora, CO 80015
MLS# 9819126Listed by: MB TEAM LASSEN - New
 $550,000Active3 beds 2 baths1,882 sq. ft.
26 S Undergrove Street, Aurora, CO 80018
MLS# 9556983Listed by: KENTWOOD REAL ESTATE CHERRY CREEK - New
 $205,000Active1 beds 1 baths648 sq. ft.
17246 E Ford Dr, Aurora, CO 80017
MLS# 4715592Listed by: Compass - Denver - New
 $550,000Active4 beds 3 baths2,508 sq. ft.
13027 E Colorado Ave, Aurora, CO 80012
MLS# 4559775Listed by: HomeSmart - New
 $475,000Active4 beds 2 baths1,684 sq. ft.
690 S Newark Court, Aurora, CO 80012
MLS# 5822493Listed by: COLDWELL BANKER REALTY 18 - New
 $1,144,000Active5 beds 5 baths5,759 sq. ft.
7791 S Coolidge Way, Aurora, CO 80016
MLS# 2917282Listed by: COLDWELL BANKER REALTY 24 - New
 $270,000Active2 beds 2 baths1,162 sq. ft.
2621 S Xanadu Way #B, Aurora, CO 80014
MLS# 3830718Listed by: EXP REALTY, LLC - New
 $720,000Active5 beds 4 baths3,802 sq. ft.
Address Withheld By Seller, Aurora, CO 80019
MLS# 1788569Listed by: Keller Williams Realty Downtown LLC - New
 $245,000Active2 beds 1 baths720 sq. ft.
1334 Havana Street, Aurora, CO 80010
MLS# 8718675Listed by: CITY LIMITS PROPERTY MANAGEMENT, LLC - New
 $430,000Active3 beds 3 baths1,573 sq. ft.
1827 S Helena, Aurora, CO 80017
MLS# 4165034Listed by: West and Main Homes Inc - New
 $180,000Active2 beds 2 baths981 sq. ft.
1893 S Pitkin St #A, Aurora, CO 80017
MLS# 6838930Listed by: eXp Realty, LLC - New
 $599,950Active3 beds 3 baths2,248 sq. ft.
Address Withheld By Seller, Aurora, CO 80017
MLS# 8633825Listed by: Richmond Realty Inc - New
 $770,000Active5 beds 5 baths4,663 sq. ft.
5748 S Duquesne Court, Aurora, CO 80016
MLS# 3050670Listed by: GUARDIAN REAL ESTATE GROUP - New
 $450,000Active2 beds 2 baths1,423 sq. ft.
924 N Waterloo Street, Aurora, CO 80018
MLS# 8236514Listed by: PAK HOME REALTY - New
 $325,000Active2 beds 2 baths1,378 sq. ft.
14275 E Montana Circle #B, Aurora, CO 80012
MLS# 5938935Listed by: BLUE PEBBLE HOMES - New
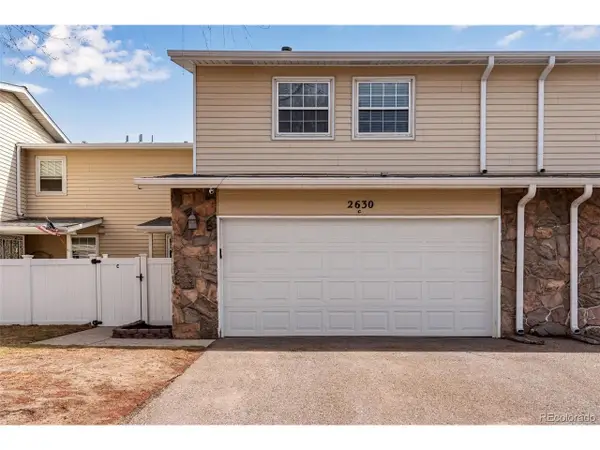 $409,800Active3 beds 4 baths2,418 sq. ft.
2630 S Vaughn Way #C, Aurora, CO 80014
MLS# 7227631Listed by: Brokers Guild Homes - New
 $349,900Active3 beds 3 baths1,537 sq. ft.
1720 S Quintero Way, Aurora, CO 80017
MLS# 3200530Listed by: THE IMPACT REALTY - New
 $790,000Active4 beds 4 baths4,113 sq. ft.
21470 E Union Dr, Aurora, CO 80015
MLS# 7562444Listed by: RE/MAX Synergy - New
 $1,950,000Active7 beds 7 baths5,342 sq. ft.
Address Withheld By Seller, Aurora, CO 80016
MLS# 2846047Listed by: Kentwood Real Estate DTC, LLC - New
 $995,000Active4 beds 4 baths3,514 sq. ft.
6959 S Buchanan St, Aurora, CO 80016
MLS# 3903680Listed by: Transmarket Properties - New
 $450,000Active3 beds 3 baths2,544 sq. ft.
2824 S Heather Gardens Way #B, Aurora, CO 80014
MLS# 2626597Listed by: PMG Realty - New
 $470,000Active3 beds 4 baths1,837 sq. ft.
6745 S Tempe Ct, Aurora, CO 80016
MLS# 1934204Listed by: EXIT Realty DTC, Cherry Creek, Pikes Peak. - New
 $138,000Active3 beds 2 baths1,568 sq. ft.
1819 Crystal Street, Aurora, CO 80011
MLS# 5017280Listed by: KELLER WILLIAMS ADVANTAGE REALTY LLC - New
 $530,000Active4 beds 4 baths2,717 sq. ft.
15885 E Kepner Drive, Aurora, CO 80017
MLS# 2641929Listed by: COMPASS - DENVER - New
 $327,500Active2 beds 2 baths1,001 sq. ft.
160 Granby Way #A, Aurora, CO 80011
MLS# 2783907Listed by: West and Main Homes Inc - New
 $540,000Active4 beds 3 baths2,118 sq. ft.
5335 S Ukraine Way, Aurora, CO 80015
MLS# 8346537Listed by: Realty One Group Premier Colorado - New
 $180,000Active1 beds 1 baths709 sq. ft.
14904 E Hampden Cir #C7, Aurora, CO 80014
MLS# 3123842Listed by: Dubrova and Associate LLC - New
 $499,000Active3 beds 3 baths1,580 sq. ft.
4101 S Espana Way, Aurora, CO 80013
MLS# 3220354Listed by: HomeSmart - New
 $229,000Active2 beds 1 baths831 sq. ft.
13732 E Lehigh Ave #A, Aurora, CO 80014
MLS# 9430022Listed by: Trelora Realty, Inc.  $525,000Pending3 beds 2 baths4,304 sq. ft.
15972 E Lehigh Cir, Aurora, CO 80013
MLS# 9591087Listed by: HomeSmart- New
 $485,000Active4 beds 2 baths2,200 sq. ft.
1354 S Zeno Street, Aurora, CO 80017
MLS# 3771547Listed by: WEICHERT REALTORS PROFESSIONALS - New
 $389,000Active3 beds 2 baths1,098 sq. ft.
987 Vaughn St, Aurora, CO 80011
MLS# 7739733Listed by: West Peak Properties - New
 $275,000Active2 beds 2 baths1,200 sq. ft.
12555 E Tennessee Circle #303, Aurora, CO 80012
MLS# 9190249Listed by: COMPASS - DENVER - New
 $250,000Active2 beds 2 baths1,200 sq. ft.
13626 E Bates Ave #203-203, Aurora, CO 80014
MLS# 2502652Listed by: Heather Gardens Brokers - New
 $205,000Active2 beds 1 baths692 sq. ft.
Address Withheld By Seller, Aurora, CO 80014
MLS# 3347996Listed by: Trelora Realty, Inc. - New
 $1,424,000Active5 beds 7 baths6,666 sq. ft.
6893 S Netherland Way, Aurora, CO 80016
MLS# 4703163Listed by: RE/MAX Professionals - New
 $1,070,000Active4 beds 5 baths5,527 sq. ft.
26949 E Friend Pl, Aurora, CO 80016
MLS# 7929519Listed by: Equity Colorado Real Estate - New
 $565,000Active3 beds 3 baths1,800 sq. ft.
1777 Alton Street, Aurora, CO 80010
MLS# 6382138Listed by: COLDWELL BANKER REALTY 56 - New
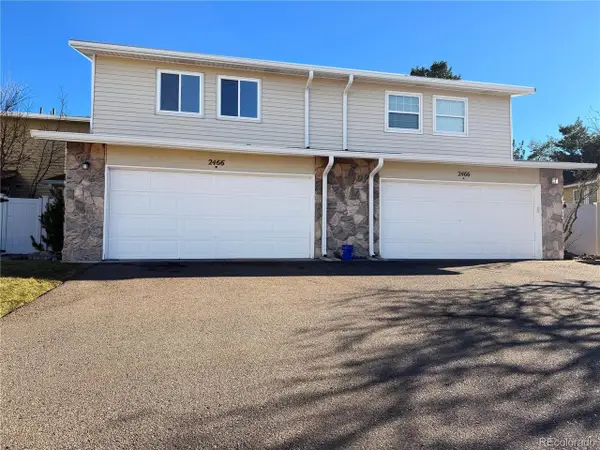 $379,900Active3 beds 3 baths2,418 sq. ft.
2466 S Vaughn Way #B, Aurora, CO 80014
MLS# 5828304Listed by: Stillman Real Estate - New
 $664,999Active4 beds 3 baths3,157 sq. ft.
2430 S Fundy Cir, Aurora, CO 80013
MLS# 7724262Listed by: Lawanson Real Estate Professionals  $748,190Active5 beds 4 baths3,022 sq. ft.
24376 E 35th Dr, Aurora, CO 80019
MLS# 1054406Listed by: RE/MAX Professionals DTC $359,000Active3 beds 3 baths2,092 sq. ft.
4132 S Richfield Way, Aurora, CO 80013
MLS# 5980284Listed by: YOUR CASTLE REAL ESTATE INC $849,950Active6 beds 5 baths3,941 sq. ft.
24362 E Atlantic Dr, Aurora, CO 80016
MLS# 6430926Listed by: RE/MAX Professionals $799,950Active5 beds 3 baths4,139 sq. ft.
24382 E Atlantic Dr, Aurora, CO 80016
MLS# 8405939Listed by: RE/MAX Professionals $685,000Active5 beds 4 baths2,679 sq. ft.
6153 S Jackson Gap Ct, Aurora, CO 80016
MLS# 8884968Listed by: LIV Sotheby's International Realty $299,000Active2 beds 2 baths1,061 sq. ft.
10035 E Carolina Pl #201, Aurora, CO 80247
MLS# 5443590Listed by: Kentwood Real Estate DTC, LLC $659,900Active4 beds 3 baths3,637 sq. ft.
21061 E Mansfield Pl, Aurora, CO 80013
MLS# 7848206Listed by: Equity Colorado Real Estate $519,000Active3 beds 3 baths2,288 sq. ft.
19271 E Evans Place, Aurora, CO 80013
MLS# 5467488Listed by: YOUR CASTLE REALTY LLC $619,000Active4 beds 3 baths3,135 sq. ft.
2042 S Moline Way, Aurora, CO 80014
MLS# 7817304Listed by: Broker Bakford LLC $275,000Active2 beds 2 baths944 sq. ft.
14 Nome Way #C, Aurora, CO 80012
MLS# 8645851Listed by: Brokers Guild Homes $615,000Active4 beds 4 baths2,412 sq. ft.
25822 E Archer Dr, Aurora, CO 80018
MLS# 3814977Listed by: HomeSmart $405,000Pending4 beds 2 baths1,730 sq. ft.
16666 E Bails Pl, Aurora, CO 80017
MLS# 6488156Listed by: Real Broker, LLC DBA Real $315,000Active3 beds 2 baths1,352 sq. ft.
178 S Nome St, Aurora, CO 80012
MLS# 9098850Listed by: American Home Agents $499,000Active3 beds 4 baths1,913 sq. ft.
14952 E Belleview Avenue, Aurora, CO 80015
MLS# IR1054334Listed by: RE/MAX ALLIANCE-FTC SOUTH $189,999Active2 beds 2 baths816 sq. ft.
1075 S Elkhart Way #102, Aurora, CO 80012
MLS# 6460835Listed by: Keller Williams Realty Downtown LLC $850,000Active7 beds 6 baths4,851 sq. ft.
14046 E 22nd Pl, Aurora, CO 80011
MLS# 9695783Listed by: Pinnacle Real Estate Advisors $579,000Active4 beds 4 baths2,591 sq. ft.
21965 E Irish Dr, Aurora, CO 80016
MLS# 3150708Listed by: Compass - Denver $404,999Active2 beds 2 baths2,148 sq. ft.
1700 S Helena St, Aurora, CO 80017
MLS# 3676269Listed by: Megastar Realty $500,000Active3 beds 2 baths1,341 sq. ft.
2624 S Gibralter Street, Aurora, CO 80013
MLS# 8705361Listed by: THRIVE REAL ESTATE GROUP $569,000Active3 beds 2 baths1,888 sq. ft.
86 S Vandriver Way, Aurora, CO 80018
MLS# 5821294Listed by: COLORADO FLAT FEE REALTY INC $506,900Active3 beds 2 baths2,382 sq. ft.
18379 E Linvale Dr, Aurora, CO 80013
MLS# 2469419Listed by: Metro Design Realty $650,000Active3 beds 2 baths3,604 sq. ft.
6333 S Jackson Gap Ct, Aurora, CO 80016
MLS# 5362933Listed by: Madison Commercial Properties LLC $278,900Active2 beds 2 baths1,024 sq. ft.
9991 E Idaho Cir #204, Aurora, CO 80247
MLS# 5924071Listed by: Compass - Denver $375,000Active2 beds 3 baths1,624 sq. ft.
2625 S Peoria Street, Aurora, CO 80014
MLS# 3525223Listed by: COLDWELL BANKER REALTY 24 $435,000Active4 beds 2 baths1,850 sq. ft.
922 S Ironton Street, Aurora, CO 80012
MLS# 3983219Listed by: YOUR CASTLE REAL ESTATE INC $585,000Active4 beds 3 baths3,266 sq. ft.
119 S Oak Hill Ct, Aurora, CO 80018
MLS# 2339633Listed by: Compass - Denver $264,900Active2 beds 2 baths1,036 sq. ft.
1662 S Blackhawk Way #C, Aurora, CO 80012
MLS# 3669578Listed by: RE/MAX Professionals $270,000Active2 beds 2 baths982 sq. ft.
908 S Yampa St #104, Aurora, CO 80017
MLS# 7148527Listed by: Camber Realty, LTD $420,000Pending3 beds 3 baths1,534 sq. ft.
23616 E 5th Place, Aurora, CO 80018
MLS# 7455066Listed by: BETTER BLUEPRINT REALTY $445,000Active4 beds 2 baths1,920 sq. ft.
378 S Racine Street, Aurora, CO 80012
MLS# 2398551Listed by: LOKATION $210,000Active1 beds 1 baths709 sq. ft.
14934 E Hampden Circle #3, Aurora, CO 80014
MLS# 8872914Listed by: COLDWELL BANKER REALTY 54 $820,000Active5 beds 4 baths3,738 sq. ft.
18844 E Union Place, Aurora, CO 80015
MLS# 2275701Listed by: FATHOM REALTY COLORADO LLC $249,900Active2 beds 3 baths1,176 sq. ft.
1069 S Walden Way #125, Aurora, CO 80017
MLS# 9271200Listed by: DENCO PROPERTY MGMT & SALES $429,999Active3 beds 2 baths1,906 sq. ft.
339 S Ursula Way, Aurora, CO 80012
MLS# 9670727Listed by: WORTH CLARK REALTY $779,000Active3 beds 4 baths2,566 sq. ft.
11399 E 25th Dr, Aurora, CO 80010
MLS# 2306413Listed by: Equity Colorado Real Estate $329,973Pending2 beds 1 baths736 sq. ft.
11408 E 7th Ave, Aurora, CO 80010
MLS# 3360140Listed by: Buy-Out Company Realty, LLC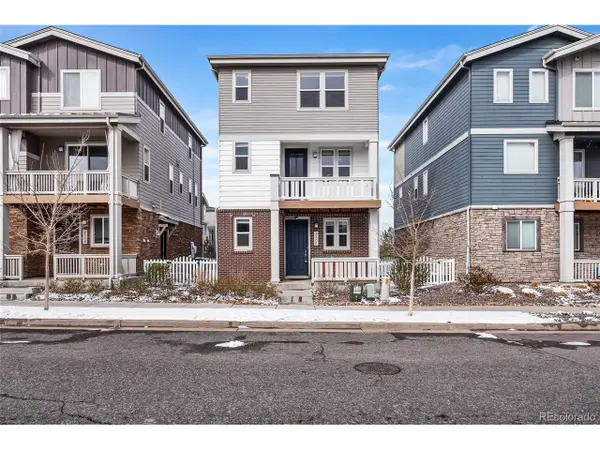 $475,000Active3 beds 3 baths1,891 sq. ft.
2372 S Scranton St, Aurora, CO 80014
MLS# 5678537Listed by: Your Castle Real Estate Inc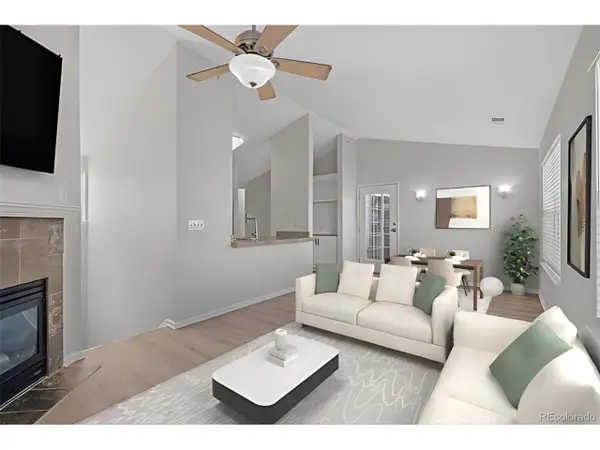 $358,000Active2 beds 2 baths1,097 sq. ft.
3884 S Dallas Cir #202, Aurora, CO 80014
MLS# 5752730Listed by: Capital Property Group LLC $160,000Active1 beds 1 baths564 sq. ft.
4284 S Salida Way #16, Aurora, CO 80013
MLS# 9156870Listed by: MODUS Real Estate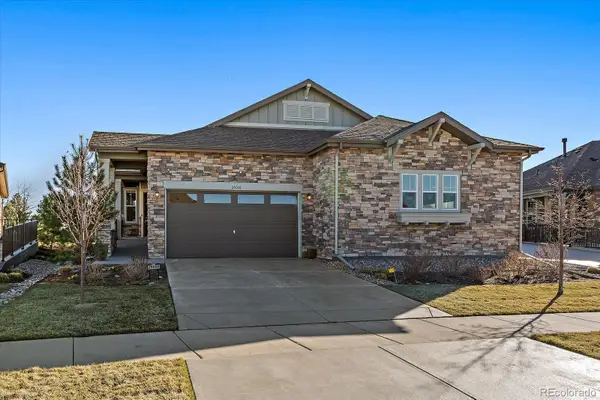 $660,000Active3 beds 2 baths3,006 sq. ft.
25058 E Alder Drive, Aurora, CO 80016
MLS# 8378413Listed by: LOKATION REAL ESTATE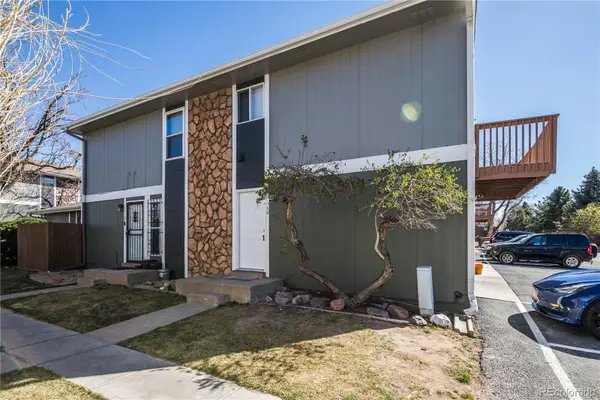 $239,973Active2 beds 1 baths903 sq. ft.
9901 E Evans Avenue #5D, Aurora, CO 80247
MLS# 8696860Listed by: BUY-OUT COMPANY REALTY, LLC $448,000Active3 beds 2 baths1,401 sq. ft.
756 Ursula St, Aurora, CO 80011
MLS# 2753213Listed by: HomeSmart $849,950Active3 beds 3 baths4,076 sq. ft.
1933 S Eaton Park Way, Aurora, CO 80016
MLS# 3267175Listed by: RE/MAX Professionals $519,900Active4 beds 3 baths2,138 sq. ft.
3667 S Flanders, Aurora, CO 80013
MLS# 7069061Listed by: Real Broker, LLC DBA Real $412,500Active3 beds 3 baths2,374 sq. ft.
2752 S Heather Gardens Way #303-13, Aurora, CO 80014
MLS# 9189371Listed by: Weichert Realtors Professionals $489,900Active4 beds 2 baths1,738 sq. ft.
3800 S Quintero Cir, Aurora, CO 80013
MLS# 9428430Listed by: Your Home Sold Guaranteed Realty - Premier Partners $183,000Active1 beds 1 baths742 sq. ft.
11983 E Harvard Ave #106, Aurora, CO 80014
MLS# 9791649Listed by: Integrity Real Estate Group $599,900Active4 beds 3 baths2,490 sq. ft.
20592 E Duke Drive, Aurora, CO 80013
MLS# 1636947Listed by: LOKATION REAL ESTATE $499,900Active3 beds 3 baths1,632 sq. ft.
15132 E Bates Avenue, Aurora, CO 80014
MLS# 4293581Listed by: COMPASS - DENVER $420,000Active4 beds 2 baths1,659 sq. ft.
1635 Ensenada Way, Aurora, CO 80011
MLS# 4381489Listed by: MEGASTAR REALTY $269,500Active2 beds 1 baths903 sq. ft.
9901 E Evans Avenue #14D, Aurora, CO 80247
MLS# 7811354Listed by: EXP REALTY, LLC $490,000Active4 beds 3 baths1,983 sq. ft.
25605 E Maple Pl, Aurora, CO 80018
MLS# 1506228Listed by: Atlas Real Estate Group $449,000Pending4 beds 3 baths2,075 sq. ft.
4063 S Himalaya Way, Aurora, CO 80013
MLS# 3490768Listed by: Atlas Real Estate Group $250,000Active2 beds 2 baths1,200 sq. ft.
14001 E Marina Dr #103, Aurora, CO 80014
MLS# 4373499Listed by: Keller Williams Realty Northern Colorado $185,000Active2 beds 1 baths929 sq. ft.
13902 E Marina Dr #311, Aurora, CO 80014
MLS# 6219181Listed by: RE/MAX Professionals $499,000Active3 beds 3 baths2,203 sq. ft.
2604 S Dunkirk Court, Aurora, CO 80013
MLS# 6730931Listed by: ATLAS REAL ESTATE GROUP $475,000Active5 beds 2 baths2,262 sq. ft.
2211 Lima Street, Aurora, CO 80010
MLS# 3633147Listed by: ALTOS REALTY ADVISORS, INC. $209,000Active2 beds 2 baths982 sq. ft.
14704 E 2nd Avenue #210E, Aurora, CO 80011
MLS# 9106026Listed by: GOOD NEIGHBOR LIVING $725,000Active5 beds 4 baths3,652 sq. ft.
22640 E Tufts Place, Aurora, CO 80015
MLS# 3945260Listed by: COLDWELL BANKER REALTY 24 $435,000Active3 beds 2 baths2,355 sq. ft.
3691 S Mission Parkway, Aurora, CO 80013
MLS# 9849535Listed by: CORCORAN PERRY & CO. $240,000Active1 beds 1 baths847 sq. ft.
13950 E Oxford Place #A202, Aurora, CO 80014
MLS# 3853242Listed by: COMPASS - DENVER $630,000Active5 beds 4 baths2,932 sq. ft.
7384 S Memphis St, Aurora, CO 80016
MLS# 1660886Listed by: Assist2Sell RE Professionals $450,000Active5 beds 2 baths1,590 sq. ft.
1444 S Helena Cir, Aurora, CO 80017
MLS# 8442806Listed by: Megastar Realty $375,000Active2 beds 3 baths1,314 sq. ft.
1680 S Tower Rd, Aurora, CO 80017
MLS# 1643001Listed by: Corey Nabors $549,900Active4 beds 3 baths2,295 sq. ft.
12436 E Cedar Cir, Aurora, CO 80012
MLS# 3217484Listed by: HomeSmart $465,000Active3 beds 2 baths1,787 sq. ft.
16006 E Warren Pl, Aurora, CO 80013
MLS# 4513208Listed by: Brokers Guild Homes $265,000Active2 beds 2 baths987 sq. ft.
12182 E Kepner Pl, Aurora, CO 80012
MLS# 6574757Listed by: You 1st Realty - Unity $213,000Pending2 beds 2 baths1,086 sq. ft.
14594 E 13th Ave, Aurora, CO 80011
MLS# 7368022Listed by: Opendoor Brokerage LLC $549,900Active4 beds 4 baths2,672 sq. ft.
2711 S Oakland Circle E, Aurora, CO 80014
MLS# 5294952Listed by: RE/MAX ALLIANCE $750,000Active0.29 Acres
1915 Dallas St, Aurora, CO 80010
MLS# 3591033Listed by: Atrium Realty LLC $435,000Active3 beds 3 baths1,400 sq. ft.
21983 E Crestline Lane, Aurora, CO 80015
MLS# 7754550Listed by: COMPASS - DENVER $535,000Active3 beds 3 baths2,052 sq. ft.
5493 S Versailles Street, Aurora, CO 80015
MLS# 3101937Listed by: LIV SOTHEBY'S INTERNATIONAL REALTY
Local realty services provided by:CENTURY 21 Cornerstone, CENTURY 21 Top Dog Properties
The real estate listing information and related content displayed on this site is provided exclusively for consumer's personal, non-commercial use and may not be used for any purpose other than to identify prospective properties consumers may be interested in purchasing. This information and related content is deemed reliable but is not guaranteed accurate by Information and Real Estate Services, LLC.
Information source: Information and Real Estate Services, LLC. Provided for limited non-commercial use only under IRES Rules © Copyright IRES. The information being provided by Information and Real Estate Services is for the consumer's personal, non-commercial use and may not be used for any purpose other than to identify prospective properties consumer may be interested in purchasing. Any information relating to real estate for sale referenced on this web site comes from the Internet Data Exchange (IDX) program of the Information and Real Estate Services. This web site may reference real estate listing(s) held by a brokerage firm other than the broker and/or agent who owns this web site.
The accuracy of all information, regardless of source, including but not limited to open house information, square footages and lot sizes, is deemed reliable but not guaranteed and should be personally verified through personal inspection by and/or with the appropriate professionals. The data contained herein is copyrighted by Information and Real Estate Services and is protected by all applicable copyright laws. Any unauthorized dissemination of this information is in violation of copyright laws and is strictly prohibited.
Based on information submitted to the MLS GRID as of March 22, 2026 04:40 PM. All data is obtained from various sources and may not have been verified by broker or MLS GRID. Supplied Open House information is subject to change without notice. All information should be independently reviewed and verified for accuracy. Properties may or may not be listed by the office/agent presenting the information.
The information being provided by Pikes Peak REALTOR® Services Corp. is for the consumer's personal, non-commercial use and may not be used for any purpose other than to identify prospective properties consumer may be interested in purchasing. Any information relating to real estate for sale referenced on this web site comes from the Internet Data Exchange (IDX) program of the Pikes Peak REALTOR® Services Corp.. CENTURY 21 Top Dog Properties is not a Multiple Listing Service (MLS), nor does it offer MLS access. This website is a service of CENTURY 21 Top Dog Properties, a broker participant of Pikes Peak REALTOR® Services Corp.. This web site may reference real estate listing(s) held by a brokerage firm other than the broker and/or agent who owns this web site.
The accuracy of all information, regardless of source, including but not limited to open house information, square footages and lot sizes, is deemed reliable but not guaranteed and should be personally verified through personal inspection by and/or with the appropriate professionals. The data contained herein is copyrighted by Pikes Peak REALTOR® Services Corp. and is protected by all applicable copyright laws. Any unauthorized dissemination of this information is in violation of copyright laws and is strictly prohibited.
The real estate listing information and related content displayed on this site is provided exclusively for consumers' personal, non-commercial use and may not be used for any purpose other than to identify prospective properties consumers may be interested in purchasing. This information and related content is deemed reliable but is not guaranteed accurate by the Pikes Peak REALTOR® Services Corp.
Copyright 2026 Pikes Peak REALTOR® Services Corp. All rights reserved.
Neighborhoods near Aurora, CO
Zip codes near Aurora, CO
- 80010 homes for sale
- 80011 homes for sale
- 80012 homes for sale
- 80013 homes for sale
- 80014 homes for sale
- 80015 homes for sale
- 80016 homes for sale
- 80017 homes for sale
- 80018 homes for sale
- 80111 homes for sale
- 80220 homes for sale
- 80222 homes for sale
- 80224 homes for sale
- 80230 homes for sale
- 80231 homes for sale
- 80237 homes for sale
- 80238 homes for sale
- 80239 homes for sale
- 80246 homes for sale
- 80247 homes for sale
Popular searches near Aurora, CO
- Centennial homes for sale
- Cherry Creek homes for sale
- Cherry Hills Village homes for sale
- Commerce City homes for sale
- Denver homes for sale
- Dove Valley homes for sale
- Englewood homes for sale
- Four Square Mile homes for sale
- Glendale homes for sale
- Greenwood Village homes for sale
- Holly Hills homes for sale
- Inverness homes for sale
- Lone Tree homes for sale
- Meridian homes for sale
- Meridian Village homes for sale
- North Aurora homes for sale
- Sierra Ridge homes for sale
- South Aurora homes for sale
- Southwest Arapahoe homes for sale
- Stonegate homes for sale
Protect your home and budget from life's surprises with an Assurant Home Warranty, backed by a partner that supports you through every step of homeownership. Explore Plans.
©2026 Century 21 Real Estate LLC. All rights reserved. CENTURY 21®, the CENTURY 21 Logo and C21® are service marks owned by Century 21 Real Estate LLC. Century 21 Real Estate LLC fully supports the principles of the Fair Housing Act and the Equal Opportunity Act. Each office is independently owned and operated. Listing information is deemed reliable but not guaranteed accurate.