- Albany homes for sale
- Algood homes for sale
- Allons homes for sale
- Alpine homes for sale
- Bloomington Springs homes for sale
- Burkesville homes for sale
- Byrdstown homes for sale
- Celina homes for sale
- Dodson Branch homes for sale
- Gainesboro homes for sale
- Granville homes for sale
- Hilham homes for sale
- Kettle-Peytonsburg homes for sale
- Livingston homes for sale
- Monroe homes for sale
- Moss homes for sale
- Red Boiling Springs homes for sale
- Rickman homes for sale
- Tompkinsville homes for sale
- Whitleyville homes for sale
38551, TN - homes for sale
138 of 138 results displayed
 $49,900Active0.37 Acres
41 Bald Eagle Rd, Hilham, TN 38568
MLS# 3149698Listed by: EXIT CROSS ROADS REALTY COOKEVILLE- New
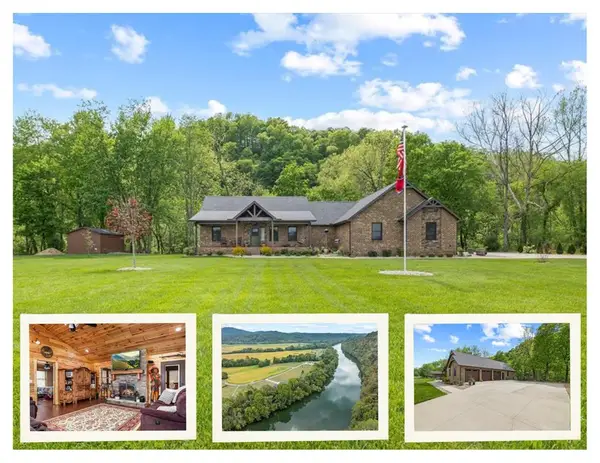 $559,000Active4 beds 3 baths2,248 sq. ft.
253 Hiawassee Ln, Celina, TN 38551
MLS# 243092Listed by: EXIT CROSS ROADS REALTY CELINA - New
 $545,000Active219.44 Acres
219.44ac Tick Ridge Road, Celina, TN 38551
MLS# 243069Listed by: CREEKSIDE REALTY - New
 $49,900Active0.7 Acres
50 Crappie Lane, Hilham, TN 38568
MLS# 3159326Listed by: EXIT CROSS ROADS REALTY COOKEVILLE - New
 $225,000Active10 Acres
10 AC Jimmy Reneau Rd, Celina, TN 38551
MLS# 243046Listed by: EXIT CROSS ROADS REALTY LIVINGSTON - New
 $170,000Active2 Acres
71A Catfish Rd, Hilham, TN 38568
MLS# 3158626Listed by: BEST REAL ESTATE ADVISORS 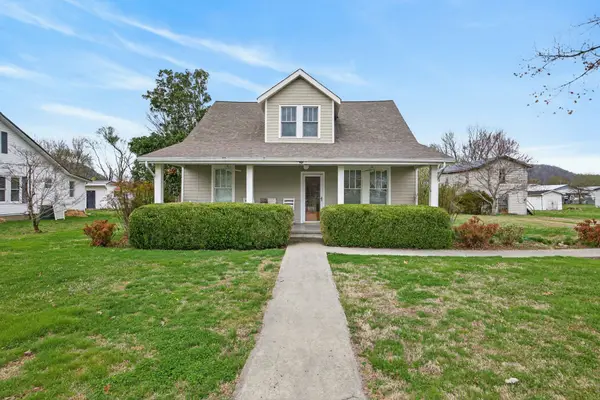 $324,929Active4 beds 2 baths2,397 sq. ft.
1385 Mitchell St, Celina, TN 38551
MLS# 3147584Listed by: SKENDER-NEWTON REALTY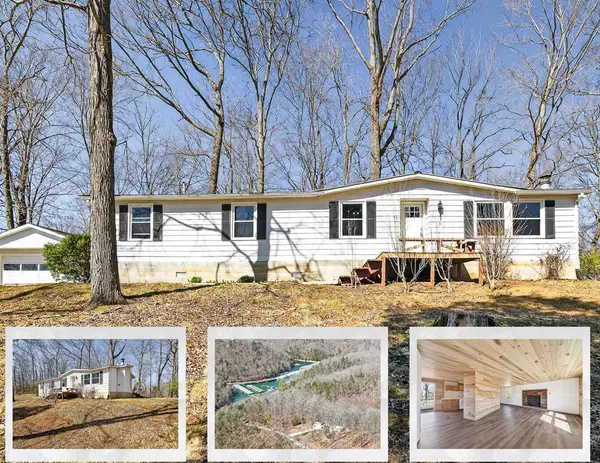 $219,000Active3 beds 2 baths1,440 sq. ft.
392 R J Bell Rd, Celina, TN 38551
MLS# 242544Listed by: EXIT CROSS ROADS REALTY LIVINGSTON $449,000Active2 beds 2 baths1,296 sq. ft.
639 Cabin Hill Rd., Celina, TN 38551
MLS# 242543Listed by: EXIT CROSS ROADS REALTY CELINA $335,400Active2 beds 2 baths1,164 sq. ft.
0 Wet Mill Creek Rd, Celina, TN 38551
MLS# 3078379Listed by: DYAD REAL ESTATE AND PROPERTY MANAGEMENT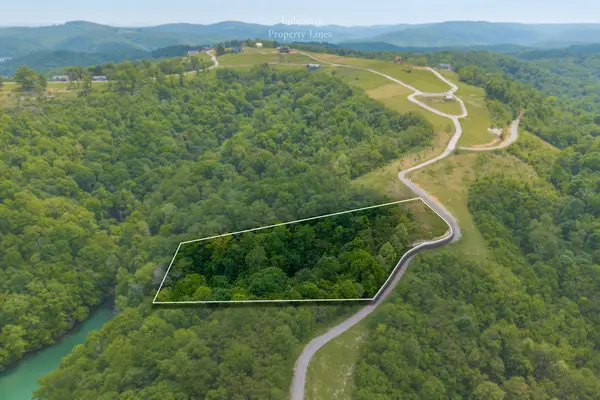
 $80,000Active1.79 Acres
0 Mallard Lane, Hilham, TN 38568
MLS# 3093672Listed by: CENTURY 21 WRIGHT REALTY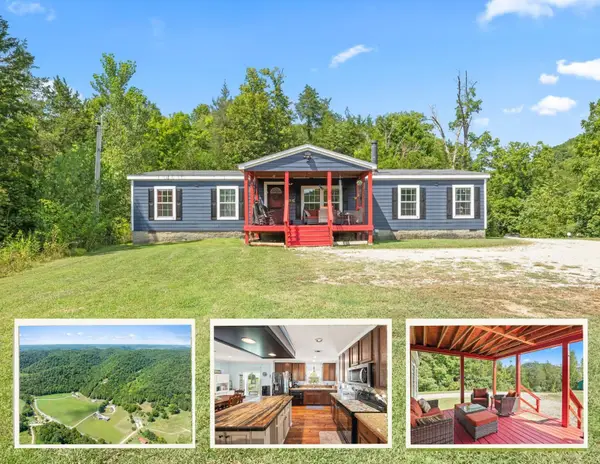 $899,950Active4 beds 2 baths1,950 sq. ft.
142 Tobe Lane, Celina, TN 38551
MLS# 3134960Listed by: EXIT CROSS ROADS REALTY CELINA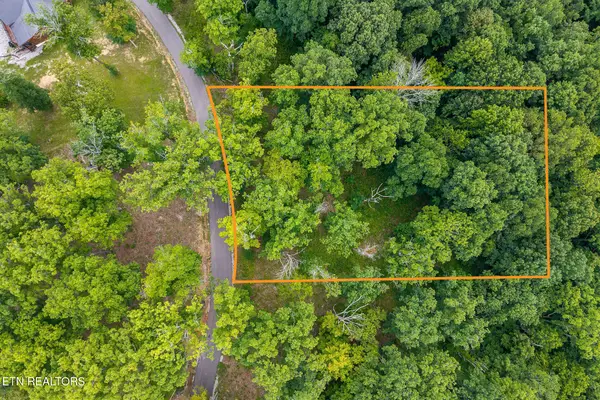 $46,500Active0.81 Acres
N Rock Fish Rd, Hilham, TN 38568
MLS# 1330332Listed by: UNITED COUNTRY REAL ESTATE TENNESSEE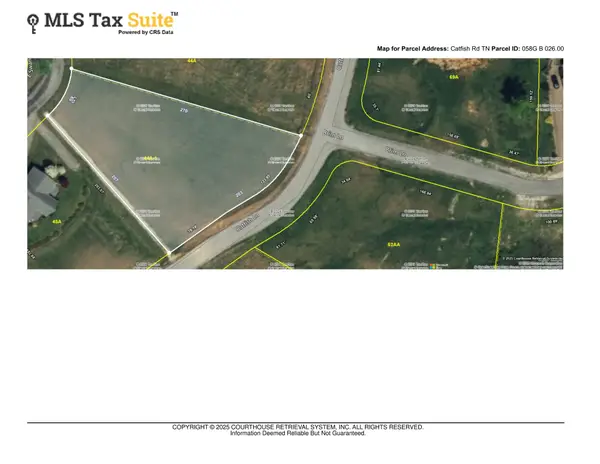 $84,900Active0.68 Acres
44A Catfish Rd, Hilham, TN 38568
MLS# 3134090Listed by: FRIDRICH & CLARK REALTY $154,900Active3 beds 1 baths984 sq. ft.
1105 Riverside Drive, Celina, TN 38551
MLS# 3134182Listed by: PROVISION REALTY GROUP $975,000Active3 beds 3 baths4,201 sq. ft.
209 N Rockfish Ln, Hilham, TN 38568
MLS# 3133873Listed by: THE REALTY FIRM $24,900Active0.56 Acres
17 D Crappie Lane, Hilham, TN 38568
MLS# 3122351Listed by: NO 1 QUALITY REALTY $78,900Active0 Acres
Lot 68B Bald Eagle Ln, Hilham, TN 38568
MLS# 241985Listed by: THE REAL ESTATE COLLECTIVE $69,929Active0.65 Acres
0 Swan Ridge Road, Hilham, TN 38568
MLS# 3117229Listed by: SKENDER-NEWTON REALTY $69,929Active0.65 Acres
Lot 2B Swan Ridge Road, Hilham, TN 38568
MLS# 241820Listed by: SKENDER-NEWTON REALTY $239,500Active2 beds 1 baths768 sq. ft.
94 Cummins Ct, Celina, TN 38551
MLS# 241760Listed by: PROVISION REALTY GROUP $119,900Active5.52 Acres
0 Cabin Hill Rd, Celina, TN 38551
MLS# 3112394Listed by: NO 1 QUALITY REALTY $119,900Active5.52 Acres
5.52ac Cabin Hill Rd, Celina, TN 38551
MLS# 241736Listed by: NO. 1 QUALITY REALTY-CELINA $179,000Active2.09 Acres
70A Catfish Road, Hilham, TN 38568
MLS# 241652Listed by: ELDER REAL ESTATE $269,900Active3 beds 2 baths1,316 sq. ft.
15 Amos Mcclerran Rd, Celina, TN 38551
MLS# 241604Listed by: THE HEARTLAND REAL ESTATE CO., LLC $393,700Active3 beds 2 baths1,568 sq. ft.
39 Old Highway 52, Celina, TN 39551
MLS# 241360Listed by: EXIT CROSS ROADS REALTY CELINA $580,000Active231.88 Acres
231.8 AC New Hope Rd, Celina, TN 38551
MLS# 224638Listed by: EXIT CROSS ROADS REALTY LIVINGSTON $185,000Active55.28 Acres
0 Cherry Ln, Celina, TN 38551
MLS# 3135280Listed by: BEYCOME BROKERAGE REALTY, LLC $500,000Active4.54 Acres
0 Rock Springs Rd Lot 107 To 111, Celina, TN 38551
MLS# 3049750Listed by: UNDERWOOD HOMETOWN REALTY, LLC $1,250,000Active-- beds -- baths
0 Rock Springs Rd Tract 13, Celina, TN 38551
MLS# 3049751Listed by: UNDERWOOD HOMETOWN REALTY, LLC $174,900Active0.62 Acres
0 Rock Fish Rd E, Hilham, TN 38568
MLS# 3058717Listed by: NO 1 QUALITY REALTY $49,900Active6.7 Acres
0 Wet Mill Creek Rd, Celina, TN 38551
MLS# 3050174Listed by: NO 1 QUALITY REALTY $49,900Active6.7 Acres
6.70ac Wet Mill Creek Rd, Celina, TN 38551
MLS# 240754Listed by: NO. 1 QUALITY REALTY-CELINA $55,000Active1.12 Acres
0 Rock Springs Rd, Celina, TN 38551
MLS# 3049749Listed by: UNDERWOOD HOMETOWN REALTY, LLC $399,000Active3 beds 2 baths1,176 sq. ft.
1749 Walker Hill Road, Celina, TN 38551
MLS# 240652Listed by: THE REAL ESTATE COLLECTIVE $100,000Active3.83 Acres
0 Turtle Lane, Hilham, TN 38568
MLS# 3042417Listed by: REDSTONE REALTY SOLUTIONS $135,000Active0.6 Acres
0 Bald Eagle Lane, Hilham, TN 38568
MLS# 1321898Listed by: THE REAL ESTATE COLLECTIVE $135,000Active0.6 Acres
0 Bald Eagle Rd, Hilham, TN 38568
MLS# 3045923Listed by: THE REAL ESTATE COLLECTIVE $135,000Active0 Acres
0 Bald Eagle Rd Lot 54b, Hilham, TN 38568
MLS# 240596Listed by: THE REAL ESTATE COLLECTIVE $79,900Active8.6 Acres
0 Moss Arcot Rd, Celina, TN 38551
MLS# 3043009Listed by: NO 1 QUALITY REALTY $259,000Active3 beds 2 baths1,400 sq. ft.
348 Bill Hunter Rd, Celina, TN 38551
MLS# 239878Listed by: NO. 1 QUALITY REALTY-CELINA $329,000Active6 beds 2 baths2,380 sq. ft.
228 Bill Hunter Rd, Celina, TN 38551
MLS# 3014767Listed by: NO 1 QUALITY REALTY $299,000Active2 beds 2 baths1,725 sq. ft.
281 Bill Hunter Rd, Celina, TN 38551
MLS# 3014810Listed by: NO 1 QUALITY REALTY $39,900Active1.59 Acres
0 Willow Grove Hwy, Allons, TN 38541
MLS# 3037797Listed by: GENE CARMAN REAL ESTATE & AUCTIONS $19,900Active0.58 Acres
0 Collins Road, Allons, TN 38541
MLS# 3037802Listed by: GENE CARMAN REAL ESTATE & AUCTIONS $125,000Active2.14 Acres
Crappie Lane, Hilham, TN 38568
MLS# 1320150Listed by: AMERICAN WAY REAL ESTATE CO. $66,900Active1.87 Acres
119 Sunfish Ln, Hilham, TN 38568
MLS# 3034901Listed by: FRIDRICH & CLARK REALTY $424,900Active4 beds 3 baths2,116 sq. ft.
450 Cedar Hill Rd, Celina, TN 38551
MLS# 240262Listed by: NO. 1 QUALITY REALTY-CELINA $37,500Active1.4 Acres
TBD Breim, Celina, TN 38568
MLS# 235541Listed by: LAKE HOMES REALTY, LLC $59,900Active0.58 Acres
0 Bald Eagle Ln, Hilham, TN 38568
MLS# 3033564Listed by: AMERICAN WAY REAL ESTATE $159,900Active2 beds 2 baths1,000 sq. ft.
218 E Lake Ave, Celina, TN 38551
MLS# 3033293Listed by: NO 1 QUALITY REALTY $59,900Active0.58 Acres
Lot 18B Bald Eagle Ln, Hilham, TN 38568
MLS# 240193Listed by: AMERICAN WAY REAL ESTATE $179,900Active3 beds 2 baths1,248 sq. ft.
126 Holly Creek Rd, Celina, TN 38551
MLS# 240179Listed by: PRIME REALTY AND AUCTION LLC $125,000Active2.14 Acres
Lot 20D Crappie Ln, Hilham, TN 38568
MLS# 240138Listed by: AMERICAN WAY REAL ESTATE $39,900Active3.54 Acres
0 Goose Road, Hilham, TN 38568
MLS# 3018188Listed by: SKENDER-NEWTON REALTY $79,500Active0.93 Acres
30 Bass Rd, Hilham, TN 38568
MLS# 3014268Listed by: EXIT CROSS ROADS REALTY COOKEVILLE $88,500Active0.62 Acres
0 Rockfish Rd, Hilham, TN 38568
MLS# 3014269Listed by: EXIT CROSS ROADS REALTY COOKEVILLE $259,900Active4 beds 2 baths1,550 sq. ft.
808 Riverside Circle, Celina, TN 38551
MLS# 239670Listed by: THE REAL ESTATE COLLECTIVE $547,000Active3 beds 2 baths2,600 sq. ft.
301 Jimmy Reneau Rd, Celina, TN 38551
MLS# 239566Listed by: FIRST REALTY COMPANY $125,000Active11.86 Acres
142C Sunfish Ln, Hilham, TN 38568
MLS# 239561Listed by: EXIT CROSS ROADS REALTY COOKEVILLE $49,900Active1.19 Acres
41B Bald Eagle Rd, Hilham, TN 38568
MLS# 239559Listed by: EXIT CROSS ROADS REALTY COOKEVILLE $74,900Active0.93 Acres
0 Rock Fish Lane, Hilham, TN 38568
MLS# 2998744Listed by: NO 1 QUALITY REALTY $74,900Active0.93 Acres
Lot 7E Rock Fish Lane, Hilham, TN 38568
MLS# 239478Listed by: NO. 1 QUALITY REALTY-CELINA $60,000Active0.46 Acres
0 Swan Ridge Road, Celina, TN 38551
MLS# 2996792Listed by: KELLER WILLIAMS REALTY DBA COOKEVILLE RE COMPANY $94,900Active0.47 Acres
0 Swan Ridge Rd, Hilham, TN 38568
MLS# 2996401Listed by: EXIT CROSS ROADS REALTY COOKEVILLE $88,500Active1.96 Acres
0 Rockfish Rd, Hilham, TN 38568
MLS# 2996423Listed by: EXIT CROSS ROADS REALTY COOKEVILLE $88,500Active1.96 Acres
20C Rockfish Rd, Hilham, TN 38568
MLS# 239046Listed by: EXIT CROSS ROADS REALTY COOKEVILLE $94,900Active0.47 Acres
Lot 15C Swan Ridge Rd, Hilham, TN 38568
MLS# 1314009Listed by: EXIT CROSS ROADS REALTY COOKEVILLE $300,000Active59.26 Acres
1551 Star Point Rd, Celina, TN 38551
MLS# 238983Listed by: THE REAL ESTATE COLLECTIVE $19,900Active1 Acres
Lot 26 Rock Springs Road, Celina, TN 38551
MLS# 25014633Listed by: MCIVER REALTY GROUP $35,000Active2.19 Acres
2.19 Ac Old Hwy 53, Celina, TN 38551
MLS# 238863Listed by: FIRST REALTY COMPANY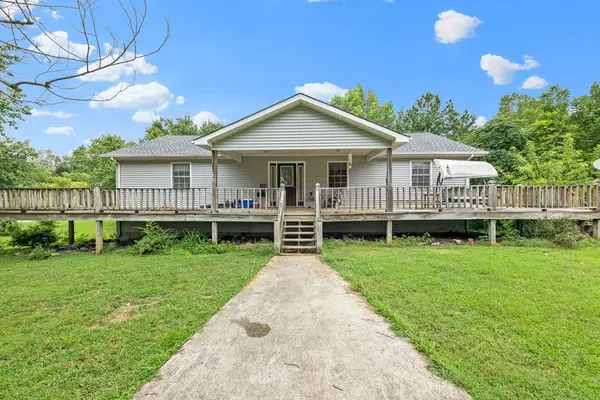 $300,000Active3 beds 3 baths2,811 sq. ft.
55 N Charles Geralds Rd, Celina, TN 38551
MLS# 238833Listed by: ELEVATE REAL ESTATE $42,000Active0.66 Acres
0 Bald Eagle Ln, Hilham, TN 38568
MLS# 2973140Listed by: EXIT CROSS ROADS REALTY COOKEVILLE $899,950Active190.22 Acres
142 Tobe Ln, Celina, TN 38551
MLS# 238675Listed by: EXIT CROSS ROADS REALTY CELINA $725,000Active137.01 Acres
4125 Dry Creek Rd, Celina, TN 38551
MLS# 2985928Listed by: CENTURY 21 PREMIER $42,000Active0.66 Acres
7D Bald Eagle Ln, Hilham, TN 38568
MLS# 238541Listed by: EXIT CROSS ROADS REALTY COOKEVILLE $32,500Active2.64 Acres
0 Old Hwy 53 S, Celina, TN 38551
MLS# 2970573Listed by: NO 1 QUALITY REALTY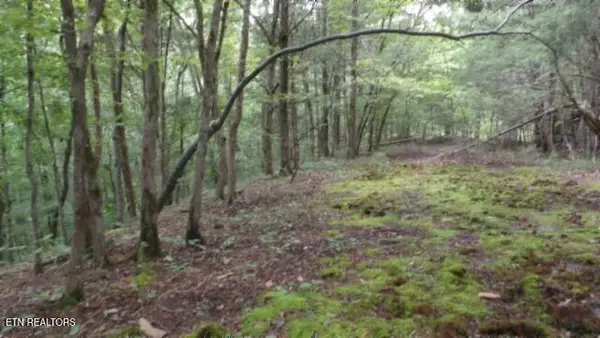 $32,500Active2.64 Acres
2.64 Old Hwy 53 S, Celina, TN 38551
MLS# 1311161Listed by: NO 1 QUALITY REALTY $169,000Active5.32 Acres
146 Copeland Ln, Celina, TN 38551
MLS# 2970232Listed by: NO 1 QUALITY REALTY $94,900Active0.87 Acres
15C Swan Ridge Rd, Hilham, TN 38568
MLS# 238464Listed by: EXIT CROSS ROADS REALTY COOKEVILLE $154,900Active1.48 Acres
0 Mallard Lane, Hilham, TN 38568
MLS# 3135236Listed by: NO 1 QUALITY REALTY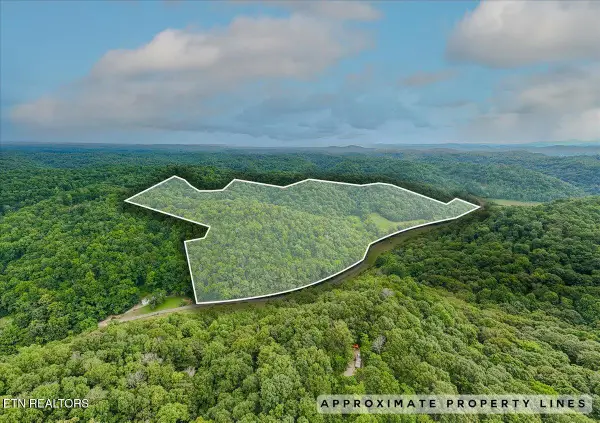 $224,900Active57.3 Acres
Knob Creek Rd, Celina, TN 38551
MLS# 1308921Listed by: EXP REALTY, LLC $24,900Active0.56 Acres
Lot 17D Crappie Lane, Hilham, TN 38562
MLS# 241994Listed by: NO. 1 QUALITY REALTY-CELINA $44,929Active0.73 Acres
0 Bass Road, Hilham, TN 38568
MLS# 2932158Listed by: SKENDER-NEWTON REALTY $44,929Active0.73 Acres
Lot 29B Bass Road, Hilham, TN 38568
MLS# 237805Listed by: SKENDER-NEWTON REALTY $46,500Active0.81 Acres
31 C Rock Fish Rd, Hilham, TN 38568
MLS# 237790Listed by: UNITED COUNTRY REAL ESTATE TENNESSEE HOME AND LAND $54,929Active1.21 Acres
0 Mallard Lane, Hilham, TN 38568
MLS# 2928433Listed by: SKENDER-NEWTON REALTY $84,000Active2.17 Acres
80B Swan Ridge, Hilham, TN 38568
MLS# 2922586Listed by: FRIDRICH & CLARK REALTY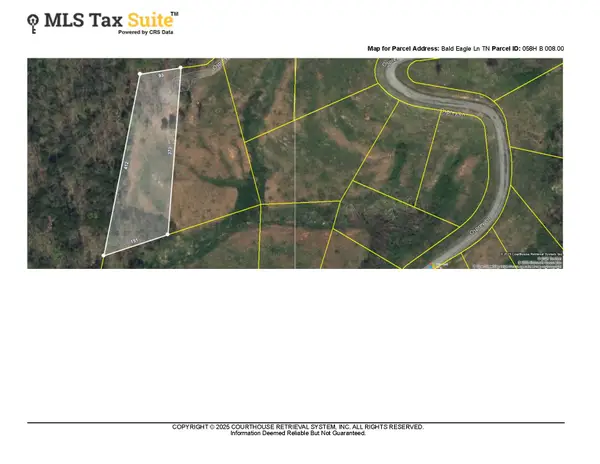 $89,500Active1.01 Acres
64B Bald Eagle, Hilham, TN 38568
MLS# 2906814Listed by: FRIDRICH & CLARK REALTY $47,500Active0.66 Acres
0 Swan Ridge Rd, Hilham, TN 38568
MLS# 2899998Listed by: ELEVATE REAL ESTATE- $179,900Active2 beds 1 baths861 sq. ft.
1004 Walnut Ave., Celina, TN 38551
MLS# 229739Listed by: THE PROPERTY COMPANY  $159,900Active5.6 Acres
5.6ac Lonnie Reese Rd, Celina, TN 38551
MLS# 236967Listed by: NO. 1 QUALITY REALTY-CELINA $79,900Active0.51 Acres
40 C Swan Ridge Rd, Hilham, TN 38568
MLS# 2899644Listed by: NO 1 QUALITY REALTY $79,900Active0.51 Acres
Lot 40C Swan Ridge Rd, Hilham, TN 38588
MLS# 236951Listed by: NO. 1 QUALITY REALTY-CELINA $57,900Active0.67 Acres
73B Swan Ridge Rd, Hilham, TN 38568
MLS# 2891435Listed by: FRIDRICH & CLARK REALTY $73,000Active0.56 Acres
82C Mallard, Hilham, TN 38568
MLS# 2867947Listed by: FRIDRICH & CLARK REALTY $259,000Active30.1 Acres
0 Highway 52 E, Celina, TN 38551
MLS# 2824856Listed by: NO 1 QUALITY REALTY $95,000Active0.8 Acres
99C Mallard Ln, Hilham, TN 38568
MLS# 2822587Listed by: FRIDRICH & CLARK REALTY $75,000Active0.8 Acres
53A Swan Ridge Rd, Hilham, TN 38568
MLS# 2819171Listed by: FRIDRICH & CLARK REALTY $120,000Active2 Acres
102C Swan Ridge, Hilham, TN 38568
MLS# 235672Listed by: LAKE HOMES REALTY, LLC $39,900Active3.54 Acres
1C & 2C Goose Road, Hilham, TN 38568
MLS# 240012Listed by: SKENDER-NEWTON REALTY $79,929Active0.61 Acres
0 Walleye Road, Hilham, TN 38568
MLS# 2813444Listed by: SKENDER-NEWTON REALTY $79,929Active0.61 Acres
Lot 62C Walleye Road, Hilham, TN 38568
MLS# 235609Listed by: SKENDER-NEWTON REALTY $799,900Active-- beds -- baths
6528 Neely Creek Rd, Celina, TN 38551
MLS# 2806260Listed by: MOSSY OAK PROPERTIES, TENNESSEE LAND & FARM, LLC $99,000Active1.37 Acres
62A Catfish Ln, Celina, TN 38551
MLS# 2805403Listed by: EPIQUE REALTY $109,900Active0 Acres
87C Mallard Rd, Hilham, TN 38568
MLS# 235179Listed by: VISION REALTY PARTNERS, LLC $89,500Active1.35 Acres
78C Swan Ridge Rd, Hilham, TN 38568
MLS# 235006Listed by: EXIT CROSS ROADS REALTY LIVINGSTON $49,900Pending0.58 Acres
0 Walleye Drive, Hilham, TN 38568
MLS# 2799238Listed by: NO 1 QUALITY REALTY $49,900Active0.58 Acres
Lot 63C Walleye Drive, Hilham, TN 38568
MLS# 234922Listed by: NO. 1 QUALITY REALTY-CELINA $69,900Active0.96 Acres
27 & 28 Hiawassee Ln, Celina, TN 38551
MLS# 234595Listed by: EXIT CROSS ROADS REALTY LIVINGSTON $99,000Active4.81 Acres
0 Goose Rd, Hilham, TN 38568
MLS# 3139123Listed by: NO 1 QUALITY REALTY $99,000Active4.81 Acres
Lot 57A Goose Rd, Hilham, TN 38568
MLS# 242555Listed by: NO. 1 QUALITY REALTY-CELINA $579,900Active3 beds 2 baths2,000 sq. ft.
2029 Holly Creek Rd, Celina, TN 38551
MLS# 3093424Listed by: BHGRE, BEN BRAY & ASSOCIATES $174,900Active0.62 Acres
Lot 27C E Rockfish Rd, Hilham, TN 38568
MLS# 1323611Listed by: NO 1 QUALITY REALTY $310,000Active2 beds 2 baths1,164 sq. ft.
0 Wet Mill Creek Rd, Celina, TN 38551
MLS# 2698458Listed by: DYAD REAL ESTATE AND PROPERTY MANAGEMENT $395,000Active3 beds 3 baths1,664 sq. ft.
0 Wet Mill Creek Rd, Celina, TN 38551
MLS# 3006189Listed by: DYAD REAL ESTATE AND PROPERTY MANAGEMENT $239,900Active1 beds 1 baths696 sq. ft.
0 Wet Mill Creek Rd, Celina, TN 38551
MLS# 3006191Listed by: DYAD REAL ESTATE AND PROPERTY MANAGEMENT $79,900Active8.6 Acres
8.60ac Moss Arcot Rd, Celina, TN 38551
MLS# 240507Listed by: NO. 1 QUALITY REALTY-CELINA $292,250Active83.5 Acres
0 Neeley Creek Rd, Celina, TN 38551
MLS# 2744710Listed by: BHGRE, BEN BRAY & ASSOCIATES $35,000Active2.19 Acres
0 Old Hwy 53, Celina, TN 38551
MLS# 2980965Listed by: FIRST REALTY CO. $464,000Active3 beds 3 baths2,676 sq. ft.
2867 Arcot Road, Celina, TN 38551
MLS# 229427Listed by: EXIT CROSS ROADS REALTY LIVINGSTON $159,900Active5.6 Acres
0 Lonnie Reecer Rd, Celina, TN 38551
MLS# 2899738Listed by: NO 1 QUALITY REALTY $159,900Active5.6 Acres
5.6 ac Lonnie Reecer Rd, Celina, TN 38551
MLS# 1303201Listed by: NO 1 QUALITY REALTY $789,900Pending4 beds 1 baths1,040 sq. ft.
2140 New Hope Rd, Celina, TN 38551
MLS# 1264070Listed by: KELLER WILLIAMS REALTY DBA CKV $64,900Active0.77 Acres
60C Walleye Rd, Hilham, TN 38568
MLS# 2923828Listed by: FRIDRICH & CLARK REALTY $79,500Active0.93 Acres
30B Bass Rd, Hilham, TN 38568
MLS# 2996393Listed by: EXIT CROSS ROADS REALTY COOKEVILLE $511,000Active146 Acres
0 Wet Mill Creek Rd, Celina, TN 38551
MLS# 226040Listed by: WHITETAIL PROPERTIES REAL ESTATE $234,900Active3 beds 3 baths3,120 sq. ft.
59 Walleye Road, Hilham, TN 38568
MLS# 2620906Listed by: NO 1 QUALITY REALTY $995,900Active4 beds 3 baths6,032 sq. ft.
3292 Moss Arcot Rd, Celina, TN 38551
MLS# 2586439Listed by: THE REALTY FIRM $75,000Active0.73 Acres
24B Bluegill Lane, Hilham, TN 38568
MLS# 2867883Listed by: FRIDRICH & CLARK REALTY $169,900Active1 beds 1 baths900 sq. ft.
18 Giavonni Ln, Celina, TN 38551
MLS# 2581616Listed by: BEN BRAY REAL ESTATE & AUCTION CO $249,900Active3 beds 2 baths1,400 sq. ft.
4179 Old Livingston Hwy, Celina, TN 38551
MLS# 239687Listed by: NO. 1 QUALITY REALTY-CELINA $164,900Active3 beds 1 baths1,960 sq. ft.
102 Riverside Ln, Celina, TN 38551
MLS# 2551928Listed by: NO 1 QUALITY REALTY $150,000Active-- beds -- baths
0 State Hwy 53 E, Celina, TN 38551
MLS# 2530835Listed by: NO 1 QUALITY REALTY $67,900Active1.87 Acres
0 Sunfish Lane, Hilham, TN 38568
MLS# 2433052Listed by: NO 1 QUALITY REALTY $79,900Active1.12 Acres
0 Goose Road, Hilham, TN 38568
MLS# 2490772Listed by: NO 1 QUALITY REALTY $289,000Active16.77 Acres
Tract A Swan Ridge Road, Hilham, TN 38568
MLS# 211426Listed by: CRYE-LEIKE REALTORS $47,500Active0.66 Acres
Lot 7C Swan Ridge Road, Hilham, TN 38568
MLS# 236948Listed by: ELEVATE REAL ESTATE
Local realty services provided by:CENTURY 21 Premier, CENTURY 21 Professional Group, CENTURY 21 Legacy, CENTURY 21 Virginia Wilder Real Estate
Popular searches near 38551
Popular neighborhoods near 38551
- Antioch, Nashville homes for sale
- Breckenridge, Crossville homes for sale
- Cloverhill, Nashville homes for sale
- Connell, Goodlettsville homes for sale
- Cumberland Cove, Mayland homes for sale
- Cumberland Homesteads, Crossville homes for sale
- Donelson, Hermitage homes for sale
- Fairvue Plantation, Gallatin homes for sale
- Five Oaks, Lebanon homes for sale
- Hickory Woods Estates, Antioch homes for sale
- Historic Old Hickory Village, Old Hickory homes for sale
- Inglewood, Nashville homes for sale
- Lake Tansi Resort, Crossville homes for sale
- Lakewood, Old Hickory homes for sale
- Madison, Madison homes for sale
- Nashboro Village, Nashville homes for sale
- Neely's Bend, Madison homes for sale
- Providence, Mount Juliet homes for sale
- Sunset View, Nashville homes for sale
- Una, Nashville homes for sale
Counties near Celina, 38551
- Adair County homes for sale
- Allen County homes for sale
- Barren County homes for sale
- Clay County homes for sale
- Clinton County homes for sale
- Cumberland County homes for sale
- DeKalb County homes for sale
- Fentress County homes for sale
- Jackson County homes for sale
- Macon County homes for sale
- Metcalfe County homes for sale
- Monroe County homes for sale
- Overton County homes for sale
- Pickett County homes for sale
- Putnam County homes for sale
- Russell County homes for sale
- Smith County homes for sale
- Trousdale County homes for sale
- Wayne County homes for sale
- White County homes for sale
Protect your home and budget from life's surprises with an Assurant Home Warranty, backed by a partner that supports you through every step of homeownership. Explore Plans.
©2026 Century 21 Real Estate LLC. All rights reserved. CENTURY 21®, the CENTURY 21 Logo and C21® are service marks owned by Century 21 Real Estate LLC. Century 21 Real Estate LLC fully supports the principles of the Fair Housing Act and the Equal Opportunity Act. Each office is independently owned and operated. Listing information is deemed reliable but not guaranteed accurate.