- Adam's Glen, Virginia Beach homes for sale
- Camelot, Chesapeake homes for sale
- College Park, Virginia Beach homes for sale
- Coventry, Virginia Beach homes for sale
- Deep Creek, Chesapeake homes for sale
- Downtown, Portsmouth homes for sale
- Glenwood Seasons, Virginia Beach homes for sale
- Great Bridge, Chesapeake homes for sale
- Greenbrier, Chesapeake homes for sale
- Historic Kempsville Area, Virginia Beach homes for sale
- Indian River, Chesapeake homes for sale
- Kempsville, Virginia Beach homes for sale
- Norfolk Highlands, Chesapeake homes for sale
- Olde Towne, Portsmouth homes for sale
- Rivercrest, Chesapeake homes for sale
- Salem, Virginia Beach homes for sale
- Salem Woods, Virginia Beach homes for sale
- South Chesapeake, Chesapeake homes for sale
- South Norfolk, Chesapeake homes for sale
- Uptown, Portsmouth homes for sale
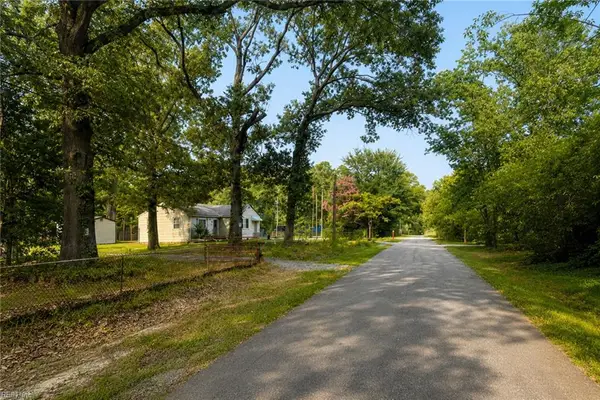
Chesapeake, VA - homes for sale
300 of 1,470 results displayed
- New
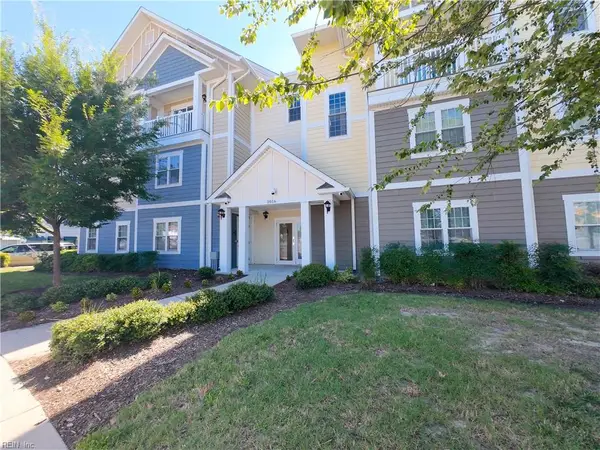
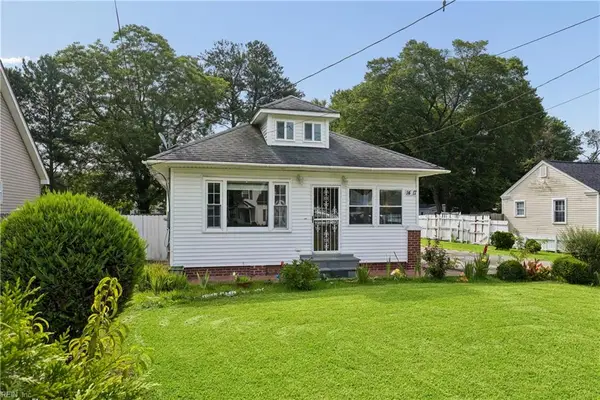
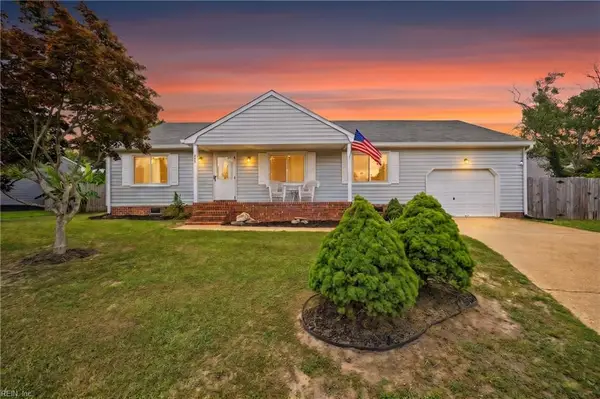
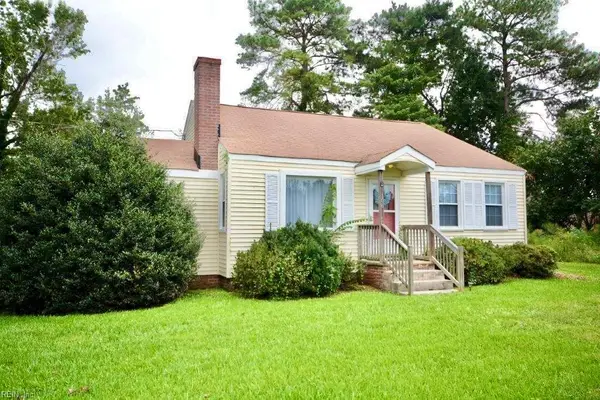
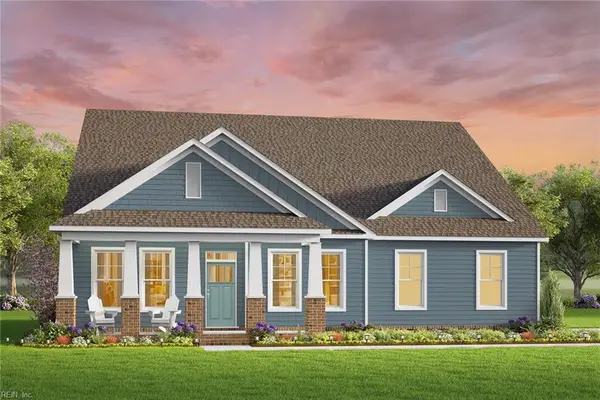
 $224,000Active2 beds 2 baths1,020 sq. ft.
3204 Clover Road E, Chesapeake, VA 23321
MLS# 10644391Listed by: Redfin Corporation - New
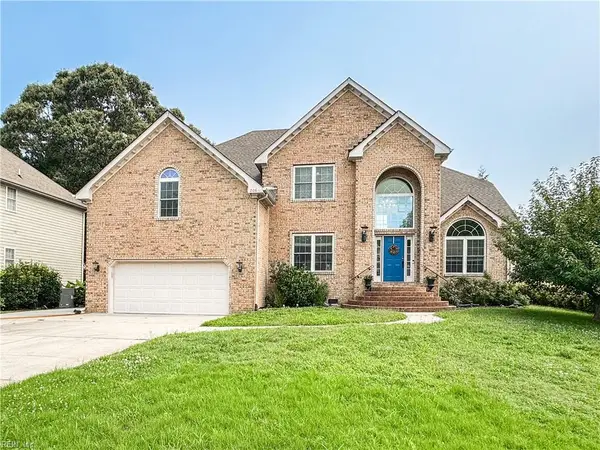
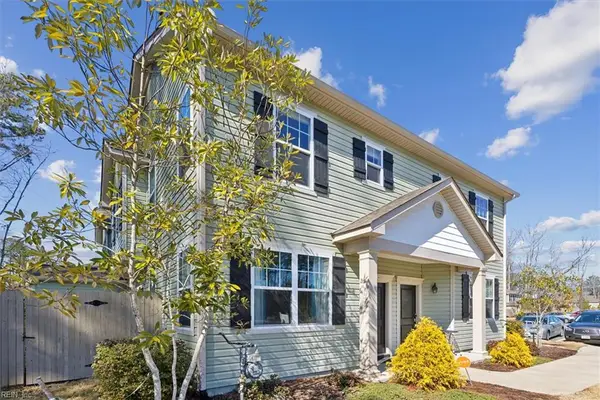
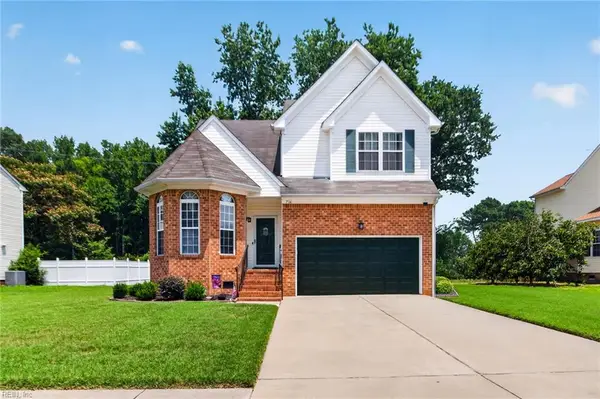
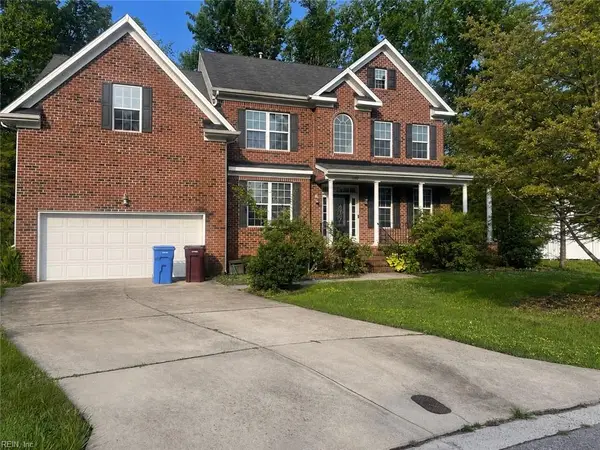
 $699,900Active5 beds 4 baths2,723 sq. ft.
410 Middleton Way, Chesapeake, VA 23322
MLS# 10644549Listed by: Howard Hanna Real Estate Svcs. - New
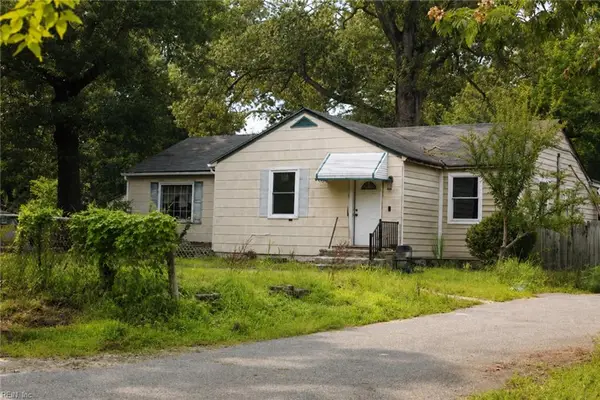
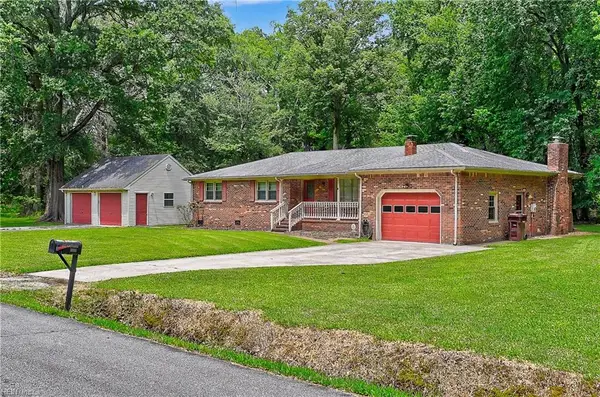
 $305,000Active4 beds 2 baths975 sq. ft.
2641 Gilmerton Road, Chesapeake, VA 23323
MLS# 10644591Listed by: BHHS RW Towne Realty - New
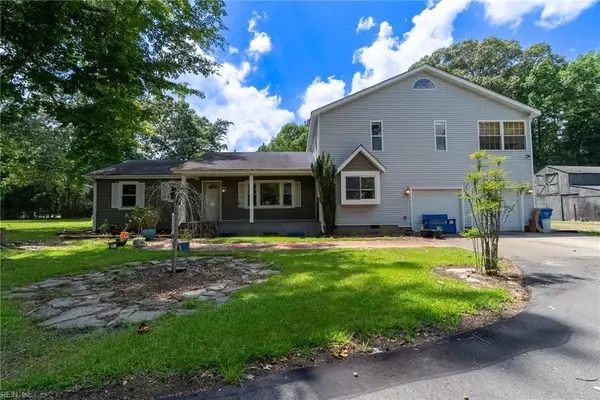
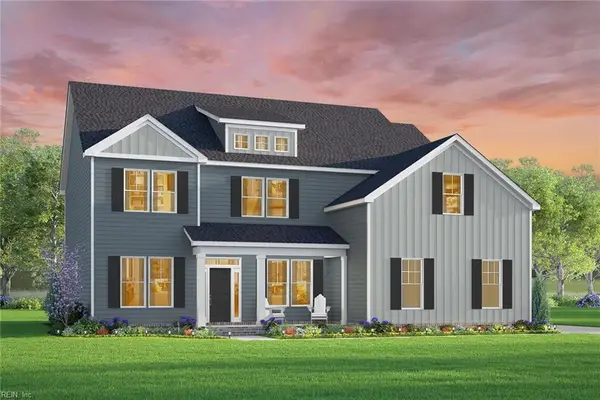
 $400,000Active4 beds 3 baths2,156 sq. ft.
4320 Schooner Trail, Chesapeake, VA 23321
MLS# 10644987Listed by: Keller Williams Realty Twn Ctr 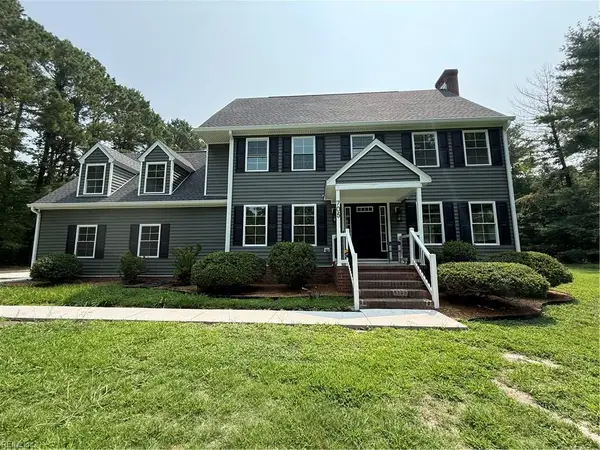 $780,000Pending4 beds 4 baths2,292 sq. ft.
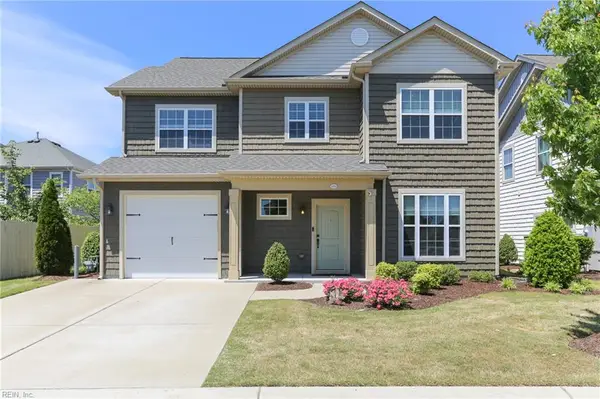
705 Pleasant Ridge Court, Chesapeake, VA 23322
MLS# 10644986Listed by: Own Real Estate LLC- New
 $370,000Active4 beds 2 baths1,437 sq. ft.
3512 Maori Drive, Chesapeake, VA 23321
MLS# 10644985Listed by: AtCoastal Realty - New
 $599,999Active4 beds 2 baths2,493 sq. ft.
913 Long Ridge Road, Chesapeake, VA 23322
MLS# 10644979Listed by: Iron Valley Real Est Norfolk - New
 $190,000Active3 beds 1 baths950 sq. ft.
341 Keith Court, Chesapeake, VA 23325
MLS# 10644947Listed by: Redefy Real Estate - New
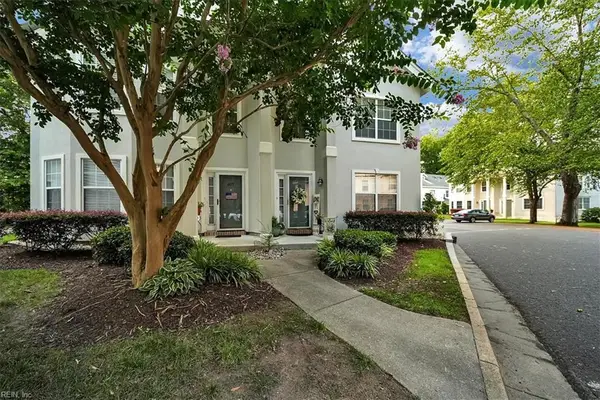
 $275,000Active2 beds 2 baths1,176 sq. ft.
800 Shenandoah River Road, Chesapeake, VA 23320
MLS# 10644809Listed by: Own Real Estate LLC - New
 $350,000Active3 beds 2 baths1,152 sq. ft.
701 Sparrow Road, Chesapeake, VA 23325
MLS# 10644956Listed by: World Class Realty - New
 $305,000Active2 beds 1 baths1,170 sq. ft.
2209 Wildwood Road, Chesapeake, VA 23323
MLS# 10644942Listed by: Creed Realty - New
 $390,000Active3 beds 3 baths1,840 sq. ft.
601 Lord Byron Court, Chesapeake, VA 23320
MLS# 10644197Listed by: Atlantic Sotheby's Intl Realty - New
 $335,000Active4 beds 2 baths1,580 sq. ft.
1217 Oleander Avenue, Chesapeake, VA 23325
MLS# 10644626Listed by: Long1 & Foster Real Estate Inc. - New
 $314,900Active3 beds 1 baths1,380 sq. ft.
1313 Willow Avenue, Chesapeake, VA 23325
MLS# 10644691Listed by: Vylla Home - New
 $360,000Active3 beds 2 baths1,139 sq. ft.
3204 Hancock Drive, Chesapeake, VA 23323
MLS# 10644772Listed by: Howard Hanna Real Estate Svcs. - New
 $542,000Active5 beds 3 baths3,300 sq. ft.
3025 Crossings Drive, Chesapeake, VA 23321
MLS# 10644796Listed by: Howard Hanna Real Estate Svcs. - New
 $550,000Active4 beds 3 baths2,380 sq. ft.
3209 Dodd Drive, Chesapeake, VA 23323
MLS# 10644867Listed by: CENTURY 21 Top Producers - New
 $215,000Active2 beds 2 baths908 sq. ft.
713 Rapidan River Court #F, Chesapeake, VA 23320
MLS# 10644875Listed by: Iron Valley Real Estate HR - New
 $355,000Active3 beds 1 baths1,264 sq. ft.
1505 Sparrow Road, Chesapeake, VA 23325
MLS# 10644878Listed by: Family First Realty Inc - New
 $660,000Active5 beds 3 baths3,490 sq. ft.
1617 Banff Court, Chesapeake, VA 23320
MLS# 2619327Listed by: EXP REALTY LLC - New
 $245,000Active2 beds 2 baths1,285 sq. ft.
1016 Thoroughgood Way #302, Chesapeake, VA 23324
MLS# 10644160Listed by: Better Homes & Gdns Ntv Am Grp - New
 $700,000Active4 beds 3 baths2,000 sq. ft.
1924 Land Of Promise Road, Chesapeake, VA 23322
MLS# 10644422Listed by: RE/MAX Alliance - New
 $609,900Active4 beds 4 baths2,850 sq. ft.
1933 Reefwood Road, Chesapeake, VA 23323
MLS# 10644569Listed by: Iron Valley Real Estate HR - New
 $289,000Active3 beds 2 baths1,112 sq. ft.
718 Osborn Avenue, Chesapeake, VA 23325
MLS# 10644701Listed by: Triumph Realty - New
 $226,900Active2 beds 2 baths1,108 sq. ft.
400 Bracknell Arch #A, Chesapeake, VA 23320
MLS# 10644713Listed by: Coldwell Banker Premier - New
 $499,900Active8 beds 3 baths2,020 sq. ft.
3248 Battlefield Blvd S Boulevard S, Chesapeake, VA 23322
MLS# 10644718Listed by: The Real Estate Group - New
 $399,900Active3 beds 3 baths1,668 sq. ft.
432 Charleston Street, Chesapeake, VA 23322
MLS# 10644759Listed by: Seaside Realty - Open Sat, 12 to 2pmNew
 $495,000Active4 beds 3 baths2,390 sq. ft.
2016 Sunset Maple Lane, Chesapeake, VA 23323
MLS# 10644765Listed by: 1st Class RealEstate Integrity - New
 $325,000Active3 beds 2 baths1,554 sq. ft.
772 Shell Road, Chesapeake, VA 23323
MLS# 10644798Listed by: Davis & Reed Realty - New
 $719,000Active5 beds 3 baths3,469 sq. ft.
1228 Rosebud Lane, Chesapeake, VA 23322
MLS# 10644835Listed by: LPT Realty LLC - New
 $539,900Active4 beds 3 baths2,068 sq. ft.
1221 Rosebud Lane, Chesapeake, VA 23322
MLS# 10644845Listed by: The Real Estate Group - New
 $231,900Active3 beds 2 baths1,152 sq. ft.
919 Decatur Street, Chesapeake, VA 23324
MLS# 10644864Listed by: Benham Real Estate LLC - New
 $650,000Active2.59 Acres
2004 Girard Avenue, Chesapeake, VA 23323
MLS# 10644685Listed by: RE/MAX Ultra - New
 $325,000Active3 beds 1 baths1,668 sq. ft.
2008 Girard Avenue, Chesapeake, VA 23323
MLS# 10644687Listed by: RE/MAX Ultra - New
 $825,000Active5 beds 3 baths4,160 sq. ft.
208 Leicester Court, Chesapeake, VA 23322
MLS# 10644737Listed by: Davis & Reed Realty - New
 $329,500Active3 beds 3 baths1,776 sq. ft.
605 Sail Fish Quay, Chesapeake, VA 23320
MLS# 10644249Listed by: BHHS RW Towne Realty - New
 $300,000Active3 beds 1 baths1,026 sq. ft.
3601 Dunedin Court, Chesapeake, VA 23321
MLS# 10644439Listed by: Own Real Estate LLC - New
 $565,000Active4 beds 3 baths2,405 sq. ft.
1008 Chalbourne Drive, Chesapeake, VA 23322
MLS# 10644474Listed by: Atlantic Connection Real Est. - New
 $594,900Active4 beds 3 baths2,760 sq. ft.
1305 Forest Point Drive, Chesapeake, VA 23320
MLS# 10644498Listed by: RE/MAX Prime - New
 $595,000Active4 beds 3 baths2,482 sq. ft.
909 Wheatfield Way, Chesapeake, VA 23320
MLS# 10644529Listed by: CENTURY 21 Nachman Realty - New
 $299,900Active2 beds 3 baths1,334 sq. ft.
1313 Quail Creek Hollow #C, Chesapeake, VA 23320
MLS# 10644570Listed by: BHHS RW Towne Realty - New
 $514,900Active4 beds 3 baths2,032 sq. ft.
120 Taxus Street, Chesapeake, VA 23320
MLS# 10644597Listed by: The Real Estate Group - New
 $539,900Active4 beds 4 baths2,316 sq. ft.
1837 Honey Milk Road, Chesapeake, VA 23323
MLS# 10644619Listed by: Wainwright Real Estate - New
 $440,000Active3 beds 2 baths1,705 sq. ft.
208 Woodford Drive, Chesapeake, VA 23322
MLS# 10644688Listed by: The Real Estate Group - New
 $545,000Active4 beds 3 baths2,203 sq. ft.
526 Strathmore Lane, Chesapeake, VA 23322
MLS# 10644692Listed by: The Real Estate Group - New
 $675,000Active4 beds 3 baths3,286 sq. ft.
5045 Annapolis Drive, Chesapeake, VA 23321
MLS# 10644708Listed by: World Class Realty - New
 $425,000Active3 beds 2 baths1,536 sq. ft.
1212 Santeetlah Avenue, Chesapeake, VA 23325
MLS# 10644727Listed by: RE/MAX Allegiance - New
 $415,000Active3 beds 2 baths1,508 sq. ft.
2829 Forehand Drive, Chesapeake, VA 23323
MLS# 10644736Listed by: BHHS RW Towne Realty - New
 $815,000Active5 beds 4 baths3,331 sq. ft.
2504 Calabria Dr Drive, Chesapeake, VA 23323
MLS# 10644739Listed by: Real Broker LLC - New
 $499,900Active4 beds 3 baths2,621 sq. ft.
4257 Meadow Wood Drive, Chesapeake, VA 23321
MLS# 10644750Listed by: The Real Estate Group - New
 $749,900Active5 beds 3 baths3,433 sq. ft.
928 Sydenham Boulevard, Chesapeake, VA 23322
MLS# 10644769Listed by: RE/MAX Alliance - New
 $265,000Active2 beds 2 baths1,064 sq. ft.
1056 Still Harbor Circle, Chesapeake, VA 23320
MLS# 10644494Listed by: Own Real Estate LLC - New
 $999,985Active6 beds 4 baths4,090 sq. ft.
1324 Simon Drive, Chesapeake, VA 23320
MLS# 10642034Listed by: Allison James Estates & Homes - New
 $559,900Active4 beds 3 baths2,020 sq. ft.
1505 Hilltop Drive, Chesapeake, VA 23322
MLS# 10643811Listed by: The Real Estate Group - New
 $439,900Active3 beds 2 baths1,602 sq. ft.
4013 Belvedere Drive, Chesapeake, VA 23321
MLS# 10643820Listed by: BHHS RW Towne Realty - New
 $685,000Active5 beds 3 baths3,200 sq. ft.
810 Hedgerow Court, Chesapeake, VA 23322
MLS# 10643877Listed by: BHHS RW Towne Realty - New
 $500,000Active4 beds 3 baths1,926 sq. ft.
901 Lela Lane, Chesapeake, VA 23322
MLS# 10643980Listed by: BHHS RW Towne Realty - New
 $700,000Active5 beds 3 baths2,976 sq. ft.
1131 Madison Lynn Way, Chesapeake, VA 23322
MLS# 10644005Listed by: Real Broker LLC - New
 $285,000Active3 beds 1 baths950 sq. ft.
4000 Kilbride Drive, Chesapeake, VA 23325
MLS# 10644177Listed by: Wainwright Real Estate - New
 $1,299,997Active4 beds 3 baths4,356 sq. ft.
1741 Taft Road, Chesapeake, VA 23322
MLS# 10644328Listed by: Atlantic Sothebys Int'l Realty - New
 $239,000Active2 beds 2 baths1,236 sq. ft.
724 Sail Fish Quay, Chesapeake, VA 23320
MLS# 10644533Listed by: LPT Realty LLC - New
 $259,900Active2 beds 1 baths1,014 sq. ft.
1120 Byrd Avenue, Chesapeake, VA 23324
MLS# 10644666Listed by: Howard Hanna Real Estate Svcs. - New
 $414,900Active3 beds 3 baths1,654 sq. ft.
MM Railroad (pullman), Chesapeake, VA 23324
MLS# 10644403Listed by: BHHS RW Towne Realty - New
 $539,999Active4 beds 3 baths2,542 sq. ft.
2216 Hampton Roads Parkway, Chesapeake, VA 23321
MLS# 10644558Listed by: Keller Williams Town Center - New
 $310,000Active3 beds 2 baths1,128 sq. ft.
817 Dana Dr Drive, Chesapeake, VA 23321
MLS# 10644587Listed by: COVA Home Realty - New
 $324,900Active3 beds 3 baths1,500 sq. ft.
1416 Martin Avenue, Chesapeake, VA 23324
MLS# 10644659Listed by: Own Real Estate LLC - New
 $389,000Active4 beds 2 baths1,700 sq. ft.
1421 Glendale Avenue, Chesapeake, VA 23323
MLS# 10644668Listed by: RE/MAX Ultra - New
 $450,000Active3 beds 4 baths2,140 sq. ft.
433 Asuza Street, Chesapeake, VA 23323
MLS# 10644557Listed by: Iron Valley Real Est. Prestige - New
 $345,900Active2 beds 3 baths1,464 sq. ft.
4987 Boone Road, Chesapeake, VA 23321
MLS# 10644649Listed by: Corinth Realty LLC - New
 $650,000Active6 beds 3 baths3,188 sq. ft.
4026 Scotfield Drive, Chesapeake, VA 23321
MLS# 10644555Listed by: BHHS RW Towne Realty - New
 $315,000Active3 beds 3 baths1,472 sq. ft.
626 South Lake Circle, Chesapeake, VA 23322
MLS# 10644227Listed by: Wainwright Real Estate - New
 $524,900Active4 beds 2 baths1,650 sq. ft.
403 Caravelle Court N, Chesapeake, VA 23322
MLS# 10644453Listed by: Own Real Estate LLC - New
 $793,267Active5 beds 3 baths2,888 sq. ft.
212 Kwanzan Court, Chesapeake, VA 23322
MLS# 10644581Listed by: BHHS RW Towne Realty - New
 $227,500Active2 beds 2 baths1,326 sq. ft.
4301 Colindale Road #208, Chesapeake, VA 23321
MLS# 10643973Listed by: Atlantic Sothebys Int'l Realty - New
 $449,000Active3 beds 3 baths2,513 sq. ft.
3106 Lantern Place, Chesapeake, VA 23321
MLS# 10644169Listed by: Realty Source - New
 $273,851Active2 beds 1 baths1,025 sq. ft.
449 E Lake Circle, Chesapeake, VA 23322
MLS# 10644283Listed by: COVA Home Realty - New
 $599,000Active5 beds 3 baths2,600 sq. ft.
785 Caddie Street, Chesapeake, VA 23322
MLS# 10644309Listed by: BHHS RW Towne Realty - New
 $210,000Active2 beds 3 baths1,163 sq. ft.
802 Primrose Lane, Chesapeake, VA 23320
MLS# 10644311Listed by: BHHS RW Towne Realty - New
 $329,900Active3 beds 2 baths1,350 sq. ft.
1941 Lockard Avenue, Chesapeake, VA 23320
MLS# 10644430Listed by: Keller Williams Capital Props. - New
 $428,000Active3 beds 2 baths1,584 sq. ft.
4321 Ballahack Road, Chesapeake, VA 23322
MLS# 10644472Listed by: KW Coastal Virginia Chesapeake - New
 $240,000Active3 beds 1 baths917 sq. ft.
1245 Great Bridge Boulevard, Chesapeake, VA 23320
MLS# 10644499Listed by: NextHome Tidewater Realty - New
 $689,000Active5 beds 3 baths3,383 sq. ft.
1118 Fairway Drive, Chesapeake, VA 23320
MLS# 10644518Listed by: Cottage Street Realty LLC - New
 $332,000Active3 beds 2 baths1,276 sq. ft.
703 Laurel Avenue, Chesapeake, VA 23325
MLS# 10644421Listed by: EXP Realty LLC - New
 $229,900Active3 beds 1 baths950 sq. ft.
508 Stalham Road, Chesapeake, VA 23325
MLS# 10644192Listed by: Better Homes & Gdns Ntv Am Grp - New
 $795,000Active6 beds 4 baths3,955 sq. ft.
804 River Strand, Chesapeake, VA 23320
MLS# 10643149Listed by: Frank Mangum Realty Inc. - New
 $820,000Active5 beds 3 baths3,018 sq. ft.
1932 Foxwood Drive, Chesapeake, VA 23323
MLS# 10643909Listed by: Real Broker LLC - New
 $190,000Active2 beds 3 baths1,254 sq. ft.
747 Ridge Circle, Chesapeake, VA 23320
MLS# 2619195Listed by: EXP REALTY, LLC - New
 $655,000Active4 beds 3 baths2,681 sq. ft.
2101 Beeblossom Lane, Chesapeake, VA 23323
MLS# 10644442Listed by: Redfin Corporation - New
 $319,000Active2 beds 3 baths2,790 sq. ft.
2462 Leytonstone Drive, Chesapeake, VA 23321
MLS# 10644448Listed by: Atlantic Coast Realty Corp - New
 $375,000Active3 beds 2 baths1,500 sq. ft.
2400 Portal Road, Chesapeake, VA 23324
MLS# 10644322Listed by: COVA Home Realty - New
 $235,000Active2 beds 2 baths989 sq. ft.
709 Rapidan River Court #D, Chesapeake, VA 23320
MLS# 10644371Listed by: Howard Hanna Real Estate Svcs. - Coming Soon
 $275,000Coming Soon3 beds 2 baths
3136 Joseph Avenue, Chesapeake, VA 23324
MLS# 2619100Listed by: RIVER CITY ELITE PROPERTIES - REAL BROKER - New
 $380,000Active5 beds 4 baths2,354 sq. ft.
1417 Gust Lane, Chesapeake, VA 23323
MLS# 10644206Listed by: BHHS RW Towne Realty - New
 $300,000Active4 beds 3 baths1,932 sq. ft.
1912 Dawnee Brook Trail S, Chesapeake, VA 23320
MLS# 10644310Listed by: Iron Valley Real Est. Prestige - New
 $260,000Active-- beds -- baths2,409 sq. ft.
4112 Williamson Street, Chesapeake, VA 23324
MLS# 10644377Listed by: BHHS RW Towne Realty - New
 $639,990Active5 beds 3 baths2,718 sq. ft.
212 Tinker Street, Chesapeake, VA 23322
MLS# 10644366Listed by: BHHS RW Towne Realty - New
 $439,900Active4 beds 2 baths1,864 sq. ft.
4117 Hawksley Drive, Chesapeake, VA 23321
MLS# 10644168Listed by: The Real Estate Group - New
 $449,900Active5 beds 3 baths1,862 sq. ft.
1813 A Hoover Avenue, Chesapeake, VA 23324
MLS# 10644316Listed by: BHHS RW Towne Realty  $340,000Pending4 beds 3 baths1,860 sq. ft.
209 Mendel Court, Chesapeake, VA 23324
MLS# 10644324Listed by: Own Real Estate LLC- New
 $375,000Active3 beds 2 baths1,593 sq. ft.
1109 Hearthstone Landing, Chesapeake, VA 23320
MLS# 10644346Listed by: RE/MAX Allegiance - New
 $335,000Active4 beds 2 baths1,420 sq. ft.
4321 Fontana Court, Chesapeake, VA 23325
MLS# 10644133Listed by: Real Broker LLC - New
 $565,000Active4 beds 3 baths2,300 sq. ft.
1217 Willow Lakes Court, Chesapeake, VA 23321
MLS# 10644284Listed by: The Real Estate Group - New
 $300,000Active2 beds 2 baths1,141 sq. ft.
1311 Eagles Path Trace Path #A, Chesapeake, VA 23320
MLS# 10644330Listed by: Explore Coastal Virginia Homes Inc. - New
 $775,000Active5 beds 5 baths3,583 sq. ft.
1833 Benefit Road, Chesapeake, VA 23322
MLS# 10642808Listed by: Gibbs Realty Group - New
 $709,900Active5 beds 3 baths3,304 sq. ft.
908 Bahama Way, Chesapeake, VA 23322
MLS# 10644122Listed by: 1st Class Real Estate Elevate - New
 $450,000Active5 beds 3 baths3,166 sq. ft.
700 Canoe Street, Chesapeake, VA 23323
MLS# 10644216Listed by: Keller Williams Coastal VA Norfolk - New
 $506,990Active2 beds 2 baths1,462 sq. ft.
2150 Edwin Drive, Chesapeake, VA 23322
MLS# 10644247Listed by: D R Horton Realty of Virginia - New
 $577,740Active3 beds 3 baths2,642 sq. ft.
2164 Edwin Drive, Chesapeake, VA 23322
MLS# 10644251Listed by: D R Horton Realty of Virginia - New
 $485,000Active3 beds 3 baths1,982 sq. ft.
1915 Canning Place, Chesapeake, VA 23322
MLS# 10643511Listed by: BHHS RW Towne Realty - New
 $916,000Active3 beds 3 baths2,734 sq. ft.
109 Ballahack Road, Chesapeake, VA 23322
MLS# 10643968Listed by: Wainwright Real Estate - New
 $389,900Active4 beds 4 baths1,950 sq. ft.
2532 Lanier Street, Chesapeake, VA 23324
MLS# 10644173Listed by: A Better Way Realty Inc. - New
 $549,900Active4 beds 3 baths2,375 sq. ft.
3240 Conservancy Drive, Chesapeake, VA 23323
MLS# 10644218Listed by: Iron Valley Real Estate HR - New
 $650,000Active4 beds 4 baths2,295 sq. ft.
1125 Beaver Dam Road, Chesapeake, VA 23322
MLS# 10642922Listed by: Atlantic Sothebys Int'l Realty - New
 $399,990Active3 beds 2 baths1,607 sq. ft.
3433 Martin Johnson Road, Chesapeake, VA 23323
MLS# 10643999Listed by: RE/MAX Prime - New
 $465,000Active4 beds 2 baths1,480 sq. ft.
814 Gloss Street, Chesapeake, VA 23322
MLS# 10644129Listed by: COVA Home Realty - New
 $277,000Active3 beds 3 baths1,275 sq. ft.
1806 Beckwood Common, Chesapeake, VA 23320
MLS# 10644053Listed by: Judy Boone Realty Inc. - New
 $360,000Active2 beds 1 baths1,128 sq. ft.
3124 Old Mill Road, Chesapeake, VA 23323
MLS# 10644104Listed by: World Class Realty & Prop Mgmt  $69,000Pending0.53 Acres
13 Truitt Road, Chesapeake, VA 23321
MLS# 10643941Listed by: CENTURY 21 Nachman Realty $69,000Pending0.53 Acres
14 Truitt Road, Chesapeake, VA 23321
MLS# 10643945Listed by: CENTURY 21 Nachman Realty- New
 $1,069,417Active5 beds 4 baths3,570 sq. ft.
2861 Raccoon Trail, Chesapeake, VA 23322
MLS# 10643118Listed by: AtCoastal Realty - New
 $359,900Active3 beds 2 baths1,544 sq. ft.
4000 Coffman Boulevard, Chesapeake, VA 23321
MLS# 10643791Listed by: Reeds Real Estate LLC - Open Sat, 12 to 2pmNew
 $449,900Active4 beds 3 baths2,880 sq. ft.
4605 Longleaf Place, Chesapeake, VA 23321
MLS# 10644044Listed by: BHHS RW Towne Realty - New
 $440,000Active3 beds 2 baths1,341 sq. ft.
4309 East Road, Chesapeake, VA 23321
MLS# 10644034Listed by: Judy Boone Realty Inc. - New
 $464,900Active4 beds 3 baths2,032 sq. ft.
1724 A English Avenue, Chesapeake, VA 23320
MLS# 10643910Listed by: The Real Estate Group - New
 $399,900Active4 beds 3 baths2,279 sq. ft.
904 Levee Court, Chesapeake, VA 23323
MLS# 10643939Listed by: BHHS RW Towne Realty - New
 $299,000Active2 beds 2 baths1,360 sq. ft.
746 Sendero Court, Chesapeake, VA 23322
MLS# 10643917Listed by: The Real Estate Group - New
 $284,000Active2 beds 3 baths1,314 sq. ft.
2806 Baldwin Drive, Chesapeake, VA 23321
MLS# 10643295Listed by: BHHS RW Towne Realty  $290,000Pending3 beds 2 baths1,978 sq. ft.
4116 Emberhill Lane Lane, Chesapeake, VA 23321
MLS# 10643898Listed by: Boyd Realty Partners- New
 $380,000Active3 beds 3 baths1,810 sq. ft.
1615 Thomason Trail, Chesapeake, VA 23320
MLS# 10643889Listed by: Swell Real Estate Co - New
 $549,000Active4 beds 3 baths2,150 sq. ft.
1025 Ramsgate Lane, Chesapeake, VA 23322
MLS# 10642714Listed by: Real Broker LLC - New
 $420,000Active4 beds 3 baths1,710 sq. ft.
560 Denver Avenue, Chesapeake, VA 23322
MLS# 10643689Listed by: BHHS RW Towne Realty - New
 $550,000Active4 beds 3 baths2,317 sq. ft.
905 Rosana Court, Chesapeake, VA 23322
MLS# 10643802Listed by: RE/MAX Alliance - New
 $310,000Active4 beds 2 baths1,092 sq. ft.
1817 Sparrow Road, Chesapeake, VA 23320
MLS# 10643848Listed by: Opulent Realty LLC - New
 $288,500Active3 beds 1 baths1,100 sq. ft.
106 Greenbrier Road, Chesapeake, VA 23320
MLS# 10642393Listed by: Keller Williams Realty Twn Ctr 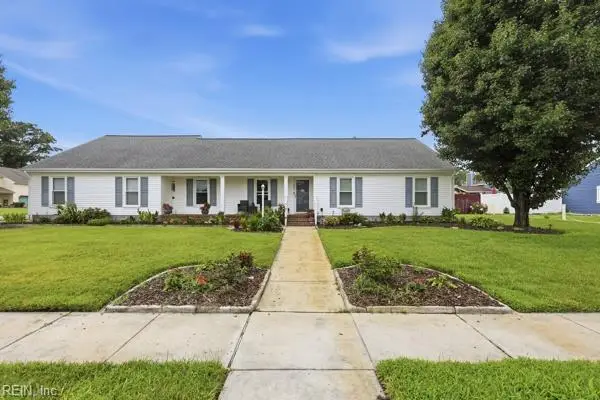 $425,000Pending4 beds 2 baths2,148 sq. ft.
500 N Hills Drive, Chesapeake, VA 23320
MLS# 10642702Listed by: KW Coastal Virginia Chesapeake- New
 $459,900Active3 beds 2 baths1,782 sq. ft.
3600 Martin Johnson Road #RD, Chesapeake, VA 23323
MLS# 10642749Listed by: The Real Estate Group - New
 $580,000Active4 beds 3 baths3,072 sq. ft.
2600 Saint Brides Road W, Chesapeake, VA 23322
MLS# 10642916Listed by: Atlantic Sothebys Int'l Realty  $540,000Pending4 beds 2 baths2,046 sq. ft.
233 Downing Drive, Chesapeake, VA 23322
MLS# 10642998Listed by: NextHome Tidewater Realty $499,000Pending4 beds 3 baths2,430 sq. ft.
3309 Mapleton Crescent, Chesapeake, VA 23321
MLS# 10643359Listed by: EXP Realty LLC- New
 $560,000Active4 beds 3 baths2,366 sq. ft.
424 Pines Of Warrick Drive, Chesapeake, VA 23322
MLS# 10643841Listed by: Own Real Estate LLC - New
 $265,000Active2 beds 1 baths700 sq. ft.
2317 Wildwood Road, Chesapeake, VA 23323
MLS# 10643751Listed by: A Better Way Realty Inc. - New
 $590,000Active4 beds 3 baths2,872 sq. ft.
700 Turnbuckle Court, Chesapeake, VA 23322
MLS# 10643821Listed by: The Real Estate Group - New
 $700,000Active4 beds 4 baths3,077 sq. ft.
701 Aspen Forest Court, Chesapeake, VA 23322
MLS# 10643713Listed by: Long1 & Foster Real Estate Inc. - New
 $255,000Active3 beds 1 baths1,092 sq. ft.
1230 Myrtle Ave Avenue, Chesapeake, VA 23325
MLS# 10643780Listed by: Iron Valley Real Est. Prestige - New
 $756,000Active6 beds 3 baths3,525 sq. ft.
909 Brice Court, Chesapeake, VA 23322
MLS# 10643666Listed by: Aweigh Real Estate - New
 $649,999Active5 beds 3 baths2,500 sq. ft.
2116 Cedar Road, Chesapeake, VA 23323
MLS# 10643675Listed by: EXP Realty LLC - New
 $485,000Active3 beds 2 baths1,727 sq. ft.
1420 Carrolton Way #91, Chesapeake, VA 23320
MLS# 10643765Listed by: The Real Estate Group - New
 $749,999Active5 beds 3 baths3,436 sq. ft.
145 Sinclair Lane, Chesapeake, VA 23322
MLS# 10643547Listed by: Focus Realty LLC - New
 $410,000Active3 beds 2 baths1,455 sq. ft.
209 Rose Ash Way, Chesapeake, VA 23320
MLS# 10643754Listed by: Howard Hanna Real Estate Svcs. - New
 $385,000Active3 beds 2 baths1,681 sq. ft.
4017 Belvedere Drive, Chesapeake, VA 23321
MLS# 10642824Listed by: The Real Estate Group - New
 $275,000Active4 beds 2 baths1,550 sq. ft.
1321 Seaboard Avenue, Chesapeake, VA 23324
MLS# 10643283Listed by: World Class Realty & Prop Mgmt - New
 $650,000Active4 beds 3 baths3,017 sq. ft.
104 Bella Drive, Chesapeake, VA 23322
MLS# 10643512Listed by: Wainwright Real Estate - New
 $320,000Active3 beds 2 baths1,248 sq. ft.
1323 Ormer Road, Chesapeake, VA 23325
MLS# 10643699Listed by: Abrams Realty - New
 $649,900Active4 beds 3 baths2,913 sq. ft.
2217 Nantucket Avenue, Chesapeake, VA 23321
MLS# 10643711Listed by: Corinth Realty LLC - New
 $560,000Active5 beds 4 baths2,905 sq. ft.
2851 Crossings Drive, Chesapeake, VA 23321
MLS# 10642155Listed by: BHHS RW Towne Realty - New
 $239,900Active2 beds 1 baths940 sq. ft.
497 Cobblewood Bend, Chesapeake, VA 23320
MLS# 10643240Listed by: Real Broker LLC - New
 $540,000Active4 beds 2 baths1,736 sq. ft.
858 Waters Road, Chesapeake, VA 23322
MLS# 10643319Listed by: RE/MAX Allegiance - New
 $389,900Active4 beds 3 baths1,740 sq. ft.
4100 3rd Street, Chesapeake, VA 23324
MLS# 10643372Listed by: Long1 & Foster Real Estate Inc. - New
 $550,000Active4 beds 3 baths2,574 sq. ft.
2720 Deerfield Crescent, Chesapeake, VA 23321
MLS# 10643469Listed by: ONYX Realty Professionals LLC - New
 $988,613Active4 beds 4 baths3,424 sq. ft.
2116 Sanderson Road, Chesapeake, VA 23322
MLS# 10643550Listed by: AtCoastal Realty - New
 $325,000Active3 beds 3 baths1,400 sq. ft.
719 Creekside Crescent, Chesapeake, VA 23320
MLS# 10643661Listed by: Atlantic Realty&Prop Mgmt Grp - New
 $894,595Active5 beds 3 baths3,026 sq. ft.
2857 Raccoon Trail, Chesapeake, VA 23322
MLS# 10643669Listed by: AtCoastal Realty - New
 $574,900Active4 beds 3 baths2,340 sq. ft.
716 Tallahassee Drive, Chesapeake, VA 23322
MLS# 10643678Listed by: Iron Valley Real Estate HR - New
 $997,724Active5 beds 5 baths3,585 sq. ft.
1533 Sanderson Road, Chesapeake, VA 23322
MLS# 10643679Listed by: AtCoastal Realty - New
 $575,000Active4 beds 3 baths2,530 sq. ft.
1910 Bexley Lane, Chesapeake, VA 23322
MLS# 10643685Listed by: 1st Class Real Estate Flagship - New
 $550,000Active3 beds 2 baths2,065 sq. ft.
1010 Weeping Willow Drive, Chesapeake, VA 23322
MLS# 10643701Listed by: Own Real Estate LLC - New
 $565,000Active5 beds 3 baths3,229 sq. ft.
4308 Galston Court, Chesapeake, VA 23321
MLS# 10642758Listed by: The Real Estate Group - New
 $440,000Active6 beds 3 baths2,657 sq. ft.
421 Plummer Drive, Chesapeake, VA 23323
MLS# 10643653Listed by: COVA Home Realty - New
 $310,000Active3 beds 2 baths1,716 sq. ft.
609 Crystal Avenue, Chesapeake, VA 23324
MLS# 10643657Listed by: Iron Valley Real Estate HR - New
 $379,900Active3 beds 2 baths1,976 sq. ft.
420 Oaklette Drive, Chesapeake, VA 23325
MLS# 10643565Listed by: Coastal Real Estate & Auction Group LLC  $813,162Pending4 beds 3 baths2,691 sq. ft.
209 Kwanzan Court, Chesapeake, VA 23323
MLS# 10643598Listed by: BHHS RW Towne Realty- New
 $275,000Active2 beds 2 baths1,292 sq. ft.
824 Nottaway Drive, Chesapeake, VA 23320
MLS# 10643623Listed by: Real Broker LLC - New
 $350,000Active3 beds 3 baths2,199 sq. ft.
143 Harbor Watch Drive, Chesapeake, VA 23320
MLS# 10643626Listed by: Atlantic Sothebys Int'l Realty - New
 $315,000Active2 beds 3 baths1,352 sq. ft.
316 Esplanade Place, Chesapeake, VA 23320
MLS# 10643193Listed by: North Star Real Estate Inc. - New
 $255,000Active2 beds 3 baths1,168 sq. ft.
1002 Willow Green Court, Chesapeake, VA 23320
MLS# 10643204Listed by: BHHS RW Towne Realty - New
 $399,999Active4 beds 2 baths2,186 sq. ft.
2600 Janson Drive, Chesapeake, VA 23321
MLS# 10643337Listed by: Swell Real Estate Co - New
 $389,000Active3 beds 3 baths1,835 sq. ft.
1425 Otterbourne Circle, Chesapeake, VA 23320
MLS# 10643380Listed by: Atlantic Sothebys Int'l Realty - New
 $314,900Active3 beds 1 baths1,014 sq. ft.
1303 Yeadon Road, Chesapeake, VA 23324
MLS# 10643542Listed by: BHHS RW Towne Realty - New
 $695,000Active4 beds 3 baths2,552 sq. ft.
MM Madison 2, Chesapeake, VA 23322
MLS# 10643617Listed by: BHHS RW Towne Realty - New
 $609,900Active4 beds 3 baths2,651 sq. ft.
829 Donnington Drive, Chesapeake, VA 23322
MLS# 10643428Listed by: Creed Realty - New
 $875,000Active4 beds 4 baths3,200 sq. ft.
2025 Hallmark Way, Chesapeake, VA 23323
MLS# 10643488Listed by: BHHS RW Towne Realty - New
 $595,900Active3 beds 4 baths2,500 sq. ft.
904 Koonce Ln, Chesapeake, VA 23322
MLS# 10643518Listed by: BHHS RW Towne Realty - New
 $545,900Active3 beds 4 baths2,200 sq. ft.
900 Jennings Ln, Chesapeake, VA 23322
MLS# 10643529Listed by: BHHS RW Towne Realty - New
 $525,900Active3 beds 4 baths2,200 sq. ft.
904 Jennings Ln, Chesapeake, VA 23322
MLS# 10643531Listed by: BHHS RW Towne Realty - New
 $374,900Active3 beds 2 baths1,472 sq. ft.
4207 Neptune Avenue, Chesapeake, VA 23325
MLS# 10643551Listed by: Prodigy Realty - New
 $374,900Active4 beds 2 baths1,877 sq. ft.
905 Shillelagh Road, Chesapeake, VA 23323
MLS# 10643554Listed by: Own Real Estate LLC - New
 $445,000Active3 beds 3 baths1,881 sq. ft.
927 Thatcher Way, Chesapeake, VA 23320
MLS# 10643564Listed by: Better Homes & Gdns Ntv Am Grp - New
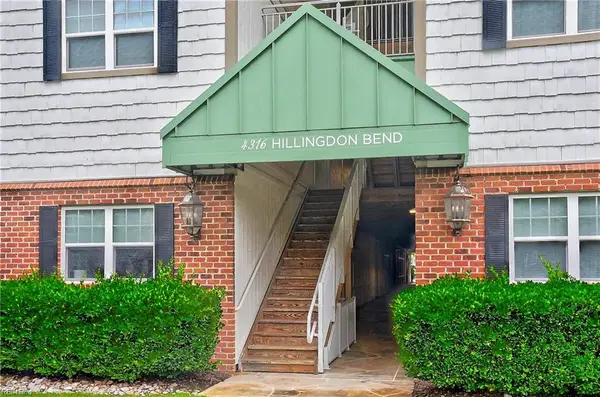 $225,000Active2 beds 2 baths1,362 sq. ft.
4316 Hillingdon Bend #305, Chesapeake, VA 23321
MLS# 10643135Listed by: The Real Estate Group - New
 $615,000Active3 beds 3 baths2,389 sq. ft.
712 Appalachian Court, Chesapeake, VA 23320
MLS# 10643390Listed by: United Atlantic Realty - New
 $700,000Active4 beds 3 baths2,948 sq. ft.
1116 Tundrah Court, Chesapeake, VA 23323
MLS# 10643450Listed by: Atlantic Sothebys Int'l Realty - New
 $510,000Active4 beds 3 baths2,127 sq. ft.
513 Simpson Lane, Chesapeake, VA 23323
MLS# 10643453Listed by: Own Real Estate LLC - New
 $429,900Active4 beds 2 baths2,300 sq. ft.
224 Essex Drive, Chesapeake, VA 23320
MLS# 10643538Listed by: Campbell Realty - New
 $414,900Active4 beds 2 baths1,735 sq. ft.
1920 Ames Circle W, Chesapeake, VA 23321
MLS# 10643474Listed by: RE/MAX Allegiance - New
 $330,000Active3 beds 3 baths1,860 sq. ft.
1608 Cullen Avenue, Chesapeake, VA 23324
MLS# 10643504Listed by: Keller Williams Realty Twn Ctr - New
 $405,000Active3 beds 3 baths1,870 sq. ft.
5247 Lombard Street, Chesapeake, VA 23321
MLS# 10643505Listed by: Iron Valley Real Est. Prestige - New
 $385,000Active4 beds 3 baths1,674 sq. ft.
3403 Bernies Court S, Chesapeake, VA 23321
MLS# 10642590Listed by: Own Real Estate LLC  $295,000Pending2 beds 2 baths1,350 sq. ft.
807 Rivanna River Reach, Chesapeake, VA 23320
MLS# 10642919Listed by: Keller Williams Capital Props.- New
 $298,000Active2 beds 2 baths1,136 sq. ft.
300 San Roman Drive, Chesapeake, VA 23322
MLS# 10642955Listed by: The Real Estate Group - New
 $605,000Active4 beds 3 baths2,529 sq. ft.
508 Cavendish Way, Chesapeake, VA 23322
MLS# 10642996Listed by: BHHS RW Towne Realty - New
 $369,000Active3 beds 3 baths1,804 sq. ft.
432 Autumn Green Lane, Chesapeake, VA 23320
MLS# 10643081Listed by: The Real Estate Group - New
 $1,104,938Active4 beds 4 baths3,637 sq. ft.
2801 Raccoon Trail, Chesapeake, VA 23322
MLS# 10643126Listed by: AtCoastal Realty - New
 $374,900Active4 beds 2 baths1,233 sq. ft.
1089 Saint Julian Drive, Chesapeake, VA 23323
MLS# 10643138Listed by: Atlantic Sothebys Int'l Realty - New
 $630,000Active5 beds 3 baths3,200 sq. ft.
1202 Copper Knoll Lane, Chesapeake, VA 23320
MLS# 10643153Listed by: KW Coastal Chesapeake Virginia - New
 $599,990Active4 beds 3 baths3,000 sq. ft.
913 Montebello Circle, Chesapeake, VA 23322
MLS# 10643196Listed by: Atlantic Sothebys Int'l Realty - New
 $235,000Active3 beds 1 baths950 sq. ft.
2916 Berkley Avenue, Chesapeake, VA 23325
MLS# 10643272Listed by: Howard Hanna Real Estate Svcs. - New
 $720,000Active5 beds 3 baths3,157 sq. ft.
1932 Ferguson Loop, Chesapeake, VA 23322
MLS# 10643367Listed by: BHHS RW Towne Realty - New
 $418,000Active5 beds 4 baths2,497 sq. ft.
1706 Martin Avenue Avenue, Chesapeake, VA 23324
MLS# 10643431Listed by: Keller Williams Realty Twn Ctr - New
 $439,900Active4 beds 3 baths1,800 sq. ft.
2521 Southern Pines Drive, Chesapeake, VA 23323
MLS# 10643438Listed by: Howard Hanna Real Estate Svcs. - New
 $320,000Active3 beds 3 baths1,610 sq. ft.
709 Montrose Court, Chesapeake, VA 23320
MLS# 10643459Listed by: United Country - A B Cole&Asc - New
 $669,900Active4 beds 3 baths2,401 sq. ft.
141 Indian Creek Road, Chesapeake, VA 23322
MLS# 10643473Listed by: KW Coastal Virginia Chesapeake - New
 $285,000Active2 beds 3 baths1,456 sq. ft.
503 Nesbit Drive, Chesapeake, VA 23323
MLS# 10643199Listed by: EXP Realty LLC  $515,000Active4 beds 3 baths2,018 sq. ft.
801 Winter King Court, Chesapeake, VA 23323
MLS# 10641783Listed by: Creed Realty $375,000Active3 beds 3 baths1,750 sq. ft.
2415 Fieldsway Dr, Chesapeake, VA 23320
MLS# 10641971Listed by: Real Broker LLC $975,000Active5 beds 6 baths4,680 sq. ft.
3000 Miars Green, Chesapeake, VA 23321
MLS# 10642217Listed by: VA Realty Professionals $309,000Active3 beds 3 baths1,571 sq. ft.
1404 River Birch Run, Chesapeake, VA 23320
MLS# 10642451Listed by: BHHS RW Towne Realty $999,999Active6 beds 4 baths4,700 sq. ft.
821 Redleafe Circle, Chesapeake, VA 23320
MLS# 10642513Listed by: LPT Realty LLC $950,000Active5 beds 4 baths3,806 sq. ft.
129 Greengable Way, Chesapeake, VA 23322
MLS# 10642562Listed by: The Agency $545,000Active4 beds 3 baths2,233 sq. ft.
909 Cantor Street, Chesapeake, VA 23322
MLS# 10642683Listed by: Howard Hanna Real Estate Svcs. $285,000Active2 beds 3 baths1,329 sq. ft.
2314 Alcott Way, Chesapeake, VA 23321
MLS# 10643393Listed by: Triumph Realty $410,000Active3 beds 3 baths1,924 sq. ft.
640 Sweet Leaf Place, Chesapeake, VA 23320
MLS# 10643082Listed by: Focus Realty LLC $335,000Active3 beds 3 baths1,478 sq. ft.
2833 Estella Way, Chesapeake, VA 23325
MLS# 10643331Listed by: 1st Class Real Estate Flagship $775,000Active4 beds 3 baths3,801 sq. ft.
3808 Stonebridge Landing, Chesapeake, VA 23321
MLS# 10643343Listed by: BHHS RW Towne Realty $50,000Active0.07 Acres
1316 20th Street, Chesapeake, VA 23324
MLS# 10643091Listed by: Better Homes & Gdns Ntv Am Grp $524,900Active3 beds 3 baths2,538 sq. ft.
1016 Briars Landing Landing, Chesapeake, VA 23320
MLS# 10643243Listed by: Howard Hanna Real Estate Svcs. $234,900Active2 beds 1 baths920 sq. ft.
844 Wickford Drive, Chesapeake, VA 23320
MLS# 10643302Listed by: Howard Hanna Real Estate Svcs.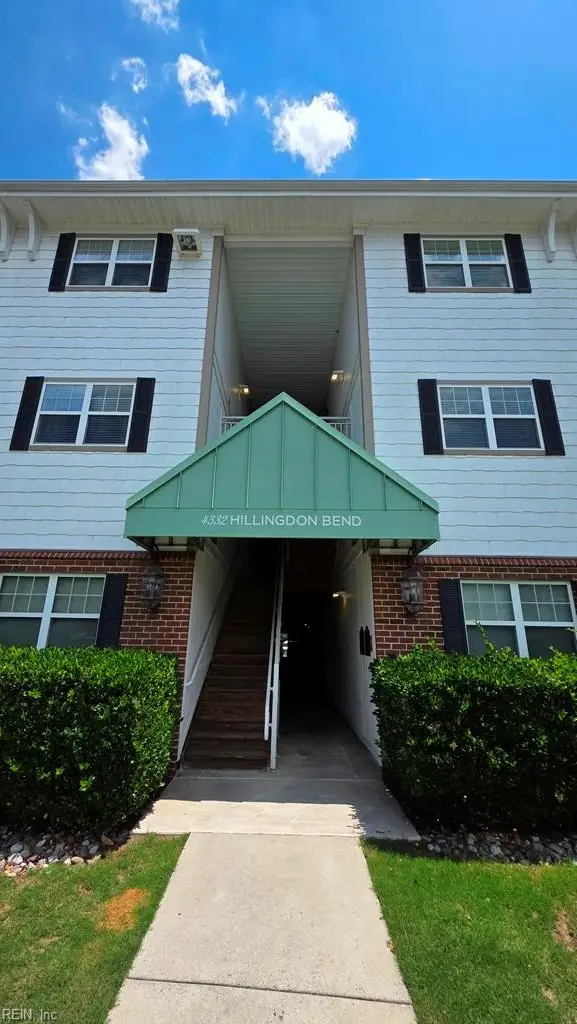 $239,900Active2 beds 2 baths1,367 sq. ft.
4332 Hillingdon Bend #206, Chesapeake, VA 23321
MLS# 10643303Listed by: Verian Realty $699,000Active5 beds 3 baths3,036 sq. ft.
707 River Gate Court, Chesapeake, VA 23322
MLS# 10642890Listed by: CENTURY 21 Nachman Realty $250,000Active3 beds 1 baths1,408 sq. ft.
2420 Payne Road, Chesapeake, VA 23323
MLS# 10642992Listed by: 1st Class Real Estate Flagship $729,000Active4 beds 3 baths3,060 sq. ft.
1740 Land Of Promise Rd Road, Chesapeake, VA 23322
MLS# 10643077Listed by: Swell Real Estate Co $499,500Active4 beds 2 baths2,108 sq. ft.
257 Coachman Drive, Chesapeake, VA 23325
MLS# 10643133Listed by: Swell Realty Co $615,000Active3 beds 3 baths2,569 sq. ft.
103 Ashley Road, Chesapeake, VA 23322
MLS# 10643157Listed by: KFinCo Realty $345,000Active3 beds 2 baths1,462 sq. ft.
3036 Bomar Drive, Chesapeake, VA 23321
MLS# 10643168Listed by: The Real Estate Group $435,000Active3 beds 3 baths1,870 sq. ft.
1219 Granton Terrace, Chesapeake, VA 23322
MLS# 10643172Listed by: The Real Estate Group $270,000Pending3 beds 2 baths1,284 sq. ft.
405 Cobblewood Arch Arch, Chesapeake, VA 23320
MLS# 10643227Listed by: RE/MAX Allegiance $375,000Active4 beds 3 baths1,456 sq. ft.
4416 Greendell Road, Chesapeake, VA 23321
MLS# 10643180Listed by: Iron Valley Real Est. Prestige $245,000Active2 beds 2 baths1,100 sq. ft.
700 New River Court #C, Chesapeake, VA 23320
MLS# 10642730Listed by: Iron Valley Real Est Norfolk $369,500Active3 beds 3 baths1,423 sq. ft.
732 Fallcreek Run, Chesapeake, VA 23322
MLS# 10642744Listed by: World Class Realty & Prop Mgmt- Open Sat, 10am to 12pm
 $285,000Active3 beds 1 baths960 sq. ft.
3115 Hornsea Road, Chesapeake, VA 23320
MLS# 10643176Listed by: EXP Realty LLC  $239,900Active3 beds 2 baths1,268 sq. ft.
824 Huntly Drive, Chesapeake, VA 23320
MLS# 10643144Listed by: Keffer Realty $925,000Active7 beds 4 baths3,786 sq. ft.
537 Margaret Drive, Chesapeake, VA 23322
MLS# 10643086Listed by: Prodigy Realty $435,000Active4 beds 2 baths2,315 sq. ft.
2113 Quaker Place, Chesapeake, VA 23325
MLS# 10643102Listed by: BHHS RW Towne Realty $949,608Active4 beds 4 baths3,185 sq. ft.
1516 Cedarville Court, Chesapeake, VA 23322
MLS# 10643106Listed by: AtCoastal Realty $289,500Active3 beds 2 baths1,188 sq. ft.
1232 Stewart Street, Chesapeake, VA 23324
MLS# 10643125Listed by: Swell Realty Co $479,000Active4 beds 2 baths1,813 sq. ft.
804 Greenspring Court, Chesapeake, VA 23322
MLS# 10642873Listed by: BHHS RW Towne Realty $372,000Active4 beds 2 baths1,950 sq. ft.
1107 Sean Drive, Chesapeake, VA 23323
MLS# 10642985Listed by: Coldwell Banker Premier $350,000Active4 beds 3 baths2,272 sq. ft.
4209 Quailshire Court, Chesapeake, VA 23321
MLS# 10643022Listed by: ONYX Realty Professionals LLC $289,900Pending4 beds 3 baths1,460 sq. ft.
1236 Damyien Arch, Chesapeake, VA 23320
MLS# 10642966Listed by: Rucker Realty LLC $320,000Active3 beds 2 baths1,207 sq. ft.
1605 Laurel Avenue, Chesapeake, VA 23325
MLS# 10642961Listed by: Own Real Estate LLC $499,900Pending5 beds 3 baths2,642 sq. ft.
3626 Point Elizabeth Drive, Chesapeake, VA 23321
MLS# 10642167Listed by: Cross Realty $375,000Pending5 beds 3 baths2,363 sq. ft.
1620 Great Bridge Boulevard, Chesapeake, VA 23320
MLS# 10642924Listed by: Davis & Reed Realty $300,000Active3 beds 3 baths1,556 sq. ft.
744 Hunters Quay Quay, Chesapeake, VA 23320
MLS# 10642912Listed by: Iron Valley Real Est Norfolk $230,000Active2 beds 2 baths1,037 sq. ft.
1214 Loose Strife Place, Chesapeake, VA 23320
MLS# 10642377Listed by: RE/MAX Alliance $309,900Active3 beds 3 baths1,488 sq. ft.
1 Bristol Circle, Chesapeake, VA 23320
MLS# 10642783Listed by: RE/MAX Allegiance $509,000Active4 beds 3 baths2,121 sq. ft.
405 S Monterey Drive, Chesapeake, VA 23320
MLS# 10642834Listed by: BHHS RW Towne Realty $550,000Active4 beds 2 baths2,064 sq. ft.
529 Royal Grant Drive, Chesapeake, VA 23322
MLS# 10642398Listed by: The Real Estate Group $365,000Active3 beds 3 baths1,760 sq. ft.
706 Albertine Court, Chesapeake, VA 23320
MLS# 10642611Listed by: CENTURY 21 Nachman Realty $469,000Active4 beds 4 baths2,177 sq. ft.
1803 Honey Milk Road, Chesapeake, VA 23323
MLS# 10642809Listed by: The Real Estate Group $135,000Pending2 beds 1 baths870 sq. ft.
1025 Calloway Avenue, Chesapeake, VA 23324
MLS# 10642815Listed by: BHHS RW Towne Realty $450,000Active3 beds 2 baths1,386 sq. ft.
4633 Indiana Avenue, Chesapeake, VA 23321
MLS# 10642760Listed by: Howard Hanna Real Estate Svcs. $775,000Active5 beds 3 baths4,200 sq. ft.
112 Station Road, Chesapeake, VA 23322
MLS# 10642786Listed by: The Real Estate Group $1,750,000Active4 beds 4 baths5,707 sq. ft.
2505 Sylvia Court, Chesapeake, VA 23322
MLS# 10642797Listed by: Byler Realty $260,000Active3 beds 2 baths1,245 sq. ft.
4605 Woodmark Trail, Chesapeake, VA 23321
MLS# 10642754Listed by: ERA Real Estate Professionals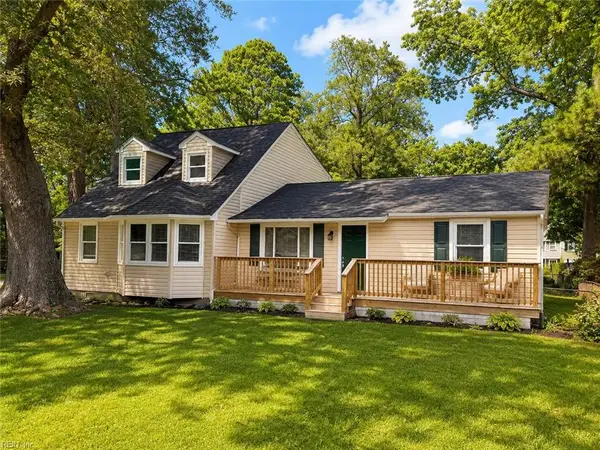 $400,000Active4 beds 2 baths1,887 sq. ft.
700 Cardover Avenue, Chesapeake, VA 23325
MLS# 10642623Listed by: Keller Williams Capital Props.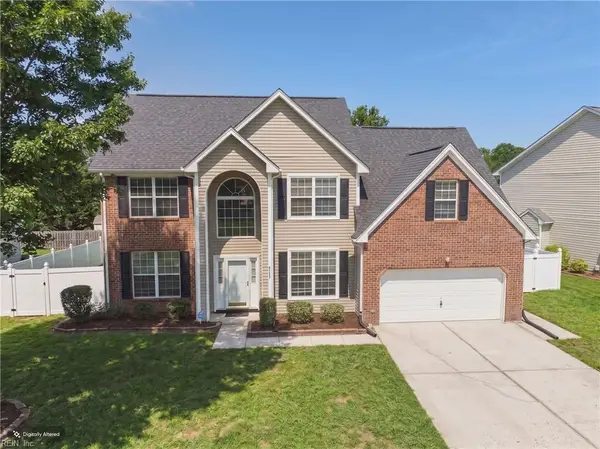 $534,900Pending5 beds 3 baths2,384 sq. ft.
2428 Annie Circle, Chesapeake, VA 23323
MLS# 10642746Listed by: Thrive Realty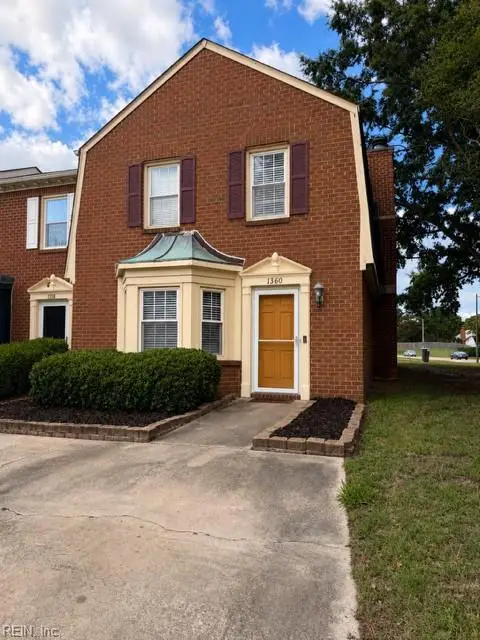 $315,000Active3 beds 2 baths1,301 sq. ft.
1360 Mill Lake Quarter, Chesapeake, VA 23320
MLS# 10642736Listed by: Legacy Builders Realty Group $259,999Active3 beds 2 baths1,462 sq. ft.
2510 King Court, Chesapeake, VA 23324
MLS# 10642025Listed by: Coalesce Real Estate Inc $335,000Active3 beds 3 baths1,862 sq. ft.
1513 Braishfield Court, Chesapeake, VA 23320
MLS# 10642721Listed by: Keller Williams Town Center $348,000Pending3 beds 3 baths1,976 sq. ft.
1216 Chesapeake Avenue, Chesapeake, VA 23324
MLS# 10642723Listed by: Realty of America LLC $459,000Active3 beds 3 baths1,584 sq. ft.
440 Fleming Circle, Chesapeake, VA 23323
MLS# 10642666Listed by: Iron Valley Real Est Norfolk $639,000Active4 beds 3 baths2,192 sq. ft.
2828 Seven Eleven Road, Chesapeake, VA 23322
MLS# 10642673Listed by: KW Coastal Virginia Chesapeake $495,000Active4 beds 3 baths2,329 sq. ft.
3614 Elkton Drive, Chesapeake, VA 23321
MLS# 10641167Listed by: The Real Estate Group $219,900Active2 beds 1 baths1,016 sq. ft.
909 Decatur Street, Chesapeake, VA 23324
MLS# 10641590Listed by: AtCoastal Realty $470,000Active4 beds 3 baths2,103 sq. ft.
500 Landmark Court, Chesapeake, VA 23322
MLS# 10642136Listed by: Long1 & Foster Real Estate Inc. $889,000Active3 beds 2 baths2,863 sq. ft.
2410 Centerville Turnpike, Chesapeake, VA 23322
MLS# 10642255Listed by: Own Real Estate LLC $560,000Active4 beds 3 baths2,631 sq. ft.
4704 Wood Stork Drive, Chesapeake, VA 23321
MLS# 10642654Listed by: EXP Realty LLC $590,000Active4 beds 3 baths2,600 sq. ft.
1045 Winchester Way, Chesapeake, VA 23320
MLS# 10642649Listed by: Swell Real Estate Co $335,000Active-- beds -- baths1,799 sq. ft.
2216 Decatur Street, Chesapeake, VA 23324
MLS# 10642651Listed by: Own Real Estate LLC $624,900Active4 beds 3 baths2,211 sq. ft.
1229 Waters Road, Chesapeake, VA 23322
MLS# 10641071Listed by: Howard Hanna Real Estate Svcs. $499,000Active4 beds 3 baths2,339 sq. ft.
1028 Austin Drive, Chesapeake, VA 23320
MLS# 10642093Listed by: Howard Hanna Real Estate Svcs. $570,000Active5 beds 3 baths2,992 sq. ft.
1213 Lakeford Place, Chesapeake, VA 23322
MLS# 10642122Listed by: The Real Estate Group $725,000Active5 beds 3 baths2,811 sq. ft.
136 Bella Drive, Chesapeake, VA 23322
MLS# 10642237Listed by: Keller Williams Town Center $554,500Active4 beds 4 baths2,510 sq. ft.
3421 Anita Circle, Chesapeake, VA 23321
MLS# 10642380Listed by: Light Box Realty $624,900Active6 beds 5 baths4,500 sq. ft.
501 Thornloe Ln Lane, Chesapeake, VA 23320
MLS# 10642445Listed by: Redfin Corporation $452,900Active3 beds 4 baths2,044 sq. ft.
4904 Apricot Way, Chesapeake, VA 23321
MLS# 10642448Listed by: Corinth Realty LLC $399,800Active4 beds 2 baths2,150 sq. ft.
4205 Nautilus Avenue, Chesapeake, VA 23325
MLS# 10642460Listed by: Redfin Corporation $499,999Active5 beds 3 baths2,267 sq. ft.
517 Whisper Walk, Chesapeake, VA 23322
MLS# 10642464Listed by: RE/MAX Allegiance $370,000Active4 beds 3 baths1,994 sq. ft.
1601 Thomason Trail, Chesapeake, VA 23320
MLS# 10642424Listed by: Swell Realty Co $630,000Pending4 beds 3 baths2,700 sq. ft.
923 Blackthorne Dr, Chesapeake, VA 23322
MLS# 10642546Listed by: COVA Home Realty $535,000Active4 beds 2 baths1,831 sq. ft.
940 Saddleback Trail, Chesapeake, VA 23320
MLS# 10642565Listed by: Howard Hanna Real Estate Svcs. $229,999Active2 beds 2 baths1,326 sq. ft.
4332 Hillingdon Bend #208, Chesapeake, VA 23321
MLS# 10642575Listed by: EXIT Realty Central $249,900Active3 beds 1 baths975 sq. ft.
1003 White Pine Drive, Chesapeake, VA 23323
MLS# 10642530Listed by: BHHS RW Towne Realty $569,900Active5 beds 3 baths2,431 sq. ft.
529 Wittington Drive, Chesapeake, VA 23322
MLS# 2618053Listed by: THE GREENE REALTY GROUP $385,000Active3 beds 3 baths1,592 sq. ft.
208 Oak Grove Run, Chesapeake, VA 23320
MLS# 10642308Listed by: Dominion Property Management $844,900Pending4 beds 3 baths3,207 sq. ft.
1307 Old Coach Road, Chesapeake, VA 23322
MLS# 10641127Listed by: RE/MAX Alliance $640,000Active4 beds 3 baths2,518 sq. ft.
445 Middleton Way, Chesapeake, VA 23322
MLS# 10641989Listed by: Better Homes & Gdns Ntv Am Grp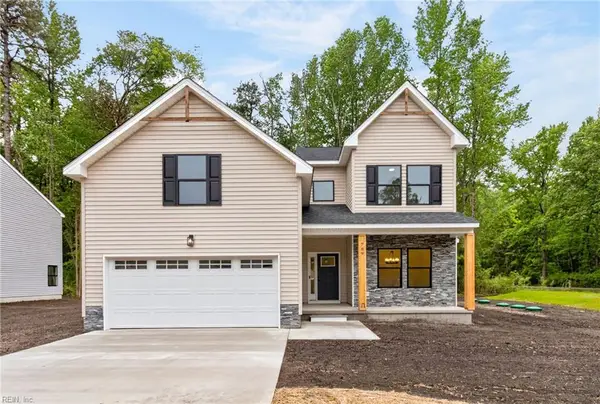 $589,000Active5 beds 3 baths2,600 sq. ft.
789 Caddie Street, Chesapeake, VA 23322
MLS# 10642362Listed by: BHHS RW Towne Realty $365,000Active3 beds 2 baths1,800 sq. ft.
3916 Port Road, Chesapeake, VA 23321
MLS# 10641627Listed by: The Real Estate Group $380,000Active3 beds 3 baths2,062 sq. ft.
4267 White Cap Crest, Chesapeake, VA 23321
MLS# 10642194Listed by: Creed Realty $199,000Active2 beds 1 baths650 sq. ft.
639 Partridge Avenue, Chesapeake, VA 23324
MLS# 10642337Listed by: ONYX Realty Professionals LLC $285,000Active3 beds 3 baths1,703 sq. ft.
4606 Old Fox Trail, Chesapeake, VA 23321
MLS# 10642346Listed by: Shaffer Real Estate Inc.
Local realty services provided by:CENTURY 21 Realty @ Home, CENTURY 21 Nachman Realty
The listings data displayed on this medium comes in part from the Real Estate Information Network Inc. (REIN) and has been authorized by participating listing Broker Members of REIN for display. REIN's listings are based upon Data submitted by its Broker Members, and REIN therefore makes no representation or warranty regarding the accuracy of the Data. All users of REIN's listings database should confirm the accuracy of the listing information directly with the listing agent. 2026 REIN. REIN's listings Data and information is protected under federal copyright laws. Federal law prohibits, among other acts, the unauthorized copying or alteration of, or preparation of derivative works from, all or any part of copyrighted materials, including certain compilations of Data and information. COPYRIGHT VIOLATORS MAY BE SUBJECT TO SEVERE FINES AND PENALTIES UNDER FEDERAL LAW. REIN updates its listings on a daily basis. Data last updated: July 19, 2026 This application does not include information on all of the properties available for sale at this time.
Some listings may be duplicated in the search results due to the co-mingling of listings from more than one multiple listing service. Should there be different listing information between the duplicated listings; user is advised to verify the accuracy of the listing information before making any financial decisions.
2026 REIN, Inc. Information Deemed Reliable But Not Guaranteed.
Neighborhoods near Chesapeake, VA
Zip codes near Chesapeake, VA
- 23320 homes for sale
- 23321 homes for sale
- 23322 homes for sale
- 23323 homes for sale
- 23324 homes for sale
- 23325 homes for sale
- 23462 homes for sale
- 23464 homes for sale
- 23502 homes for sale
- 23504 homes for sale
- 23507 homes for sale
- 23508 homes for sale
- 23509 homes for sale
- 23510 homes for sale
- 23517 homes for sale
- 23523 homes for sale
- 23701 homes for sale
- 23702 homes for sale
- 23704 homes for sale
- 23707 homes for sale
Popular searches near Chesapeake, VA
- Benns Church homes for sale
- Carrollton homes for sale
- Corapeake homes for sale
- Courthouse homes for sale
- Crawford homes for sale
- Currituck homes for sale
- Hampton homes for sale
- Holly Grove homes for sale
- Knotts Island homes for sale
- Moyock homes for sale
- Moyock township homes for sale
- Newland homes for sale
- Newport homes for sale
- Norfolk homes for sale
- Portsmouth homes for sale
- Providence homes for sale
- South Mills homes for sale
- South Mills Township homes for sale
- Suffolk homes for sale
- Virginia Beach homes for sale
Protect your home and budget from life's surprises with an Assurant Home Warranty, backed by a partner that supports you through every step of homeownership. Explore Plans.
©2026 Century 21 Real Estate LLC. All rights reserved. CENTURY 21®, the CENTURY 21 Logo and C21® are service marks owned by Century 21 Real Estate LLC. Century 21 Real Estate LLC fully supports the principles of the Fair Housing Act and the Equal Opportunity Act. Each office is independently owned and operated. Listing information is deemed reliable but not guaranteed accurate.