- Arcadia, Columbia homes for sale
- Auburn Hills, Columbia homes for sale
- Bourn Avenue, Columbia homes for sale
- Douglass Park, Columbia homes for sale
- Grindstone, Columbia homes for sale
- Hominy Branch, Columbia homes for sale
- King's Meadow, Columbia homes for sale
- Lake Saint Louis, Lake Saint Louis homes for sale
- Meadowvale, Columbia homes for sale
- North Central, Columbia homes for sale
- Old Hawthorne, Columbia homes for sale
- Old Southwest, Columbia homes for sale
- Parkdale, Columbia homes for sale
- Shepard Boulevard, Columbia homes for sale
- Southwest Hills, Columbia homes for sale
- The Highlands, Columbia homes for sale
- Thornbrook, Columbia homes for sale
- University Park, Columbia homes for sale
- Valley View Gardens, Columbia homes for sale
- White Gate, Columbia homes for sale
Columbia, MO - homes for sale
195 of 195 results displayed
- New
 $125,000Active6.24 Acres
6.24 ACRES Barberry Ave, COLUMBIA, MO 65202
MLS# 433431Listed by: IRON GATE REAL ESTATE - New
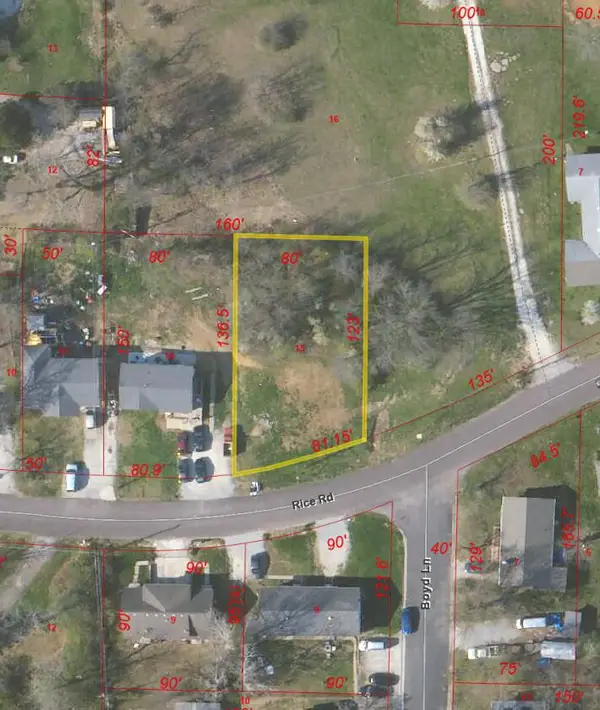 $60,000Active0.24 Acres
Rice Rd, COLUMBIA, MO 65202
MLS# 433238Listed by: NORTH STAR REAL ESTATE  $72,000Active0 Acres
LOT 502 Armstrong Dr, COLUMBIA, MO 65202
MLS# 432968Listed by: WEICHERT, REALTORS - HOUSE OF BROKERS $36,850Active0.19 Acres
LOT 23 Lookout Peak Dr, COLUMBIA, MO 65202
MLS# 432939Listed by: CENTRAL REALTY $225,000Active1.65 Acres
LOT 215 Lightpost Dr, COLUMBIA, MO 65201
MLS# 432922Listed by: WEICHERT, REALTORS - HOUSE OF BROKERS $2,075,000Active51.94 Acres
E Mutton Hollow Ln, COLUMBIA, MO 65201
MLS# 432889Listed by: REMAX BOONE REALTY $36,850Active0.2 Acres
LOT 22 Lookout Peak Dr, COLUMBIA, MO 65202
MLS# 432722Listed by: CENTRAL REALTY $800,000Active21 Acres
E Starke Ave, COLUMBIA, MO 65202
MLS# 432666Listed by: WEICHERT, REALTORS - HOUSE OF BROKERS $225,000Active1.03 Acres
LOT 216 Lightpost Ct, COLUMBIA, MO 65201
MLS# 432622Listed by: REMAX BOONE REALTY $130,000Active0 Acres
LOT 111 Old Hawthorne North, COLUMBIA, MO 65201
MLS# 432599Listed by: COPPER CREEK REALTY $130,000Active0 Acres
LOT 112 Old Hawthorne North, COLUMBIA, MO 65201
MLS# 432600Listed by: COPPER CREEK REALTY $130,000Active0 Acres
LOT 115 Old Hawthorne North, COLUMBIA, MO 65201
MLS# 432601Listed by: COPPER CREEK REALTY $130,000Active0 Acres
LOT 116 Old Hawthorne North, COLUMBIA, MO 65201
MLS# 432602Listed by: COPPER CREEK REALTY $130,000Active0 Acres
LOT 118 Old Hawthorne North, COLUMBIA, MO 65201
MLS# 432603Listed by: COPPER CREEK REALTY $130,000Active0 Acres
LOT 120 Old Hawthorne North, COLUMBIA, MO 65201
MLS# 432604Listed by: COPPER CREEK REALTY $130,000Active0 Acres
LOT 121 Old Hawthorne North, COLUMBIA, MO 65201
MLS# 432605Listed by: COPPER CREEK REALTY $130,000Active0 Acres
LOT 122 Old Hawthorne North, COLUMBIA, MO 65201
MLS# 432606Listed by: COPPER CREEK REALTY $130,000Active0 Acres
LOT 124 Old Hawthorne North, COLUMBIA, MO 65201
MLS# 432608Listed by: COPPER CREEK REALTY $130,000Active0 Acres
LOT 126 Old Hawthorne North, COLUMBIA, MO 65201
MLS# 432609Listed by: COPPER CREEK REALTY $130,000Active0 Acres
LOT 127 Old Hawthorne North, COLUMBIA, MO 65201
MLS# 432610Listed by: COPPER CREEK REALTY $130,000Active0 Acres
LOT 128 Old Hawthorne North, COLUMBIA, MO 65201
MLS# 432611Listed by: COPPER CREEK REALTY $130,000Active0 Acres
LOT 129 Old Hawthorne North, COLUMBIA, MO 65201
MLS# 432612Listed by: COPPER CREEK REALTY $130,000Active0 Acres
LOT 130 Old Hawthorne North, COLUMBIA, MO 65201
MLS# 432613Listed by: COPPER CREEK REALTY $130,000Pending0 Acres
LOT 131 Old Hawthorne North, COLUMBIA, MO 65201
MLS# 432614Listed by: COPPER CREEK REALTY $130,000Pending0 Acres
LOT 132 Old Hawthorne North, COLUMBIA, MO 65201
MLS# 432615Listed by: COPPER CREEK REALTY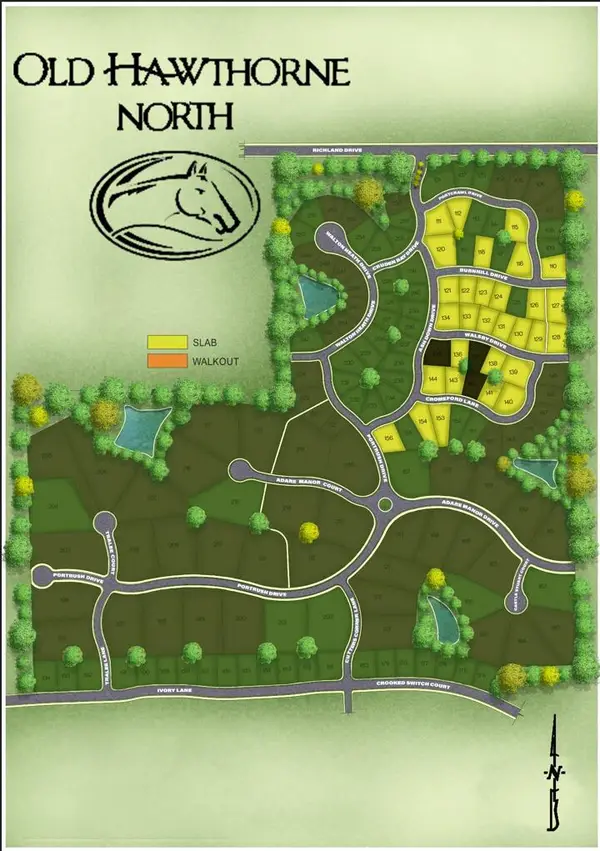 $130,000Active0 Acres
LOT 133 Old Hawthorne North, COLUMBIA, MO 65201
MLS# 432616Listed by: COPPER CREEK REALTY $130,000Active0 Acres
LOT 134 Old Hawthorne North, COLUMBIA, MO 65201
MLS# 432617Listed by: COPPER CREEK REALTY $130,000Active0 Acres
LOT 138 Old Hawthorne North, COLUMBIA, MO 65201
MLS# 432618Listed by: COPPER CREEK REALTY $130,000Pending0 Acres
LOT 110 Old Hawthorne North, COLUMBIA, MO 65201
MLS# 432531Listed by: COPPER CREEK REALTY $910,404Active0.95 Acres
LOT 2 Tarkio Court, Columbia, MO 65202
MLS# 132051Listed by: REAL BROKER LLC $862,488Active0.9 Acres
LOT 3 Tarkio Court, Columbia, MO 65202
MLS# 132052Listed by: REAL BROKER LLC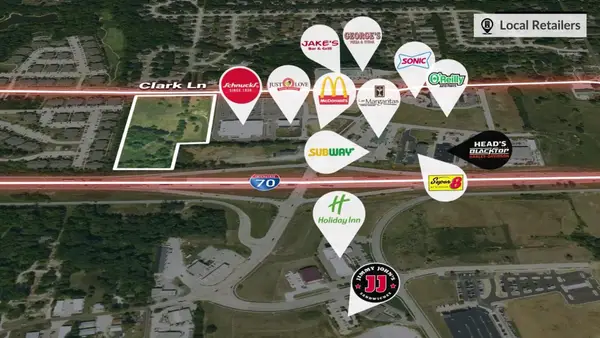 $1,006,236Active1.05 Acres
LOT 5 Tarkio Court, Columbia, MO 65202
MLS# 132053Listed by: REAL BROKER LLC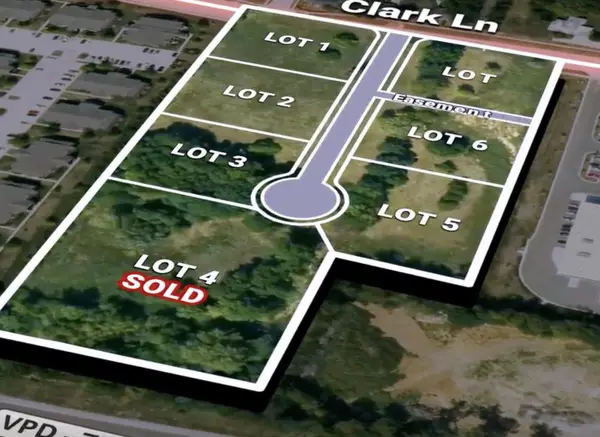 $872,071Active0.91 Acres
LOT 6 Tarkio Court, Columbia, MO 65202
MLS# 132054Listed by: REAL BROKER LLC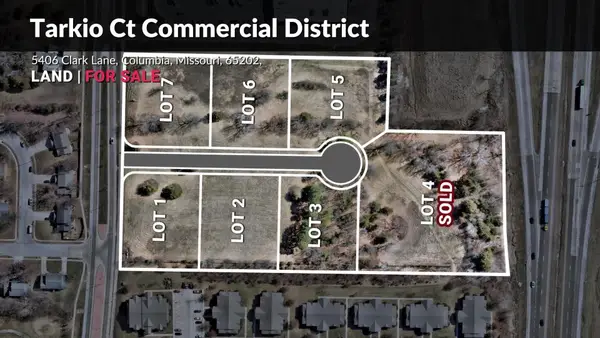 $958,320Active1 Acres
LOT 7 Tarkio Court, Columbia, MO 65202
MLS# 132055Listed by: REAL BROKER LLC $225,000Active3 Acres
3 ACRES W Bethel Dr, COLUMBIA, MO 65203
MLS# 432486Listed by: REMAX BOONE REALTY $1,559,500Pending62.38 Acres
S Warren School Rd, COLUMBIA, MO 65203
MLS# 432446Listed by: REMAX BOONE REALTY $900,821Active0.94 Acres
LOT 1 Tarkio Court, Columbia, MO 65202
MLS# 132045Listed by: REAL BROKER LLC- $84,240Active0 Acres
516 Red Feather Ct, COLUMBIA, MO 65203
MLS# 432350Listed by: BERKSHIRE HATHAWAY HOMESERVICES | VISION REAL ESTATE  $84,240Active0 Acres
579 Corsair Ct, COLUMBIA, MO 65203
MLS# 432354Listed by: BERKSHIRE HATHAWAY HOMESERVICES | VISION REAL ESTATE $87,480Active0 Acres
575 Corsair Ct, COLUMBIA, MO 65203
MLS# 432355Listed by: BERKSHIRE HATHAWAY HOMESERVICES | VISION REAL ESTATE $87,480Active0 Acres
571 Corsair Ct, COLUMBIA, MO 65203
MLS# 432356Listed by: BERKSHIRE HATHAWAY HOMESERVICES | VISION REAL ESTATE- $87,480Active0 Acres
504 Red Feather Ct, COLUMBIA, MO 65203
MLS# 432358Listed by: BERKSHIRE HATHAWAY HOMESERVICES | VISION REAL ESTATE  $315,000Pending0 Acres
LOT 310 Overbrook Ct, COLUMBIA, MO 65201
MLS# 432298Listed by: GAGE & GAGE $250,000Pending2 Acres
20 E Green Meadows, COLUMBIA, MO 65203
MLS# 431908Listed by: REMAX BOONE REALTY $50,000Active0.17 Acres
5800 Oswago Cir, COLUMBIA, MO 65201
MLS# 431877Listed by: REMAX BOONE REALTY- $225,000Active1.49 Acres
LOT 220 Portrush Dr, COLUMBIA, MO 65201
MLS# 431506Listed by: REMAX BOONE REALTY - $225,000Pending1.43 Acres
LOT 212 Portrush Dr, COLUMBIA, MO 65201
MLS# 431507Listed by: REMAX BOONE REALTY - $225,000Pending1.47 Acres
LOT 198 Portrush Dr, COLUMBIA, MO 65201
MLS# 431503Listed by: REMAX BOONE REALTY - $225,000Active1.37 Acres
LOT 202 Portrush Dr, COLUMBIA, MO 65201
MLS# 431505Listed by: REMAX BOONE REALTY  $4,381,875Active116.85 Acres
7202 E New Haven Rd, COLUMBIA, MO 65201
MLS# 431439Listed by: IRON GATE REAL ESTATE $5,999,000Active0 Acres
000 E. Heller Road, Columbia, MO 65202
MLS# 25079064Listed by: WHITETAIL PROPERTIES REAL ESTATE, LLC
 $357,500Active2.5 Acres
LOT 106A Clear Creek Estates, COLUMBIA, MO 65203
MLS# 431055Listed by: CENTURY 21 COMMUNITY $125,000Active0.18 Acres
5308 Whisper Dr, COLUMBIA, MO 65203
MLS# 430796Listed by: IRON GATE REAL ESTATE $75,000Active0.17 Acres
00000 Forest Dr, COLUMBIA, MO 65201
MLS# 430713Listed by: IRON GATE REAL ESTATE $799,000Active46.04 Acres
46ACRES N Hwy Uu Rd, COLUMBIA, MO 65203
MLS# 429519Listed by: X SELL REAL ESTATE LLC $162,500Active0 Acres
LOT 586 Brockton Dr, COLUMBIA, MO 65201
MLS# 429848Listed by: IRON GATE REAL ESTATE $175,000Pending1.08 Acres
LOT 216 Lightpost Ct, COLUMBIA, MO 65201
MLS# 429783Listed by: RE/MAX BOONE REALTY $275,000Active5.03 Acres
6130 S Sinclair Rd, COLUMBIA, MO 65203
MLS# 429341Listed by: WEICHERT, REALTORS - HOUSE OF BROKERS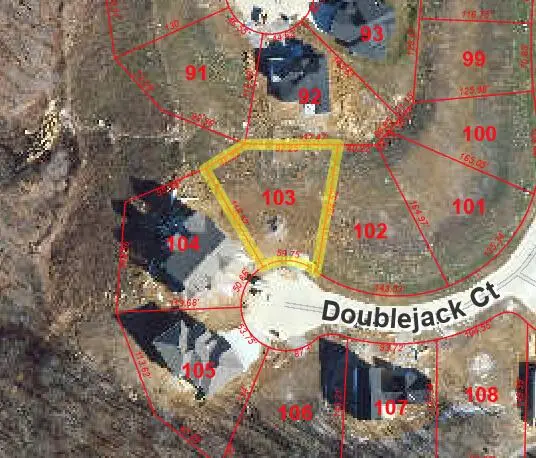 $135,000Active0 Acres
5409 Doublejack Ct, COLUMBIA, MO 65203
MLS# 429271Listed by: GIRARD REALTY $105,000Active0 Acres
LOT 1124 Stormy Dr, COLUMBIA, MO 65203
MLS# 429125Listed by: WEICHERT, REALTORS - HOUSE OF BROKERS $150,000Active0 Acres
LOT 149 Cromford Ln, COLUMBIA, MO 65201
MLS# 429037Listed by: GIRARD REALTY $150,000Active0 Acres
LOT 148 Cromford Ln, COLUMBIA, MO 65201
MLS# 429031Listed by: GIRARD REALTY $150,000Active0 Acres
LOT 104 Portcrawl Dr, COLUMBIA, MO 65201
MLS# 429023Listed by: GIRARD REALTY $150,000Active0 Acres
LOT 105 Portcrawl Dr, COLUMBIA, MO 65201
MLS# 429024Listed by: GIRARD REALTY $150,000Active0 Acres
LOT 146 Cromford Ln, COLUMBIA, MO 65201
MLS# 429025Listed by: GIRARD REALTY $130,000Active0 Acres
LOT 119 Burnhill Dr, COLUMBIA, MO 65201
MLS# 428847Listed by: GIRARD REALTY- $75,000Active0 Acres
231 Peregrine Pl, COLUMBIA, MO 65202
MLS# 422580Listed by: THE COMPANY, WENDY C. SWETZ REAL ESTATE  $130,000Active0 Acres
LOT 125 Burnhill Dr, COLUMBIA, MO 65201
MLS# 428689Listed by: GIRARD REALTY $120,000Active0 Acres
5228 Whisper Dr, COLUMBIA, MO 65203
MLS# 428584Listed by: WEICHERT, REALTORS - HOUSE OF BROKERS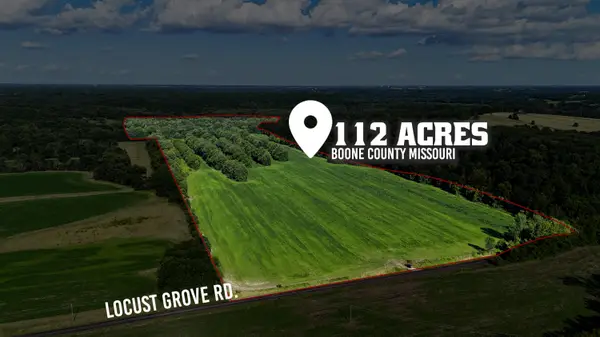 $1,904,000Active112 Acres
N Locust Grove Church Rd, COLUMBIA, MO 65201
MLS# 429820Listed by: ATRIUM REALTY, LLC $190,000Pending0 Acres
LOT 122 Signature Ridge, COLUMBIA, MO 65201
MLS# 427554Listed by: BEV & CO. REALTY, LLC $190,000Pending0 Acres
LOT 123 Signature Ridge, COLUMBIA, MO 65201
MLS# 427555Listed by: BEV & CO. REALTY, LLC $98,500Active0 Acres
1301 Morning Dove Dr, COLUMBIA, MO 65201
MLS# 427455Listed by: BEACON STREET PROPERTIES, LLC $220,000Active1.06 Acres
LOT 165 Castle Stuart Ct, COLUMBIA, MO 65201
MLS# 427436Listed by: REMAX BOONE REALTY- $170,000Active0 Acres
LOT 227 Easley Cabin Cir, COLUMBIA, MO 65201
MLS# 426329Listed by: EXP REALTY LLC - $225,000Pending0 Acres
LOT 215 Easley Cabin Cir, COLUMBIA, MO 65201
MLS# 423758Listed by: EXP REALTY LLC - $225,000Active0 Acres
LOT 213 Easley Cabin Cir, COLUMBIA, MO 65201
MLS# 423760Listed by: EXP REALTY LLC - $225,000Active0 Acres
LOT 211 Easley Cabin Cir, COLUMBIA, MO 65201
MLS# 423770Listed by: EXP REALTY LLC - $225,000Active0 Acres
LOT 210 Easley Cabin Cir, COLUMBIA, MO 65201
MLS# 423773Listed by: EXP REALTY LLC - $152,000Active0 Acres
LOT 260 Easley Cabin Cir, COLUMBIA, MO 65201
MLS# 423775Listed by: EXP REALTY LLC - $152,000Active0 Acres
LOT 261 Easley Cabin Cir, COLUMBIA, MO 65201
MLS# 423776Listed by: EXP REALTY LLC - $152,000Active0 Acres
LOT 263 Easley Cabin Cir, COLUMBIA, MO 65201
MLS# 423782Listed by: EXP REALTY LLC - $225,000Active0 Acres
LOT 203 Easley Cabin Cir, COLUMBIA, MO 65201
MLS# 423786Listed by: EXP REALTY LLC - $152,000Active0 Acres
LOT 265 Easley Cabin Cir, COLUMBIA, MO 65201
MLS# 423788Listed by: EXP REALTY LLC - $225,000Active0 Acres
LOT 202 Easley Cabin Cir, COLUMBIA, MO 65201
MLS# 423790Listed by: EXP REALTY LLC - $152,000Active0 Acres
LOT 266 Easley Cabin Cir, COLUMBIA, MO 65201
MLS# 423792Listed by: EXP REALTY LLC - $152,000Active0 Acres
LOT 267 Easley Cabin Cir, COLUMBIA, MO 65201
MLS# 423796Listed by: EXP REALTY LLC - $225,000Active0 Acres
LOT 206 Easley Cabin Cir, COLUMBIA, MO 65201
MLS# 431201Listed by: CENTRAL MISSOURI REAL ESTATE - $225,000Active0.4 Acres
LOT 214 Easley Cabin Cir, COLUMBIA, MO 65201
MLS# 431211Listed by: REMAX BOONE REALTY - $225,000Active0.32 Acres
LOT 205 Easley Cabin Cir, COLUMBIA, MO 65201
MLS# 431212Listed by: REMAX BOONE REALTY - $225,000Active0 Acres
LOT 212 Easley Cabin Cir, COLUMBIA, MO 65201
MLS# 432847Listed by: AREY REAL ESTATE  $152,000Active0 Acres
LOT 262 Easley Cabin Cir, COLUMBIA, MO 65201
MLS# 432849Listed by: AREY REAL ESTATE $269,900Active4.01 Acres
1150 E Uu (lot 4a), COLUMBIA, MO 65203
MLS# 426945Listed by: 573 REALTY, LLC $287,000Active3.95 Acres
4200 S Rock Quarry Rd, COLUMBIA, MO 65201
MLS# 427023Listed by: WEICHERT, REALTORS - HOUSE OF BROKERS $225,000Active0 Acres
LOT 217 Easley Cabin Cir, COLUMBIA, MO 65201
MLS# 423754Listed by: EXP REALTY LLC $155,000Pending0 Acres
LOT 255 Easley Cabin Cir, COLUMBIA, MO 65201
MLS# 423755Listed by: EXP REALTY LLC $152,000Active0 Acres
LOT 256 Easley Cabin Cir, COLUMBIA, MO 65201
MLS# 423757Listed by: EXP REALTY LLC $225,000Active0 Acres
LOT 216 Easley Cabin Cir, COLUMBIA, MO 65201
MLS# 432848Listed by: AREY REAL ESTATE $225,000Active0 Acres
LOT 224 Easley Cabin Cir, COLUMBIA, MO 65201
MLS# 423744Listed by: EXP REALTY LLC $225,000Active0 Acres
LOT 223 Easley Cabin Cir, COLUMBIA, MO 65201
MLS# 423745Listed by: EXP REALTY LLC $225,000Active0 Acres
LOT 222 Easley Cabin Cir, COLUMBIA, MO 65201
MLS# 423747Listed by: EXP REALTY LLC $155,000Pending0 Acres
LOT 253 Easley Cabin Cir, COLUMBIA, MO 65201
MLS# 423749Listed by: EXP REALTY LLC $225,000Active0 Acres
LOT 220 Easley Cabin Cir, COLUMBIA, MO 65201
MLS# 423750Listed by: EXP REALTY LLC $225,000Active0 Acres
LOT 219 Easley Cabin Cir, COLUMBIA, MO 65201
MLS# 423751Listed by: EXP REALTY LLC $152,000Active0 Acres
LOT 254 Easley Cabin Cir, COLUMBIA, MO 65201
MLS# 431205Listed by: CENTRAL MISSOURI REAL ESTATE $170,000Active0 Acres
LOT 231 Easley Cabin Cir, COLUMBIA, MO 65201
MLS# 423735Listed by: EXP REALTY LLC $152,000Active0 Acres
LOT 248 Easley Cabin Cir, COLUMBIA, MO 65201
MLS# 423736Listed by: EXP REALTY LLC $170,000Active0 Acres
LOT 230 Easley Cabin Cir, COLUMBIA, MO 65201
MLS# 423737Listed by: EXP REALTY LLC $170,000Active0 Acres
LOT 228 Easley Cabin Cir, COLUMBIA, MO 65201
MLS# 423740Listed by: EXP REALTY LLC $152,000Active0 Acres
LOT 259 Easley Cabin Cir, COLUMBIA, MO 65201
MLS# 423772Listed by: EXP REALTY LLC $225,000Active0.24 Acres
LOT 225 Easley Cabin Cir, COLUMBIA, MO 65201
MLS# 431210Listed by: REMAX BOONE REALTY $225,000Active0 Acres
LOT 201 Easley Cabin Cir, COLUMBIA, MO 65201
MLS# 432846Listed by: AREY REAL ESTATE $115,000Active0 Acres
LOT 1143 Legacy Farms, COLUMBIA, MO 65203
MLS# 427129Listed by: CENTURY 21 COMMUNITY $299,900Active11.16 Acres
4608 Mexico Gravel Rd, COLUMBIA, MO 65202
MLS# 426307Listed by: REMAX BOONE REALTY $588,000Active3.96 Acres
Range Line St, COLUMBIA, MO 65202
MLS# 426254Listed by: REMAX BOONE REALTY $39,500Active0.28 Acres
1804 Kassem Dr, COLUMBIA, MO 65202
MLS# 433064Listed by: IRON GATE REAL ESTATE $249,900Active8.13 Acres
6908 E Mexico Gravel Rd, COLUMBIA, MO 65202
MLS# 428370Listed by: WEICHERT, REALTORS - HOUSE OF BROKERS- $225,000Active1.43 Acres
LOT 212 Portrush Dr, COLUMBIA, MO 65201
MLS# 424400Listed by: REMAX BOONE REALTY - $200,000Pending1.03 Acres
LOT 167 Adare Manor Dr, COLUMBIA, MO 65201
MLS# 431445Listed by: REMAX BOONE REALTY - $200,000Active1.01 Acres
LOT 170 Portrush Dr, COLUMBIA, MO 65201
MLS# 431500Listed by: REMAX BOONE REALTY - $200,000Active1.02 Acres
LOT 172 Cutters Corner Dr, COLUMBIA, MO 65201
MLS# 431501Listed by: REMAX BOONE REALTY - $200,000Active1.02 Acres
LOT 173 Cutters Corner Dr, COLUMBIA, MO 65201
MLS# 431502Listed by: REMAX BOONE REALTY  $175,000Active0.35 Acres
Lot 501 Crooked Switch Ct, COLUMBIA, MO 65201
MLS# 423570Listed by: R. G. MONGLER REAL ESTATE $249,900Active5 Acres
7513 Kirby Knowle Ct, COLUMBIA, MO 65203
MLS# 424895Listed by: WEICHERT, REALTORS - HOUSE OF BROKERS $479,000Pending3.67 Acres
201 E Old Plank Rd, COLUMBIA, MO 65203
MLS# 422356Listed by: RE/MAX BOONE REALTY $152,000Active0 Acres
LOT 246 Genesis Dr, COLUMBIA, MO 65201
MLS# 423761Listed by: EXP REALTY LLC $152,000Active0 Acres
LOT 245 Genesis Dr, COLUMBIA, MO 65201
MLS# 423766Listed by: EXP REALTY LLC $152,000Active0 Acres
LOT 243 Genesis Dr, COLUMBIA, MO 65201
MLS# 423781Listed by: EXP REALTY LLC $152,000Active0 Acres
LOT 242 Genesis Dr, COLUMBIA, MO 65201
MLS# 423784Listed by: EXP REALTY LLC $152,000Active0 Acres
LOT 235 Genesis Dr, COLUMBIA, MO 65201
MLS# 423785Listed by: EXP REALTY LLC $152,000Active0 Acres
LOT 236 Genesis Dr, COLUMBIA, MO 65201
MLS# 423789Listed by: EXP REALTY LLC $190,000Active0 Acres
LOT 240 Genesis Dr, COLUMBIA, MO 65201
MLS# 423791Listed by: EXP REALTY LLC $152,000Active0 Acres
LOT 237 Genesis Dr, COLUMBIA, MO 65201
MLS# 423793Listed by: EXP REALTY LLC $190,000Active0 Acres
LOT 239 Genesis Dr, COLUMBIA, MO 65201
MLS# 423795Listed by: EXP REALTY LLC $152,000Active0 Acres
LOT 238 Genesis Dr, COLUMBIA, MO 65201
MLS# 423797Listed by: EXP REALTY LLC $152,000Active0 Acres
LOT 232 Genesis Dr, COLUMBIA, MO 65201
MLS# 431204Listed by: CENTRAL MISSOURI REAL ESTATE $152,000Active0.25 Acres
LOT 244 Genesis Dr, COLUMBIA, MO 65201
MLS# 431213Listed by: REMAX BOONE REALTY $152,000Active0.31 Acres
LOT 234 Genesis Dr, COLUMBIA, MO 65201
MLS# 431214Listed by: REMAX BOONE REALTY $110,000Active0.18 Acres
Lot 1072 Butter Cup Dr, COLUMBIA, MO 65203
MLS# 420354Listed by: WEICHERT, REALTORS - HOUSE OF BROKERS $110,000Active0.25 Acres
Lot 1137 Whisper Dr, COLUMBIA, MO 65203
MLS# 420355Listed by: WEICHERT, REALTORS - HOUSE OF BROKERS $775,000Active14.75 Acres
LOT 3 2000 Allen Ln, COLUMBIA, MO 65202
MLS# 421028Listed by: SILVERTREE REALTY CORP. $80,000Active1.31 Acres
LOT 4 2000 Allen Ln, COLUMBIA, MO 65202
MLS# 421029Listed by: SILVERTREE REALTY CORP. $529,000Active5.24 Acres
LOT 1 & 2 W Old Plank Road (barcus Ridge) Rd, COLUMBIA, MO 65203
MLS# 419806Listed by: BERKSHIRE HATHAWAY HOMESERVICES | VISION REAL ESTATE $465,000Active2.21 Acres
LOT 202 Cresskill Dr, COLUMBIA, MO 65203
MLS# 419573Listed by: THE FOUNDATION REALTY $400,000Pending3.12 Acres
LOT 201 Cresskill Dr, COLUMBIA, MO 65203
MLS# 419574Listed by: THE FOUNDATION REALTY $625,000Pending7.05 Acres
LOT 203 Cresskill Dr, COLUMBIA, MO 65203
MLS# 419572Listed by: THE FOUNDATION REALTY $320,000Active1.05 Acres
LOT 2 2000 Allen Ln, COLUMBIA, MO 65202
MLS# 421027Listed by: SILVERTREE REALTY CORP. $775,000Active1.48 Acres
LOT 1 2000 Allen Ln, COLUMBIA, MO 65202
MLS# 421026Listed by: SILVERTREE REALTY CORP. $146,000Active9.35 Acres
L401-L430 Forest Ridge Plat 4, COLUMBIA, MO 65202
MLS# 418837Listed by: WEICHERT, REALTORS - HOUSE OF BROKERS $34,000Active0 Acres
LOT 18 Lookout Peak Dr, COLUMBIA, MO 65202
MLS# 418838Listed by: WEICHERT, REALTORS - HOUSE OF BROKERS $34,000Active0.5 Acres
LOT 70 Aspen Ridge, COLUMBIA, MO 65202
MLS# 418841Listed by: WEICHERT, REALTORS - HOUSE OF BROKERS $55,000Active0 Acres
LOT 20 Sparrow Ct, COLUMBIA, MO 65201
MLS# 417366Listed by: WEICHERT, REALTORS - HOUSE OF BROKERS $55,000Active0 Acres
LOT 17 Sparrow Ct, COLUMBIA, MO 65201
MLS# 417372Listed by: WEICHERT, REALTORS - HOUSE OF BROKERS $2,090,880Active9.6 Acres
LOT 1 Battle Ave, COLUMBIA, MO 65202
MLS# 417332Listed by: SILVERTREE REALTY CORP.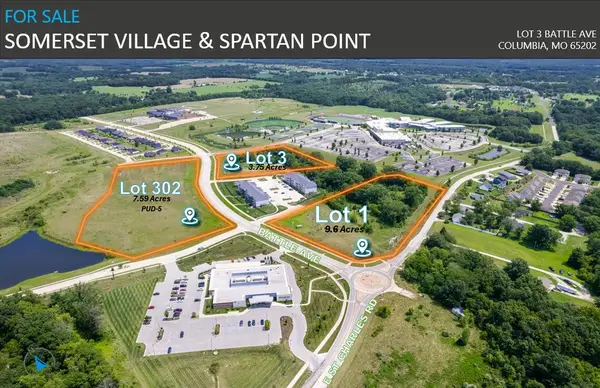 $735,075Active3.75 Acres
LOT 3 Battle Ave, COLUMBIA, MO 65202
MLS# 417333Listed by: SILVERTREE REALTY CORP. $369,000Active2.5 Acres
LOT 108A Clear Creek Estates, COLUMBIA, MO 65203
MLS# 416463Listed by: CENTURY 21 COMMUNITY $5,720,000Active220 Acres
E St Charles Road, COLUMBIA, MO 65202
MLS# 415697Listed by: BOULEVARD REALTY $480,902Active1.84 Acres
LOT 18 Maguire Blvd, COLUMBIA, MO 65201
MLS# 414235Listed by: SILVERTREE REALTY CORP. $991,861Active7.59 Acres
LOT 302 Battle Ave, COLUMBIA, MO 65202
MLS# 414239Listed by: SILVERTREE REALTY CORP.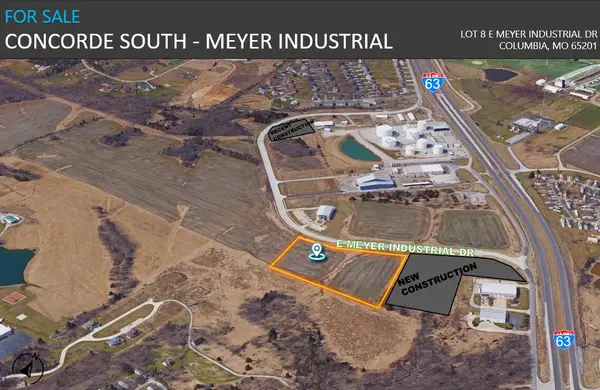 $974,655Active8.95 Acres
LOT 8 E Meyer Industrial Dr, COLUMBIA, MO 65201
MLS# 414241Listed by: SILVERTREE REALTY CORP.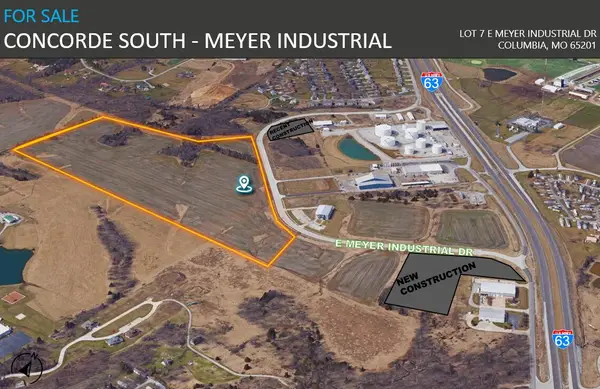 $4,351,644Active44.4 Acres
LOT 7 E Meyer Industrial Dr, COLUMBIA, MO 65201
MLS# 414242Listed by: SILVERTREE REALTY CORP.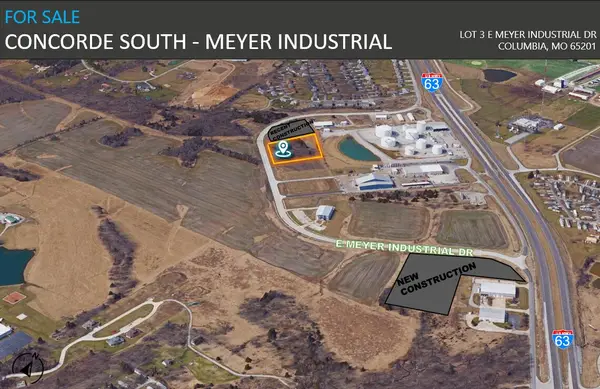 $291,090.25Active2.43 Acres
LOT 3 E Meyer Industrial Dr, COLUMBIA, MO 65201
MLS# 414243Listed by: SILVERTREE REALTY CORP.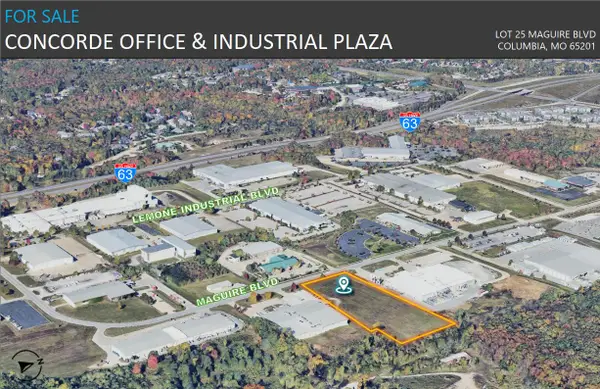 $1,073,318Active4.48 Acres
LOT 25 Maguire Blvd, COLUMBIA, MO 65201
MLS# 414249Listed by: SILVERTREE REALTY CORP. $30,000Pending0.17 Acres
407 Oak St, COLUMBIA, MO 65203
MLS# 413799Listed by: IRON GATE REAL ESTATE $347,500Active2.51 Acres
LOT 101 Clear Creek Estates, COLUMBIA, MO 65203
MLS# 409890Listed by: CENTURY 21 COMMUNITY $407,500Active2.5 Acres
LOT 109 Clear Creek Estates, COLUMBIA, MO 65203
MLS# 409898Listed by: CENTURY 21 COMMUNITY $467,500Active2.53 Acres
LOT 118 Clear Creek Estates, COLUMBIA, MO 65203
MLS# 409902Listed by: CENTURY 21 COMMUNITY $397,500Active2.55 Acres
LOT 128 Clear Creek Estates, COLUMBIA, MO 65203
MLS# 409905Listed by: CENTURY 21 COMMUNITY $417,500Active2.6 Acres
LOT 131 Clear Creek Estates, COLUMBIA, MO 65203
MLS# 409908Listed by: CENTURY 21 COMMUNITY $297,500Pending2.5 Acres
LOT 136 Clear Creek Estates, COLUMBIA, MO 65203
MLS# 409912Listed by: CENTURY 21 COMMUNITY $427,500Active2.53 Acres
LOT 129 Clear Creek Estates, COLUMBIA, MO 65203
MLS# 409906Listed by: CENTURY 21 COMMUNITY $317,500Active2.6 Acres
LOT 132 Clear Creek Estates, COLUMBIA, MO 65203
MLS# 409909Listed by: CENTURY 21 COMMUNITY $437,500Active2.94 Acres
LOT 133 Clear Creek Estates, COLUMBIA, MO 65203
MLS# 409910Listed by: CENTURY 21 COMMUNITY $407,500Active2.71 Acres
LOT 139 Clear Creek Estates, COLUMBIA, MO 65203
MLS# 409914Listed by: CENTURY 21 COMMUNITY $74,000Active0 Acres
LOT 226 Chancellor Cir, COLUMBIA, MO 65202
MLS# 411884Listed by: THE COMPANY, WENDY C. SWETZ REAL ESTATE $650,000Pending26.86 Acres
TR 2 W Rte K, COLUMBIA, MO 65203
MLS# 412020Listed by: MEYERWORKS, LLC $214,420Pending1.79 Acres
LOT 2 Flanders Ct, COLUMBIA, MO 65202
MLS# 403568Listed by: REMAX BOONE REALTY $70,000Active0 Acres
LOT 151 Sullivan St, COLUMBIA, MO 65202
MLS# 401872Listed by: THE COMPANY, WENDY C. SWETZ REAL ESTATE $67,000Active0 Acres
LOT 122 Celebrant Ct, COLUMBIA, MO 65202
MLS# 401883Listed by: THE COMPANY, WENDY C. SWETZ REAL ESTATE $77,500Active0 Acres
LOT 237 Peregrine Pl, COLUMBIA, MO 65202
MLS# 401888Listed by: THE COMPANY, WENDY C. SWETZ REAL ESTATE $68,000Active0 Acres
LOT 116 Corcoran Dr, COLUMBIA, MO 65202
MLS# 401893Listed by: THE COMPANY, WENDY C. SWETZ REAL ESTATE $73,500Active0 Acres
LOT 230 Corcoran Dr, COLUMBIA, MO 65202
MLS# 401895Listed by: THE COMPANY, WENDY C. SWETZ REAL ESTATE $73,500Active0 Acres
LOT 229 Corcoran Dr, COLUMBIA, MO 65202
MLS# 401900Listed by: THE COMPANY, WENDY C. SWETZ REAL ESTATE $73,000Active0 Acres
LOT 228 Corcoran Dr, COLUMBIA, MO 65202
MLS# 401901Listed by: THE COMPANY, WENDY C. SWETZ REAL ESTATE $73,000Active0 Acres
LOT 211 Chancellor Cir, COLUMBIA, MO 65202
MLS# 401905Listed by: THE COMPANY, WENDY C. SWETZ REAL ESTATE $215,600Pending1.8 Acres
LOT 3 Flanders Ct, COLUMBIA, MO 65202
MLS# 403213Listed by: REMAX BOONE REALTY $60,000Pending0 Acres
1801 Hanover Blvd, COLUMBIA, MO 65202
MLS# 418946Listed by: REMAX BOONE REALTY $60,000Pending0 Acres
1805 Hanover Blvd, COLUMBIA, MO 65202
MLS# 418947Listed by: REMAX BOONE REALTY $60,000Pending0 Acres
1809 Hanover Blvd, COLUMBIA, MO 65202
MLS# 418948Listed by: REMAX BOONE REALTY $60,000Pending0 Acres
1813 Hanover Blvd, COLUMBIA, MO 65202
MLS# 418949Listed by: REMAX BOONE REALTY $60,000Pending0 Acres
1817 Hanover Blvd, COLUMBIA, MO 65202
MLS# 418950Listed by: REMAX BOONE REALTY $60,000Pending0 Acres
1901 Hanover Blvd, COLUMBIA, MO 65202
MLS# 418951Listed by: REMAX BOONE REALTY $339,005.7Active2.83 Acres
LOT 2A E Meyer Industrial Dr, COLUMBIA, MO 65201
MLS# 422516Listed by: SILVERTREE REALTY CORP. $39,900Active0.53 Acres
5103 Hatteras Dr, COLUMBIA, MO 65202
MLS# 423433Listed by: REMAX BOONE REALTY $39,900Active0.21 Acres
5105 Hatteras Dr, COLUMBIA, MO 65202
MLS# 423434Listed by: REMAX BOONE REALTY
Local realty services provided by:CENTURY 21 Community
Copyright 2026 Mid-America Regional Information Systems. All rights reserved. Listings courtesy of Mid-America Regional Information Systems as distributed by MLS GRID <Last Updated March 31, 2026. Mid-America Regional Information Systems provides content displayed here (“provided content”) on an “as is” basis and makes no representations or warranties regarding the provided content, including, but not limited to those of non-infringement, timeliness, accuracy, or completeness. Individuals and companies using information presented are responsible for verification and validation of information they utilize and present to their customers and clients. Mid-America Regional Information Systems will not be liable for any damage or loss resulting from use of the provided content or the products available through Portals, IDX, VOW, and/or Syndication. Recipients of this information shall not resell, redistribute, reproduce, modify, or otherwise copy any portion thereof without the expressed written consent of Mid-America Regional Information Systems.
Neighborhoods near Columbia, MO
Zip codes near Columbia, MO
- 65010 homes for sale
- 65039 homes for sale
- 65046 homes for sale
- 65063 homes for sale
- 65201 homes for sale
- 65202 homes for sale
- 65203 homes for sale
- 65231 homes for sale
- 65233 homes for sale
- 65240 homes for sale
- 65243 homes for sale
- 65248 homes for sale
- 65251 homes for sale
- 65255 homes for sale
- 65256 homes for sale
- 65257 homes for sale
- 65262 homes for sale
- 65279 homes for sale
- 65284 homes for sale
- 65287 homes for sale
Popular searches near Columbia, MO
- Ashland homes for sale
- Bourbon homes for sale
- Bourbon homes for sale
- Cedar homes for sale
- Columbia Township homes for sale
- Hallsville homes for sale
- Harrisburg homes for sale
- Hartsburg homes for sale
- Jamestown homes for sale
- Katy homes for sale
- Linn homes for sale
- Missouri homes for sale
- Moniteau homes for sale
- Perche homes for sale
- Rocheport homes for sale
- Rock Bridge homes for sale
- Rocky Fork homes for sale
- Saline homes for sale
- Three Creeks homes for sale
- Wooldridge homes for sale
Protect your home and budget from life's surprises with an Assurant Home Warranty, backed by a partner that supports you through every step of homeownership. Explore Plans.
©2026 Century 21 Real Estate LLC. All rights reserved. CENTURY 21®, the CENTURY 21 Logo and C21® are service marks owned by Century 21 Real Estate LLC. Century 21 Real Estate LLC fully supports the principles of the Fair Housing Act and the Equal Opportunity Act. Each office is independently owned and operated. Listing information is deemed reliable but not guaranteed accurate.