- Apple Valley homes for sale
- Blue Jay homes for sale
- Cedar Glen homes for sale
- Cedarpines Park homes for sale
- Crestline homes for sale
- Green Valley Lake homes for sale
- Hesperia homes for sale
- Lake Arrowhead homes for sale
- Lytle Creek homes for sale
- Mountain View Acres homes for sale
- Muscoy homes for sale
- Oak Hills homes for sale
- Phelan homes for sale
- Rimforest homes for sale
- Running Springs homes for sale
- Skyforest homes for sale
- Spring Valley Lake homes for sale
- Twin Peaks homes for sale
- Victorville homes for sale
- Victorville-Hesperia homes for sale
92345, CA - homes for sale
199 of 199 results displayed
- New
 $975,000Active2.76 Acres
11115 Santa Fe E, Hesperia, CA 92345
MLS# IV26126170Listed by: THE VIRTUAL REALTY GROUP - New
 $610,000Active5 Acres
0 I Avenue, Hesperia, CA 92345
MLS# HD26122953Listed by: KURSCH GROUP, INC. - New
 $425,000Active6.5 Acres
20 Fuente Avenue, Hesperia, CA 92345
MLS# CV26119543Listed by: MGR REAL ESTATE, INC. - New
 $175,000Active5 Acres
0 Glendale Avenue, Hesperia, CA 92345
MLS# HD26120516Listed by: HDHOMES - New
 $88,000Active0.53 Acres
0 I Avenue, Hesperia, CA 92345
MLS# IV26118979Listed by: KELLER WILLIAMS/VICTOR VALLEY - New
 $20,000Active5.08 Acres
750 Summit Valley (near) Road, Hesperia, CA 92345
MLS# HD26119052Listed by: NICOLE CRAFT, BROKER - New
 $50,000Active10 Acres
740 Summit Valley (near) Road, Hesperia, CA 92345
MLS# HD26119054Listed by: NICOLE CRAFT, BROKER - New
 $565,000Active0.47 Acres
17153 Bear Valley, Hesperia, CA 92345
MLS# HD26117770Listed by: MGR REAL ESTATE, INC  $45,000Active0.15 Acres
92345 Mojave St, Hesperia, CA 92345
MLS# DW26117140Listed by: PRICE REAL ESTATE GROUP INC $100,000Pending0 Acres
0 Mesa, Hesperia, CA 92345
MLS# CV26114191Listed by: PLEASANT HILL REAL ESTATE GROUP $299,900Active55.47 Acres
0 Telephone Canyon, Hesperia, CA 92345
MLS# HD26110590Listed by: COLDWELL BANKER HOME SOURCE $49,995Active0.26 Acres
0 Vine St, Hesperia, CA 92345
MLS# 260010894SDListed by: CONGRESS REALTY, INC $54,999Active0.2 Acres
16370 Juniper, Hesperia, CA 92345
MLS# OC26108297Listed by: RE/MAX FINE HOMES $149,000Active1.25 Acres
0 Donert, Hesperia, CA 92345
MLS# HD26107955Listed by: KELLER WILLIAMS HIGH DESERT
 $48,000Pending2.5 Acres
1 Mcconneny Road, Hesperia, CA 92345
MLS# HD26107338Listed by: CENTURY 21 MASTERS $199,000Active4.9 Acres
13635 Duxbury Rd, Hesperia, CA 92345
MLS# HD26106871Listed by: CENTURY 21 MASTERS $79,000Active1.74 Acres
0 Talisman Street, Hesperia, CA 92345
MLS# SW26106502Listed by: REALTY EXECUTIVES TEMECULA $425,000Active3.48 Acres
0 Mesa Street, Hesperia, CA 92345
MLS# HD26105740Listed by: NAI CAPITAL, INC. $799,000Active50.14 Acres
0 Ranchero, Hesperia, CA 92345
MLS# PW26099721Listed by: GREENFIELD REALTY $139,500Active0.48 Acres
0 Main, Hesperia, CA 92345
MLS# HD26098896Listed by: ALAM REALTY $49,995Active0 Acres
0 Vine St #6, Hesperia, CA 92345
MLS# 260010894Listed by: CONGRESS REALTY, INC $2,950,000Active2.15 Acres
0 Mariposa Road, Hesperia, CA 92345
MLS# HD26098408Listed by: THE BRADCO COMPANIES $120,000Active0.5 Acres
0 Buckthorn, Hesperia, CA 92345
MLS# HD26097167Listed by: KELLER WILLIAMS HIGH DESERT $475,000Active5.24 Acres
0 Hesperia Road, Hesperia, CA 92345
MLS# HD26096550Listed by: COLDWELL BANKER ENVISION $210,000Active0 Acres
0 Oakwood, Hesperia, CA 92345
MLS# OC26094260Listed by: SCHREIBER REALTY $210,000Active2.78 Acres
0 Oakwood, Hesperia, CA 92345
MLS# OC26094260Listed by: SCHREIBER REALTY $75,000Active0.6 Acres
15 Hackberry Street, Hesperia, CA 92345
MLS# HD26093734Listed by: ALAM REALTY $18,000Active0.06 Acres
0 VICTOR R Victor, Hesperia, CA 92345
MLS# CV26093639Listed by: EXP REALTY OF CALIFORNIA INC- $89,900Pending0 Acres
0 Mojave, Hesperia, CA 92345
MLS# SW26092894Listed by: ABUNDANCE REAL ESTATE  $169,000Active0.13 Acres
0 Main, Hesperia, CA 92345
MLS# PW26084371Listed by: NEW STAR REALTY & INVESTMENT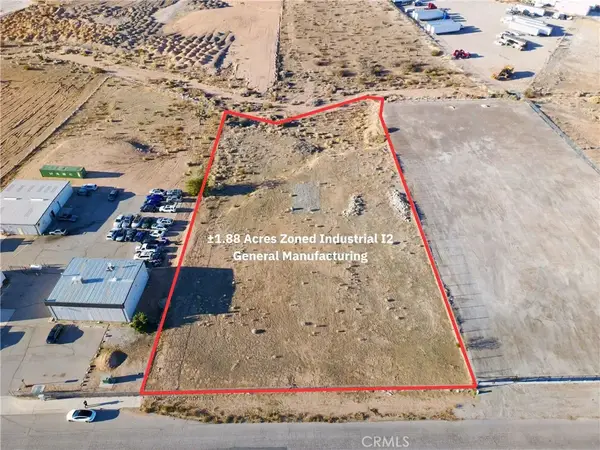 $310,000Active0 Acres
0 Mesa, Hesperia, CA 92345
MLS# CV26089451Listed by: MGR REAL ESTATE, INC.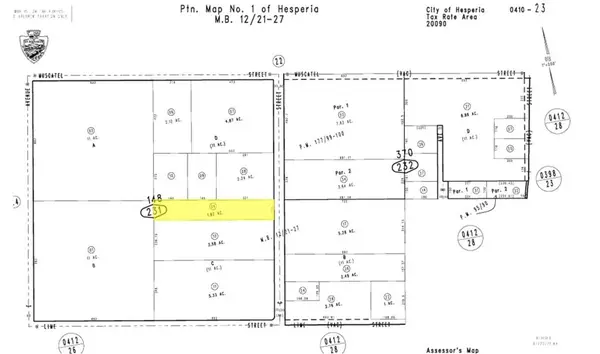 $210,000Active1.82 Acres
0 G Ave, Hesperia, CA 92345
MLS# HD26089515Listed by: NAI CAPITAL, INC. $125,000Active0.69 Acres
0 Afton, Hesperia, CA 92345
MLS# PW26089292Listed by: HOMESMART REALTY GROUP $189,900Active10.47 Acres
10 AC Paisley Avenue, Hesperia, CA 92345
MLS# HD26088570Listed by: LANDCORE REALTY $375,000Active0.57 Acres
0 Bear Valley, Hesperia, CA 92345
MLS# HD26088193Listed by: RE/MAX FREEDOM $1,300,000Active138 Acres
0 Arrowhead Lake Rd, Hesperia, CA 92345
MLS# HD26086576Listed by: NAI CAPITAL, INC. $1,590,000Active1.9 Acres
0 Main Street, Hesperia, CA 92345
MLS# 26772993Listed by: KELLER WILLIAMS LARCHMONT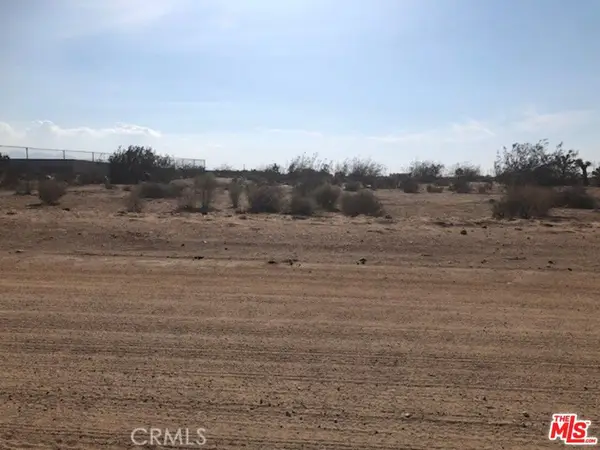 $596,000Active2.74 Acres
0 G Ave, Victorville, CA 92395
MLS# 26773101Listed by: KELLER WILLIAMS LARCHMONT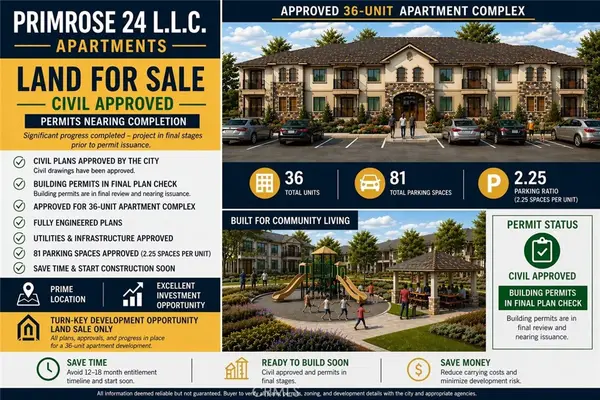 $895,000Active2.28 Acres
0 Primrose Avenue, Hesperia, CA 92345
MLS# TR26084871Listed by: JUNG LYU, BROKER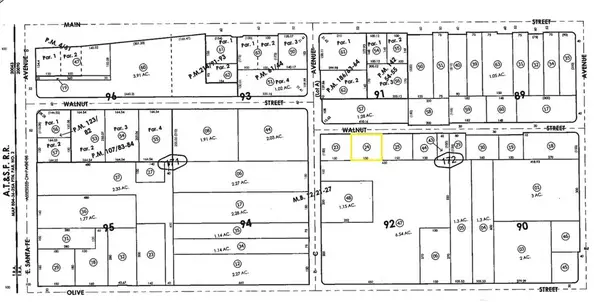 $78,000Active0.52 Acres
0 Walnut Street, Hesperia, CA 92345
MLS# HD26083918Listed by: SAM THABET, BROKER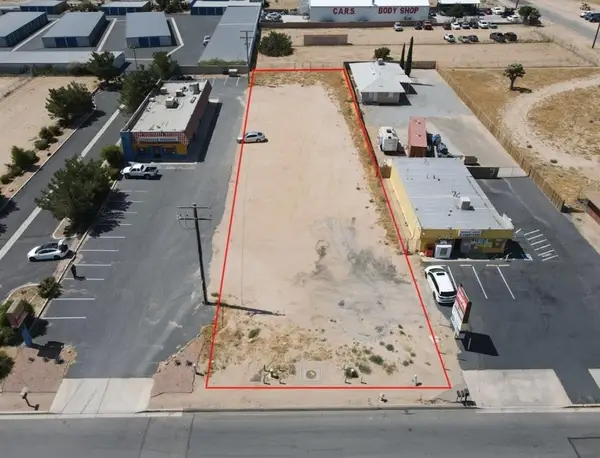 $349,900Active0.48 Acres
0 Main, Hesperia, CA 92344
MLS# DW26081103Listed by: BIG BLOCK POWERHOUSE REALTY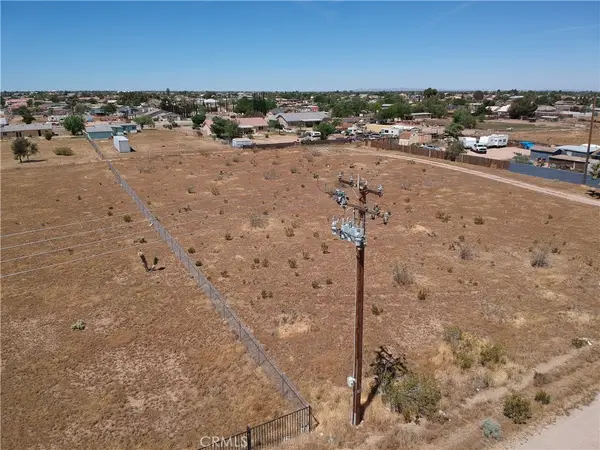 $285,000Active0.67 Acres
0 Hesperia, Hesperia, CA 92345
MLS# OC26076309Listed by: KASE REAL ESTATE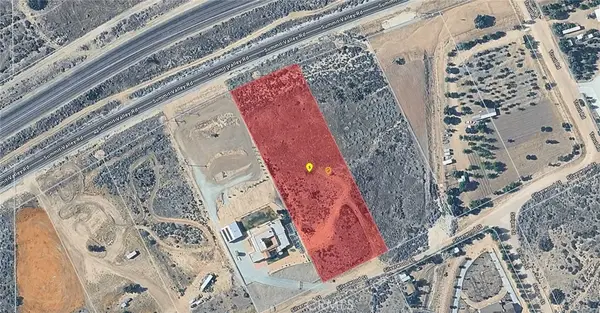 $120,000Active0 Acres
12624 Silverwood, Hesperia, CA 92345
MLS# HD26060183Listed by: RE/MAX FREEDOM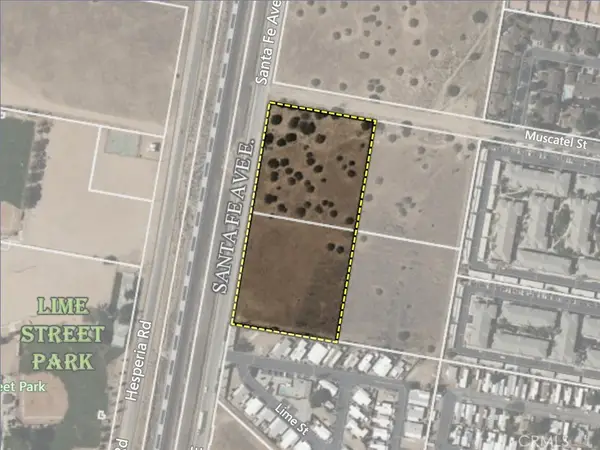 $600,000Active5.24 Acres
0 Santa Fe Ave E., Hesperia, CA 92345
MLS# PW26075323Listed by: MARCUS & MILLICHAP $51,000Active0.26 Acres
0 Orange Street, Hesperia, CA 92345
MLS# AR26074512Listed by: PINNACLE REAL ESTATE GROUP $199,900Active0.89 Acres
0 Sultana Avenue, Hesperia, CA 92345
MLS# HD26073535Listed by: RE/MAX FREEDOM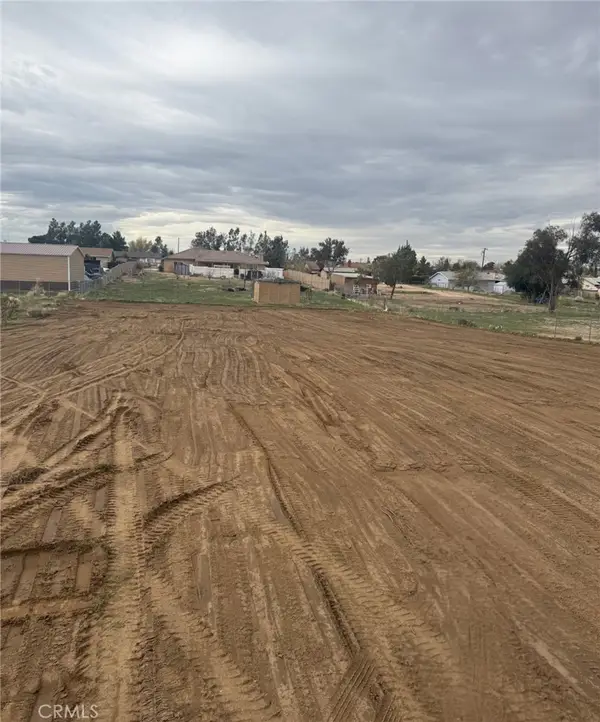 $110,000Active0.68 Acres
0 Hesperia Road, Hesperia, CA 92345
MLS# CV26070324Listed by: EXP REALTY OF GREATER LOS ANGELES $85,000Active0.5 Acres
0 A Avenue, Hesperia, CA 92345
MLS# HD26069554Listed by: LUCKY REALTY $80,000Active0.53 Acres
Hesperia, Hesperia, CA 92345
MLS# 240715Listed by: REAL BROKERAGE TECHNOLOGIES $129,500Active0.67 Acres
11695 Hesperia Road, Hesperia, CA 92345
MLS# OC26068716Listed by: NEXUS COMMERCIAL $250,000Active2.62 Acres
0 Lemon, Hesperia, CA 92345
MLS# DW26065079Listed by: EQUITY SMART REAL ESTATE SERV $95,000Active5 Acres
0 0, Hesperia, CA 92345
MLS# HD26068290Listed by: KELLER WILLIAMS VICTOR VALLEY $45,000Active0.28 Acres
0 Hesperia Road, Hesperia, CA 92345
MLS# HD26063183Listed by: COLLEGE REALTY, INC. $750,000Active2.51 Acres
0 Acacia, Hesperia, CA 92345
MLS# IV26062913Listed by: EXCELLENCE RE REAL ESTATE INC $120,000Active1.78 Acres
12624 Silverwood, Hesperia, CA 92345
MLS# HD26060183Listed by: RE/MAX FREEDOM $129,900Active0.48 Acres
0 Riverside, Hesperia, CA 92345
MLS# PW26060758Listed by: CAMINO REAL REALTORS $129,000Active0.76 Acres
18155 Orange, Hesperia, CA 92345
MLS# SW26059651Listed by: WILLIAMS REALTY GROUP, INC. $125,000Active0.56 Acres
25 Tamarisk Avenue, Hesperia, CA 92345
MLS# CV26055009Listed by: MGR REAL ESTATE, INC. $52,500Active0.36 Acres
22111 Hesperia Rd, Hesperia, CA 92345
MLS# HD26055984Listed by: CENTURY 21 MASTERS $52,500Active0.3 Acres
22153 Hesperia Road, Hesperia, CA 92345
MLS# HD26055988Listed by: CENTURY 21 MASTERS $85,000Active0.48 Acres
39833319 Plumas, Hesperia, CA 92345
MLS# HD26053864Listed by: COLDWELL BANKER HOME SOURCE $150,000Active0.85 Acres
1 Lemon, Hesperia, CA 92345
MLS# DW26053628Listed by: CENTURY 21 LEADERS $895,000Active31 Acres
0 Santa Fe Ave & Ranchero Rd, Hesperia, CA 92345
MLS# HD26052206Listed by: THE BRADCO COMPANIES $119,999Pending0.72 Acres
16670 Sequoia Street, Hesperia, CA 92345
MLS# V1-35088Listed by: CENTURY 21 MASTERS $330,000Active1.02 Acres
0 Hesperia Road, Hesperia, CA 92345
MLS# HD26049533Listed by: RE/MAX FREEDOM $99,000Active0 Acres
0 Sequoia, Hesperia, CA 92345
MLS# HD26041361Listed by: MGR REAL ESTATE, INC $85,000Active22.2 Acres
0 Summit Valley Rd, Hesperia, CA 92345
MLS# AR26037841Listed by: BERKSHIRE HATHAWAY HOMESERVICE $230,000Active2.25 Acres
0 E Avenue, Hesperia, CA 92345
MLS# HD26038738Listed by: REAL BROKERAGE TECHNOLOGIES $2,999,000Active227 Acres
0 Las Flores, Oak Hills, CA 92344
MLS# HD26038162Listed by: RE/MAX FREEDOM $273,375Active1.3 Acres
0 Walnut Street, Hesperia, CA 92345
MLS# HD26035739Listed by: THE BRADCO COMPANIES $150,000Active0.84 Acres
0 Hercules, Hesperia, CA 92345
MLS# OC26035443Listed by: RICHARD BERGSTROM, BROKER $150,000Active1.12 Acres
0 Carrissa, Hesperia, CA 92345
MLS# OC26035454Listed by: RICHARD BERGSTROM, BROKER $7,900,000Active26.67 Acres
0 Us-395, Hesperia, CA 92345
MLS# HD26032844Listed by: COLDWELL BANKER HOME SOURCE $225,000Active0 Acres
0 Live Oak, Hesperia, CA 92345
MLS# HD26032664Listed by: MGR REAL ESTATE, INC $54,999Active0.2 Acres
0 Juniper, Hesperia, CA 92345
MLS# CV26030958Listed by: CENTURY 21 SYNERGIA REALTY $600,000Active60 Acres
19243 Whitehaven, Hesperia, CA 92345
MLS# OC26028548Listed by: UNIVERSAL ELITE INC.- $649,788Active2.72 Acres
0 Mariposa Rd, Hesperia, CA 92325
MLS# MB26017585Listed by: EXCELLENCE RE REAL ESTATE  $100,000Active0.26 Acres
0 Walnut Street, Hesperia, CA 92345
MLS# PW26024868Listed by: CENTURY 21 AFFILIATED $80,000Active2.18 Acres
5364 Bass Street, Hesperia, CA 92345
MLS# IG26020522Listed by: FIV REALTY CO. $385,000Active5 Acres
0 Datura, Hesperia, CA 92345
MLS# HD26021652Listed by: COLDWELL BANKER HOME SOURCE $350,000Active10 Acres
6600 Crockett Avenue, Hesperia, CA 92345
MLS# HD26018952Listed by: CENTURY 21 MASTERS $19,000Active2.5 Acres
32109 Hwy 138, Hesperia, CA 92345
MLS# HD26017644Listed by: COLDWELL BANKER HOME SOURCE $247,000Active2.62 Acres
0 G Avenue, Hesperia, CA 92345
MLS# CV26014170Listed by: FIRST TEAM REAL ESTATE $51,700Active0.2 Acres
0 Cajon Street, Hesperia, CA 92345
MLS# SW26011415Listed by: INZUNZA REAL ESTATE INC. $120,000Active0.49 Acres
7685 Calpella, Hesperia, CA 92345
MLS# HD26012247Listed by: REALTY ONE GROUP EMPIRE $649,000Active6.8 Acres
0 Live Oak, Hesperia, CA 92345
MLS# HD26009816Listed by: KLICK REALTY $899,000Active6.3 Acres
0 Willow Street, Hesperia, CA 92345
MLS# GD26002414Listed by: COLDWELL BANKER HALLMARK $50,000Pending0 Acres
0 Fresno, Hesperia, CA 92345
MLS# IV26006403Listed by: QUALITY REAL ESTATE CORP. $949,000Active10.96 Acres
0 G Avenue, Hesperia, CA 92345
MLS# 25631727Listed by: JOHNHART CORP. $119,000Active0.41 Acres
16 Bangor Avenue, Hesperia, CA 92345
MLS# CV25280979Listed by: EXP REALTY OF SOUTHERN CALIFORNIA INC $99,000Active0.72 Acres
0 Seventh, Hesperia, CA 92345
MLS# HD25280055Listed by: REALTY ONE GROUP EMPIRE $1,200,000Active1.77 Acres
05-406031 Bear Valley Road, Hesperia, CA 92345
MLS# HD25279562Listed by: J.P. & ASSOCIATE $599,990Active0.51 Acres
0 Apatite, Victorville, CA 92395
MLS# HD25278950Listed by: RE/MAX FREEDOM $524,462Active12.04 Acres
0 G, Hesperia, CA 92345
MLS# HD25278699Listed by: THE BRADCO COMPANIES $63,000Active0.46 Acres
0 Birch Street, Hesperia, CA 92345
MLS# V1-33771Listed by: CENTURY 21 MASTERS $995,000Active7.64 Acres
0 Mariposa, Hesperia, CA 92345
MLS# HD25275767Listed by: MGR REAL ESTATE, INC $89,990Active0.48 Acres
0 Boxwood, Hesperia, CA 92345
MLS# OC25272491Listed by: RE/MAX FINE HOMES $119,000Active0.94 Acres
0 Talisman Street, Hesperia, CA 92345
MLS# CV25271490Listed by: REAL ESTATE RESOLVED $115,000Active0.27 Acres
1 Bear Valley Outer, Hesperia, CA 92345
MLS# DW25271081Listed by: VIDA REAL ESTATE $130,000Active0.39 Acres
0 Apn 0398-144-11 / I Ave, Hesperia, CA 92345
MLS# HD25266991Listed by: REALTY ONE GROUP EMPIRE $310,000Active1.88 Acres
0 Mesa, Hesperia, CA 92345
MLS# CV26089451Listed by: MGR REAL ESTATE, INC. $999,000Active4.66 Acres
0 Main Street, Hesperia, CA 92345
MLS# SW25264657Listed by: FARNAM & ASSOCIATES REAL ESTATE $125,000Active0.38 Acres
18132 Bangor Avenue, Hesperia, CA 92345
MLS# HD25257220Listed by: REAL BROKERAGE TECHNOLOGIES $375,000Active0.8 Acres
15403 Bear Valley, Hesperia, CA 92345
MLS# GD25255238Listed by: KELLER WILLIAMS R. E. SERVICES $80,000Active0.53 Acres
0 Ranchero Road, Hesperia, CA 92345
MLS# HD25251825Listed by: COLDWELL BANKER HOME SOURCE $60,000Active0.23 Acres
0 Ranchero Road, Hesperia, CA 92345
MLS# HD25251827Listed by: COLDWELL BANKER HOME SOURCE $200,000Active4.72 Acres
0 Whisper Lane, Hesperia, CA 92345
MLS# IV25244814Listed by: BLUESTONE REALTY $219,000Active1.03 Acres
0 Orange, Hesperia, CA 92345
MLS# CV25243744Listed by: HERN REAL ESTATE & ASSOCIATES $350,000Active1.55 Acres
0 Hesperia, Hesperia, CA 92345
MLS# HD25243692Listed by: LEE & ASSOCIATES $150,000Active0.51 Acres
41304313 Main Street, Hesperia, CA 92345
MLS# HD25241509Listed by: CENTURY 21 MASTERS $95,000Active17.95 Acres
111 Starlight Dr., Hesperia, CA 92345
MLS# HD25236348Listed by: CENTURY 21 MASTERS $60,000Active0.45 Acres
0 Willow Court, Hesperia, CA 92345
MLS# HD25234181Listed by: RE/MAX FREEDOM $450,000Active9.53 Acres
0 Rock Springs Road, Hesperia, CA 92345
MLS# HD25231516Listed by: REALTY ONE GROUP EMPIRE $80,000Active1 Acres
0 Fuentes Avenue, Hesperia, CA 92345
MLS# HD25230873Listed by: NAI CAPITAL, INC. $110,000Active0.41 Acres
0 Spruce, Hesperia, CA 92345
MLS# CV25226542Listed by: CONCIERGE REAL ESTATE CA $80,000Pending0 Acres
0 Summit Valley Rd, Hesperia, CA 92345
MLS# CV25219677Listed by: INTERNATIONAL REAL ESTATE SVCS $119,900Active0.67 Acres
11407 Hesperia, Hesperia, CA 92344
MLS# TR25216568Listed by: NATIONWIDE REALTY $98,000Active17.95 Acres
0 Starlight Dr, Hesperia, CA 92345
MLS# CV25210879Listed by: EXP REALTY OF GREATER LOS ANGELES $595,000Active6.68 Acres
0 Live Oak Street, Hesperia, CA 92345
MLS# HD25264449Listed by: KLICK REALTY $80,000Active4.4 Acres
0 Pinnacle Street, Hesperia, CA 92345
MLS# HD25195244Listed by: EXCELLENCE RE REAL ESTATE $2,800,000Active710 Acres
0 Summit Valley Road, Hesperia, CA 92345
MLS# HD25186320Listed by: THE BRADCO COMPANIES $335,000Active2.32 Acres
0 Alder Street, Hesperia, CA 92345
MLS# HD25183489Listed by: NAI CAPITAL, INC. $119,999Active0.67 Acres
1 Hesperia Road, Hesperia, CA 92345
MLS# HD25183280Listed by: REAL BROKERAGE TECHNOLOGIES $240,000Active3.82 Acres
0 Hesperia/ Victorville, Hesperia, CA 92345
MLS# HD25170598Listed by: CENTURY 21 MASTERS $85,000Active0.48 Acres
0 Sequoia Street, Hesperia, CA 92345
MLS# IV25175828Listed by: SINGH & SONS REALTY $750,000Active8.59 Acres
17111 Ranchero, Hesperia, CA 92345
MLS# HD25174686Listed by: FRED DOTTERRER, BROKER $69,000Active0.17 Acres
0 Orange St, Hesperia, CA 92345
MLS# CV25173962Listed by: COLDWELL BANKER LEADERS $149,000Active0.41 Acres
0 Bear Valley Road, Hesperia, CA 92345
MLS# HD26025966Listed by: DIAMOND REALTY $50,000Active0 Acres
0 Olive, Hesperia, CA 92345
MLS# SR25149746Listed by: RE/MAX ONE $65,000Active0.39 Acres
0 Main, Hesperia, CA 92345
MLS# IG25159081Listed by: RE/MAX PARTNERS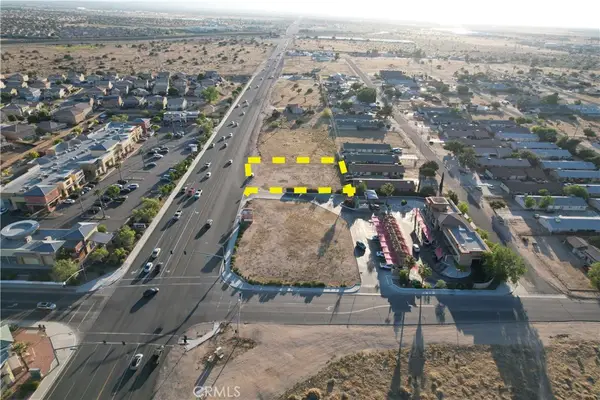 $499,888Active0.41 Acres
0 Main Street, Hesperia, CA 92345
MLS# IV25159041Listed by: PAK HOME REALTY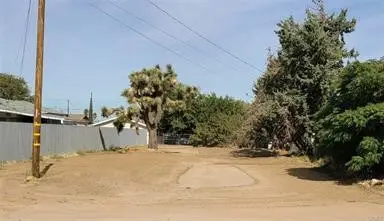 $50,000Active0.17 Acres
0 Olive Street, Hesperia, CA 92345
MLS# SR25149746Listed by: RE/MAX ONE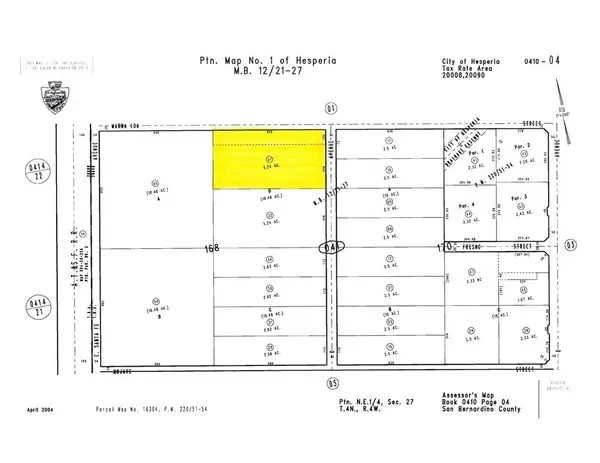 $450,000Active5.24 Acres
0 C Ave & Mauna Loa St., Hesperia, CA 92345
MLS# HD25149622Listed by: LEE & ASSOCIATES $140,000Active0.52 Acres
0 Sultana, Street, Hesperia, CA 92345
MLS# HD25147799Listed by: COLDWELL BANKER HOME SOURCE $445,000Pending2.97 Acres
0 Mesa Street, Hesperia, CA 92345
MLS# HD25146689Listed by: KLICK REALTY $369,000Active1.89 Acres
10793 G Avenue, Hesperia, CA 92345
MLS# HD25146590Listed by: KURSCH GROUP, INC. $599,000Active2.5 Acres
0 E Avenue, Hesperia, CA 92345
MLS# HD25146495Listed by: KURSCH GROUP, INC. $200,000Active2.5 Acres
108900 SF Hercules Street, Hesperia, CA 92345
MLS# HD26009989Listed by: FIRST TEAM REAL ESTATE $25,000Active10 Acres
0 Los Flores Road, Hesperia, CA 92345
MLS# HD25129256Listed by: MAJESTIC LAND, HOMES INVESTMEN $700,000Active19.09 Acres
0 Farmdale, Hesperia, CA 92345
MLS# IG25128388Listed by: RE/MAX PARTNERS $869,000Active0.7 Acres
16401 Bear Valley Road, Hesperia, CA 92345
MLS# HD25125444Listed by: RODEO REALTY $600,000Active0 Acres
0 E, Hesperia, CA 92345
MLS# HD26024073Listed by: ALAM REALTY $200,000Active2.63 Acres
0 Juniper Street, Hesperia, CA 92345
MLS# HD25105019Listed by: EXP REALTY OF SOUTHERN CA INC. $130,000Active0.86 Acres
0 Hesperia Road, Hesperia, CA 92345
MLS# HD25102304Listed by: FIRST TEAM REAL ESTATE-HIGHDES $97,500Active0.67 Acres
0 Hesperia Road, Hesperia, CA 92345
MLS# HD25261789Listed by: DIAMOND REALTY $97,500Active0 Acres
0 Hesperia, Hesperia, CA 92345
MLS# HD25261789Listed by: DIAMOND REALTY $182,400Active0.55 Acres
14550 Main Street, Hesperia, CA 92345
MLS# HD25074053Listed by: CENTURY 21 MASTERS $195,000Active0.7 Acres
0 Bear Valley Road, Hesperia, CA 92345
MLS# HD25074006Listed by: DIAMOND REALTY $19,600Active12.37 Acres
0 Tbd, Hesperia, CA 92345
MLS# HD25069239Listed by: REALTY ONE GROUP EMPIRE $699,000Active4.77 Acres
0 C Ave And Live Oak St, Hesperia, CA 92345
MLS# OC25063764Listed by: DE LA HERRAN REAL ESTATE $35,000Active0.14 Acres
0 Fresno Street, Hesperia, CA 92345
MLS# DW25056810Listed by: QUANDO REALTY, INC. $233,999Active1.24 Acres
0 G Avenue, Hesperia, CA 92345
MLS# CV25048631Listed by: LIFESTYLE REAL ESTATE $104,900Active1.1 Acres
10656 Choiceana Avenue, Hesperia, CA 92345
MLS# PW25043803Listed by: FAST ONE FINANCIAL & REALTY $130,000Active0.26 Acres
0 Walnut 4th Lot East Of 7th, Hesperia, CA 92345
MLS# IV25015930Listed by: SELECT HOMES & LAND $299,888Active0.68 Acres
0 Bear Valley Road, Hesperia, CA 92345
MLS# WS24252711Listed by: PIONEER FUDOSAN, INC. $400,000Active0 Acres
16801 Mauna Loa East, Hesperia, CA 92396
MLS# 524156Listed by: J.P. & ASSOCIATE $450,000Active0.6 Acres
1 Bear Valley Road, Hesperia, CA 92345
MLS# OC26013073Listed by: HI-DESERT INTERNATIONAL REALTY $169,000Active0.57 Acres
0 Jacaranda Avenue, Hesperia, CA 92345
MLS# CV24240940Listed by: COLDWELL BANKER BLACKSTONE RTY $199,900Active2.5 Acres
0 C Ave., Hesperia, CA 92345
MLS# IV24239392Listed by: QUALITY REAL ESTATE CORP. $700,000Active1.16 Acres
0 Main Street, Hesperia, CA 92345
MLS# 24449251Listed by: KELLER WILLIAMS REALTY LOS FELIZ $340,000Active1.3 Acres
0 Catalpa Street, Hesperia, CA 92345
MLS# HD25253555Listed by: BENCHMARK REALTORS $150,000Active5.4 Acres
0 Tower Road, Oak Hills, CA 92345
MLS# HD23151932Listed by: EXCELLENCE RE REAL ESTATE $999,999Active80 Acres
0 Middleton Ave, Hesperia, CA 92345
MLS# HD24153932Listed by: THE BRADCO COMPANIES $240,000Active23.24 Acres
0 Ranchero Road, Hesperia, CA 92345
MLS# HD24112614Listed by: NAI CAPITAL, INC. $290,000Active40 Acres
0 Las Flores Road, Hesperia, CA 92345
MLS# HD24112629Listed by: NAI CAPITAL, INC. $1,250,000Active2.5 Acres
0 395 Hwy, Hesperia, CA 92345
MLS# HD24111279Listed by: CENTURY 21 MASTERS $395,800Active1.01 Acres
0 Main Street, Hesperia, CA 92345
MLS# CV24095021Listed by: FIRST TEAM REAL ESTATE $595,000Active0.75 Acres
0 Bear Valley Road, Hesperia, CA 92392
MLS# HD25250875Listed by: COLDWELL BANKER COMMERCIAL REA $225,000Active20 Acres
0 Catfish, Hesperia, CA 92345
MLS# HD24075751Listed by: HOMEQUEST REAL ESTATE $115,000Active1.27 Acres
0 Carrissa Ave, Hesperia, CA 92345
MLS# HD24049636Listed by: MVP REALTY SOCAL, INC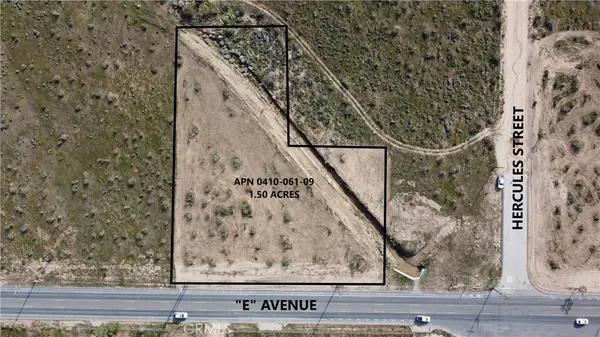 $150,000Active1.5 Acres
0 E Avenue, Hesperia, CA 92345
MLS# HD24040235Listed by: COLDWELL BANKER HOME SOURCE $843,000Active2.58 Acres
0 Live Oak Street, Hesperia, CA 92345
MLS# HD24028838Listed by: KURSCH GROUP, INC. $125,000Active0.67 Acres
0 Hesperia Road, Hesperia, CA 92345
MLS# HD25076954Listed by: DIAMOND REALTY $395,000Active2.04 Acres
0 Tamarisk Avenue, Hesperia, CA 92345
MLS# HD23052637Listed by: KURSCH GROUP, INC. $399,000Active1.11 Acres
0 Main Street, Hesperia, CA 92345
MLS# SW22229288Listed by: FARNAM & ASSOCIATES REAL ESTATE $98,000Active0.36 Acres
0 Hesperia Road, Hesperia, CA 92345
MLS# HD22180121Listed by: KURSCH GROUP, INC. $250,000Active2.23 Acres
0 G Street, Hesperia, CA 92345
MLS# 540577Listed by: FIRST TEAM REAL ESTATE-HIGHDES $300,000Active1.73 Acres
0 H Street, Hesperia, CA 92345
MLS# HD22159747Listed by: COLDWELL BANKER REALTY $150,000Active0 Acres
0 Tower, Oak Hills, CA 92345
MLS# HD23151932Listed by: EXCELLENCE RE REAL ESTATE $195,000Active0.71 Acres
0 Outer Bear Valley Road, Hesperia, CA 92345
MLS# HD22221154Listed by: COLDWELL BANKER HOME SOURCE $250,000Active0.46 Acres
0 Hesperia Road, Hesperia, CA 92345
MLS# 535148Listed by: J.P. & ASSOCIATE $600,000Active37.16 Acres
123 Main, Hesperia, CA 92345
MLS# OC23099912Listed by: VERSAILLES PROPERTY $250,000Active0 Acres
0 G, Hesperia, CA 92345
MLS# 540577Listed by: FIRST TEAM REAL ESTATE-HIGHDES $98,000Active0 Acres
0 Hesperia, Hesperia, CA 92345
MLS# HD22180121Listed by: KURSCH GROUP, INC. $300,000Active0 Acres
0 H, Hesperia, CA 92345
MLS# HD22159747Listed by: COLDWELL BANKER REALTY $1,200,000Active0 Acres
0 I, Hesperia, CA 92345
MLS# 493526Listed by: J.P. & ASSOCIATE $500,000Active0 Acres
8350 G, Hesperia, CA 92345
MLS# 528243Listed by: KELLER WILLIAMS VICTOR VALLEY $250,000Active0 Acres
0 Hesperia, Hesperia, CA 92345
MLS# 535148Listed by: J.P. & ASSOCIATE $53,000Active0.16 Acres
0 Fresno Street, Hesperia, CA 92345
MLS# IV24217639Listed by: QUALITY REAL ESTATE CORP. $148,000Active1.14 Acres
49-39914350 Jacaranda Avenue, Hesperia, CA 92345
MLS# HD23048324Listed by: COLDWELL BANKER HOME SOURCE $92,000Active1.29 Acres
0 I Avenue, Hesperia, CA 92334
MLS# TR25022240Listed by: REMAX 2000 REALTY $650,000Active2.31 Acres
14236 Main Street, Hesperia, CA 92345
MLS# HD22225792Listed by: MGR REAL ESTATE, INC $54,900Active0.2 Acres
0 Juniper Street, Hesperia, CA 92345
MLS# IV26021771Listed by: WESTCOE REALTORS INC $500,000Active3.26 Acres
8350 G Avenue, Hesperia, CA 92345
MLS# 528243Listed by: KELLER WILLIAMS VICTOR VALLEY $366,000Active79.38 Acres
0 Dukes Country Road, Hesperia, CA 92345
MLS# 535159Listed by: REALTY ONE GROUP EMPIRE $495,000Active1.02 Acres
15120 Main Street, Hesperia, CA 92345
MLS# DW23011226Listed by: EXCELLENCE RE REAL ESTATE $250,000Active2.63 Acres
0 C Avenue, Hesperia, CA 92345
MLS# PW19153625Listed by: RE/MAX UNLIMITED REAL ESTATE $1,200,000Active8.83 Acres
0 I Avenue, Hesperia, CA 92345
MLS# 493526Listed by: J.P. & ASSOCIATE $400,000Active4.78 Acres
16801 Mauna Loa Street E, Hesperia, CA 92396
MLS# 524156Listed by: J.P. & ASSOCIATE
Local realty services provided by:CENTURY 21 Fort Bragg Realty, CENTURY 21 Masters, CENTURY 21 Select Real Estate, Inc.
The information being provided by California Regional MLS (Southern California) is for the consumer's personal, non-commercial use and may not be used for any purpose other than to identify prospective properties consumer may be interested in purchasing. Any information relating to real estate for sale referenced on this web site comes from the Internet Data Exchange (IDX) program of the California Regional MLS (Southern California). CENTURY 21 Fort Bragg Realty is not a Multiple Listing Service (MLS), nor does it offer MLS access. This website is a service of CENTURY 21 Fort Bragg Realty, a broker participant of California Regional MLS (Southern California). This web site may reference real estate listing(s) held by a brokerage firm other than the broker and/or agent who owns this web site.
The accuracy of all information, regardless of source, including but not limited to open house information, square footages and lot sizes, is deemed reliable but not guaranteed and should be personally verified through personal inspection by and/or with the appropriate professionals. The data contained herein is copyrighted by California Regional MLS (Southern California) and is protected by all applicable copyright laws. Any unauthorized dissemination of this information is in violation of copyright laws and is strictly prohibited.
Copyright 2021 California Regional MLS (Southern California). All rights reserved. CRMLS Member Broker: Paul Clark
This information is deemed reliable but not guaranteed. You should rely on this information only to decide whether or not to further investigate a particular property. BEFORE MAKING ANY OTHER DECISION, YOU SHOULD PERSONALLY INVESTIGATE THE FACTS (e.g. square footage and lot size) with the assistance of an appropriate professional. You may use this information only to identify properties you may be interested in investigating further. All uses except for personal, non-commercial use in accordance with the foregoing purpose are prohibited. Redistribution or copying of this information, any photographs or video tours is strictly prohibited. This information is derived from the Internet Data Exchange (IDX) service provided by San Diego MLS®. Displayed property listings may be held by a brokerage firm other than the broker and/or agent responsible for this display. The information and any photographs and video tours and the compilation from which they are derived is protected by copyright. Compilation © 2020 San Diego MLS®, Inc. SANDICOR Member Broker: Randy Thompson
Popular searches near 92345
Popular neighborhoods near 92345
- Angeles Acres, Hesperia homes for sale
- Brentwood, Victorville homes for sale
- Cedarpines Park, Cedarpines Park homes for sale
- Country Club Manor, Apple Valley homes for sale
- Crestline, Crestline homes for sale
- Desert Knolls Estates, Apple Valley homes for sale
- Devore Heights, San Bernardino homes for sale
- Eagle Ranch, Victorville homes for sale
- Foxfire Ranch, Victorville homes for sale
- Green Tree, Victorville homes for sale
- Hesperia Palisades, Hesperia homes for sale
- Kiowa Park, Apple Valley homes for sale
- Lake Arrowhead, Lake Arrowhead homes for sale
- Lucky Star Ranchos, Hesperia homes for sale
- Mariposa Lodge, Apple Valley homes for sale
- Mission Crest, Hesperia homes for sale
- Spring Valley Lake, Victorville homes for sale
- Sun City Apple Valley, Apple Valley homes for sale
- Verdemont, San Bernardino homes for sale
- Victor Village, Victorville homes for sale
Protect your home and budget from life's surprises with an Assurant Home Warranty, backed by a partner that supports you through every step of homeownership. Explore Plans.
©2026 Century 21 Real Estate LLC. All rights reserved. CENTURY 21®, the CENTURY 21 Logo and C21® are service marks owned by Century 21 Real Estate LLC. Century 21 Real Estate LLC fully supports the principles of the Fair Housing Act and the Equal Opportunity Act. Each office is independently owned and operated. Listing information is deemed reliable but not guaranteed accurate.