- Allston homes for sale
- Arlington homes for sale
- Belmont homes for sale
- Brighton homes for sale
- Cambridge homes for sale
- Charlestown homes for sale
- Chelsea homes for sale
- East Boston homes for sale
- Everett homes for sale
- Lexington homes for sale
- Malden homes for sale
- Medford homes for sale
- Melrose homes for sale
- Saugus homes for sale
- Somerville homes for sale
- Stoneham homes for sale
- Wakefield homes for sale
- Watertown homes for sale
- Winchester homes for sale
- Woburn homes for sale
02155, MA - homes for sale
128 of 128 results displayed
- New
 $1,780,000Active8 beds 4 baths3,411 sq. ft.
33 Farragut Ave, Medford, MA 02155
MLS# 73532883Listed by: Doherty Properties - New
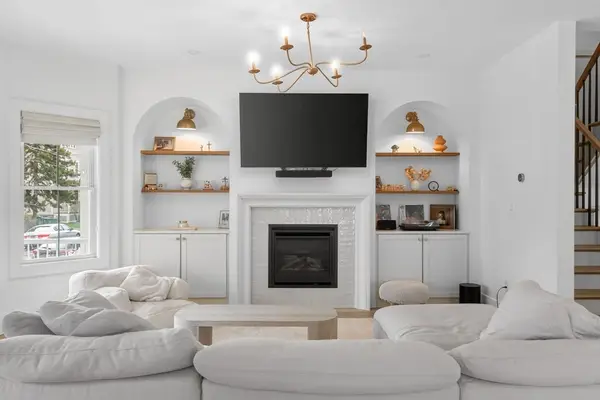
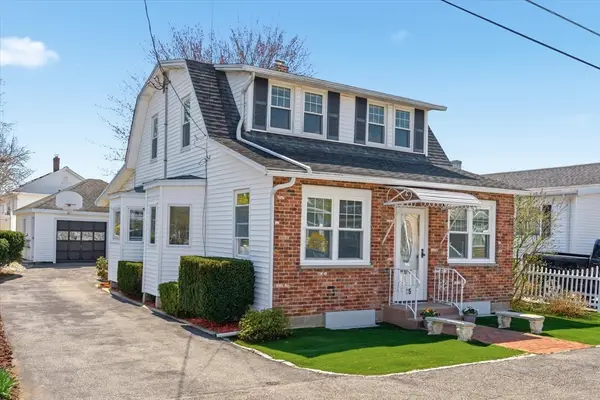
 $999,000Active4 beds 3 baths2,098 sq. ft.
37 Sheridan Ave #1, Medford, MA 02155
MLS# 73532637Listed by: Compass - Open Sat, 11am to 1pmNew
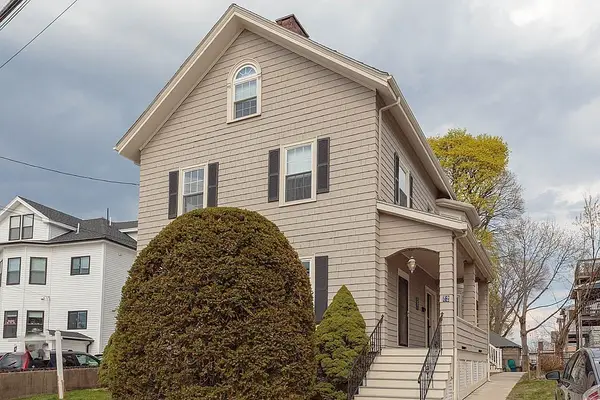
 $1,100,000Active3 beds 3 baths1,796 sq. ft.
160 Brooks St, Medford, MA 02155
MLS# 73531396Listed by: Costello Realty Group, Inc. - Open Sat, 11am to 1pmNew
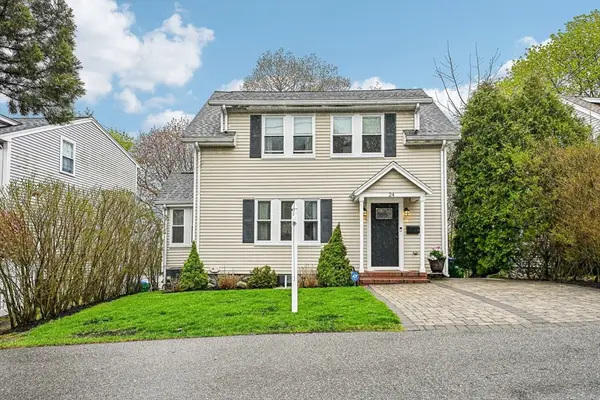
 $999,999Active5 beds 2 baths2,188 sq. ft.
178-180 Brookside Pkwy, Medford, MA 02155
MLS# 73531139Listed by: RE/MAX Bell Park Realty - New
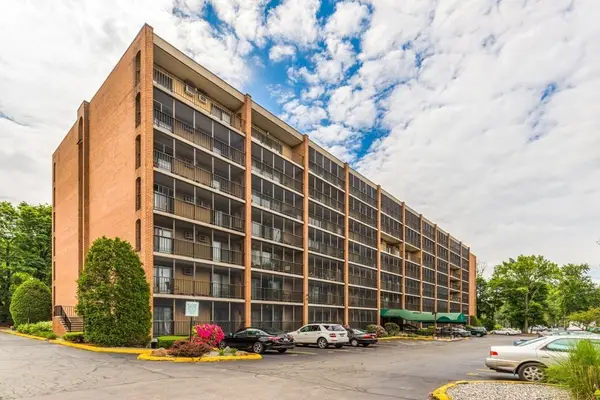
 $449,000Active1 beds 1 baths715 sq. ft.
21 Bradlee Rd #54, Medford, MA 02155
MLS# 73530415Listed by: Serhant - New
 $432,000Active2 beds 1 baths888 sq. ft.
235 Winthrop St #2205, Medford, MA 02155
MLS# 73530275Listed by: Century 21 North East - New
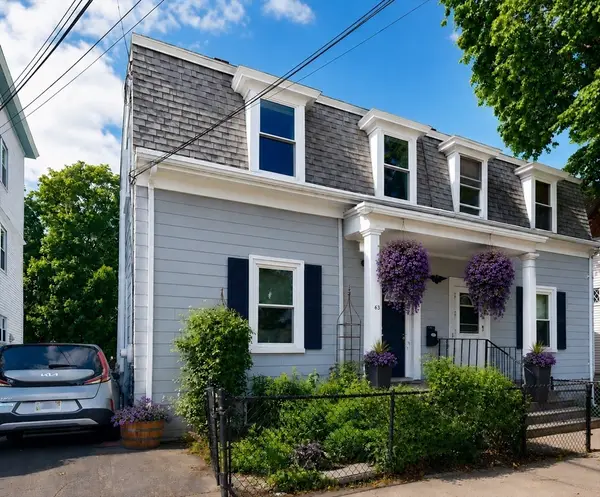 $849,000Active3 beds 2 baths1,200 sq. ft.
63 Albion, Medford, MA 02155
MLS# 73529885Listed by: RE/MAX Real Estate Center - New
 $1,025,900Active2 beds 2 baths1,291 sq. ft.
100 Station Landing #712, Medford, MA 02155
MLS# 73529782Listed by: Dreamega International Realty LLC - New
 $729,900Active2 beds 1 baths972 sq. ft.
58 Horne Ave, Medford, MA 02155
MLS# 73529675Listed by: Century 21 North East - Open Sat, 12 to 1:30pmNew
 $439,000Active2 beds 1 baths888 sq. ft.
235 Winthrop St. #4405, Medford, MA 02155
MLS# 73529414Listed by: Leading Edge Real Estate - New
 $1,399,000Active3 beds 3 baths2,072 sq. ft.
34 Salem #201, Medford, MA 02155
MLS# 73529153Listed by: Compass - New
 $1,595,000Active4 beds 5 baths2,893 sq. ft.
12 Powder House Rd Ext, Medford, MA 02155
MLS# 73529155Listed by: REMAX Andrew Realty Services - New
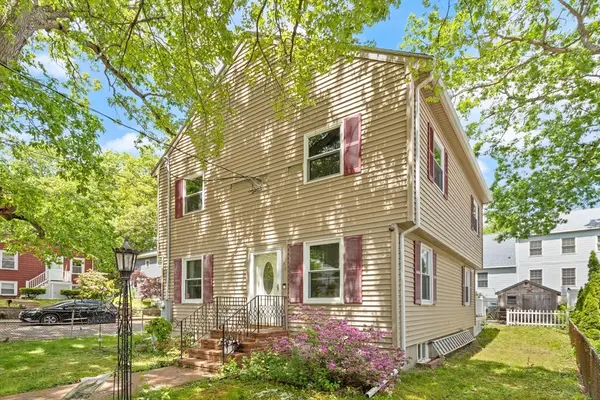
 $739,000Active4 beds 1 baths1,349 sq. ft.
93 Prescott St, Medford, MA 02155
MLS# 73529195Listed by: Cameron Prestige, LLC - New
 $750,000Active3 beds 2 baths1,215 sq. ft.
11 Pitcher Ave #11, Medford, MA 02155
MLS# 73529055Listed by: Gibson Sotheby's International Realty - New
 $689,000Active2 beds 2 baths822 sq. ft.
326 Main Street #6, Medford, MA 02155
MLS# 73528785Listed by: U3 Realty, LLC - New
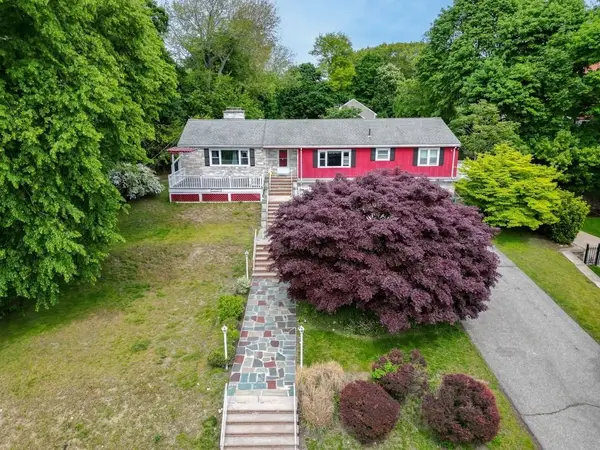 $1,395,000Active5 beds 4 baths2,696 sq. ft.
179 Woburn St, Medford, MA 02155
MLS# 73528457Listed by: Keller Williams Realty - New
 $1,299,000Active4 beds 3 baths1,600 sq. ft.
14 Wareham, Medford, MA 02155
MLS# 73527397Listed by: Berkshire Hathaway HomeServices Commonwealth Real Estate  $1,150,000Active3 beds 3 baths1,638 sq. ft.
20 Mystic #2, Medford, MA 02155
MLS# 73526334Listed by: Flow Realty, Inc.- Open Sat, 10:30 to 11:30am
 $675,000Active2 beds 2 baths1,198 sq. ft.
68 Central Ave #304, Medford, MA 02155
MLS# 73526200Listed by: Coldwell Banker Realty - Lexington  $1,195,000Active5 beds 2 baths2,276 sq. ft.
72 Winchester St, Medford, MA 02155
MLS# 73525806Listed by: Redfin Corp. $659,000Active2 beds 2 baths1,132 sq. ft.
179 Park St #403, Medford, MA 02155
MLS# 73525807Listed by: Phoenix Real Estate Partners, LLC $749,900Active4 beds 2 baths1,856 sq. ft.
31 Sharon St., Medford, MA 02155
MLS# 73525758Listed by: Century 21 North East $699,900Active2 beds 1 baths1,175 sq. ft.
36 Ashland #36, Medford, MA 02155
MLS# 73525797Listed by: Flow Realty, Inc. $1,129,000Active3 beds 3 baths2,230 sq. ft.
54 South St, Medford, MA 02155
MLS# 73525722Listed by: REMAX Andrew Realty Services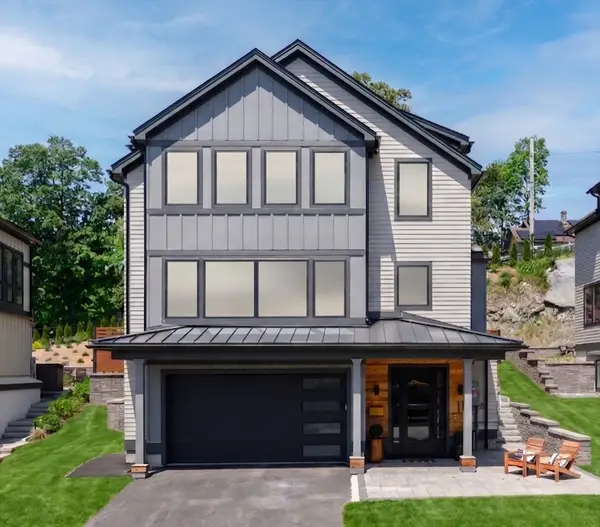 $1,949,000Active4 beds 5 baths3,813 sq. ft.
11 Mary Kenney Way, Medford, MA 02155
MLS# 73514932Listed by: HomeSmart First Class Realty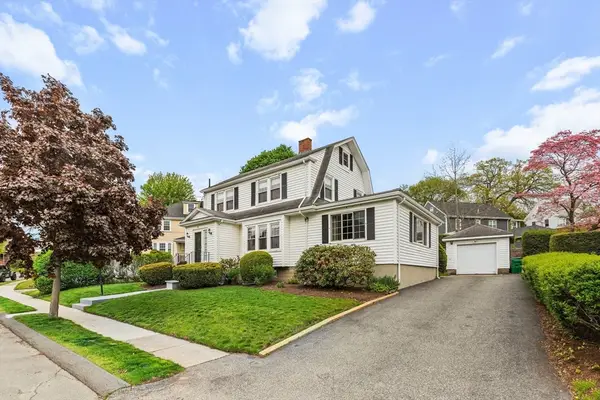 $949,000Active4 beds 2 baths2,075 sq. ft.
35 Badger Rd, Medford, MA 02155
MLS# 73525152Listed by: William Raveis R.E. & Home Services $899,900Active3 beds 2 baths1,744 sq. ft.
36 Ripley Rd, Medford, MA 02155
MLS# 73524909Listed by: Compass $995,000Active4 beds 3 baths2,575 sq. ft.
130 Gaston St, Medford, MA 02155
MLS# 73524892Listed by: Keller Williams Realty Boston Northwest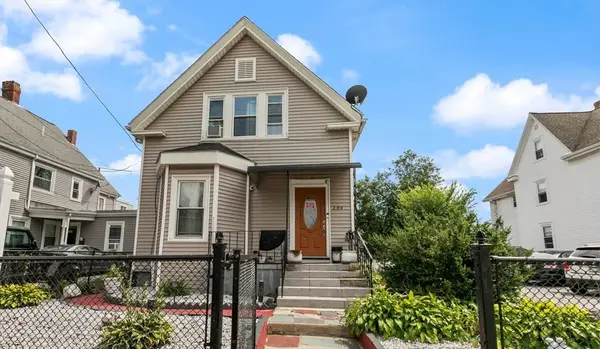 $1,200,000Active4 beds 3 baths2,068 sq. ft.
204 Harvard, Medford, MA 02155
MLS# 73524747Listed by: Keller Williams Realty- Open Sat, 12 to 1:30pm
 $918,000Active3 beds 2 baths1,518 sq. ft.
24 Fellsview Ave, Medford, MA 02155
MLS# 73524648Listed by: Maria Fabiano Realty - Open Sat, 11am to 12:30pm
 $1,188,000Active4 beds 3 baths2,053 sq. ft.
47 Essex St, Medford, MA 02155
MLS# 73524682Listed by: Redfin Corp.  $1,285,000Active5 beds 2 baths3,008 sq. ft.
91 Dudley St, Medford, MA 02155
MLS# 73524507Listed by: oNest Real Estate $699,900Active3 beds 1 baths1,404 sq. ft.
97 Taft Street, Medford, MA 02155
MLS# 73524482Listed by: Classified Realty Group $799,900Active4 beds 2 baths1,542 sq. ft.
1 Newport Ave, Medford, MA 02155
MLS# 73524287Listed by: Compass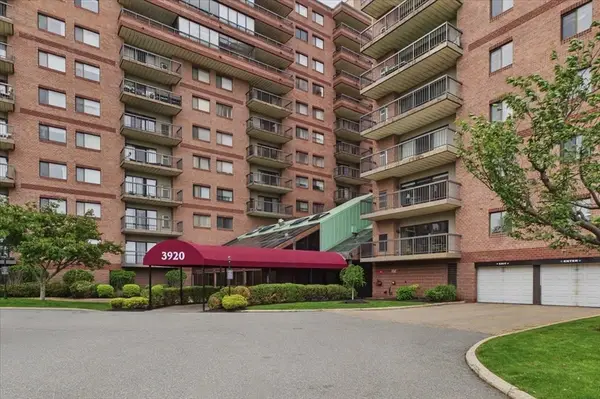 $549,000Active2 beds 2 baths1,226 sq. ft.
3920 Mystic Valley Pkwy #118, Medford, MA 02155
MLS# 73524118Listed by: Compass $549,900Active2 beds 2 baths1,107 sq. ft.
100 High St. #208, Medford, MA 02155
MLS# 73524176Listed by: LAER Realty Partners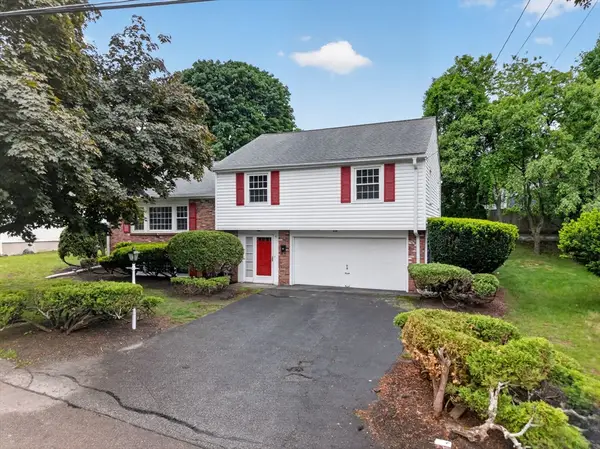 $879,000Active3 beds 3 baths1,714 sq. ft.
4 Apache Trail, Medford, MA 02155
MLS# 73524231Listed by: Maria Fabiano Realty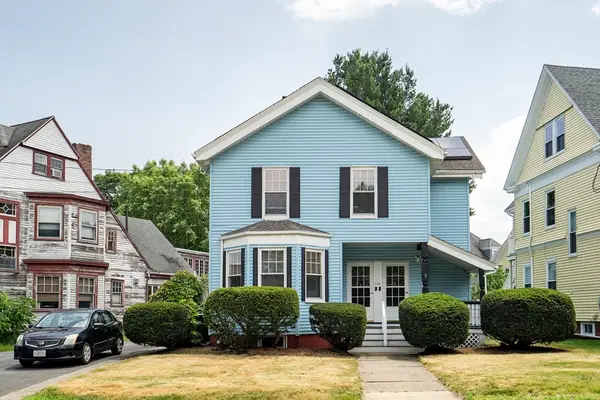 $1,200,000Active5 beds 3 baths3,499 sq. ft.
548 High St, Medford, MA 02155
MLS# 73524052Listed by: Red Tree Real Estate $699,900Active3 beds 2 baths1,370 sq. ft.
154 Fellsway West #3, Medford, MA 02155
MLS# 73524059Listed by: Cameron Prestige, LLC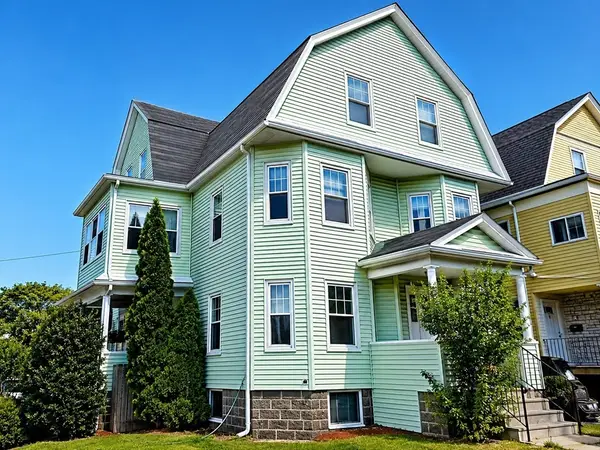 $1,475,000Active8 beds 2 baths3,693 sq. ft.
27 Princeton St, Medford, MA 02155
MLS# 73523617Listed by: Jacob Realty, LLC $774,999Active3 beds 2 baths1,320 sq. ft.
117 Fern Rd, Medford, MA 02155
MLS# 73522714Listed by: Coldwell Banker Realty - Easton $839,000Active3 beds 2 baths1,872 sq. ft.
189 Playstead Road, Medford, MA 02155
MLS# 73522600Listed by: Lamacchia Realty, Inc. $479,900Active2 beds 2 baths1,192 sq. ft.
190 High St #509, Medford, MA 02155
MLS# 73522537Listed by: Century 21 North East $275,000Active0.11 Acres
Lot 201 Rock Glen, Medford, MA 02155
MLS# 73522326Listed by: Thompson Realty $950,000Active3 beds 1 baths1,688 sq. ft.
17 Sharon St, Medford, MA 02155
MLS# 73520789Listed by: Gibson Sotheby's International Realty $905,000Active2 beds 2 baths1,471 sq. ft.
320 Middlesex Ave #B205, Medford, MA 02155
MLS# 73520134Listed by: Smith and Oak Real Estate Co. $684,999Active1 beds 1 baths1,055 sq. ft.
320 Middlesex Ave #D103, Medford, MA 02155
MLS# 73520036Listed by: Block Realty $1,299,900Active6 beds 2 baths3,240 sq. ft.
38 Pembroke St, Medford, MA 02155
MLS# 73519648Listed by: Redfin Corp.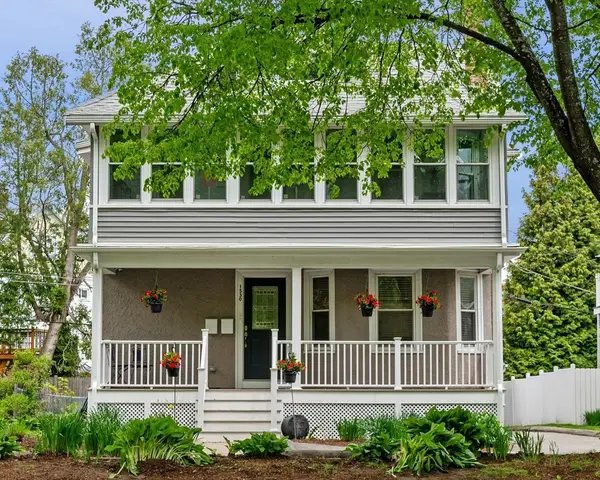 $800,000Active3 beds 1 baths1,181 sq. ft.
1530 Mystic Valley Parkway #1, Medford, MA 02155
MLS# 73519325Listed by: Charlesgate Realty Group LLC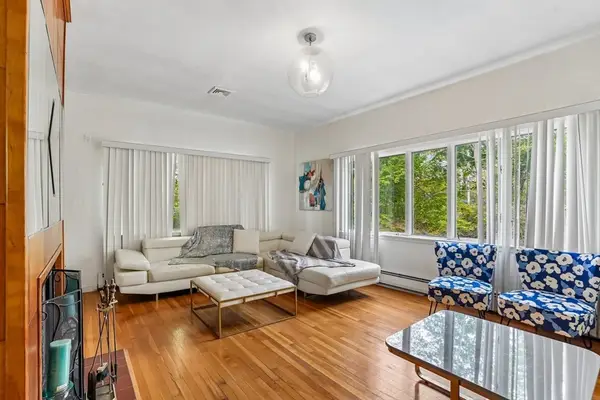 $1,079,000Active5 beds 3 baths2,350 sq. ft.
259 Forest Street, Medford, MA 02155
MLS# 73518902Listed by: Century 21 North East- Open Sat, 11am to 12:30pm
 $1,499,900Active5 beds 5 baths3,889 sq. ft.
57 Myrtle St #57, Medford, MA 02155
MLS# 73518590Listed by: Serhant  $459,000Active1 beds 1 baths826 sq. ft.
3920 Mystic Valley Parkway Uni #708, Medford, MA 02155
MLS# 73517987Listed by: eXp Realty LLC - Corporate Office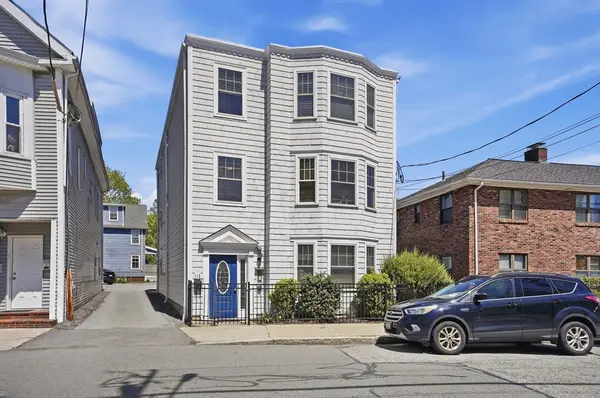 $649,000Active2 beds 2 baths1,267 sq. ft.
112 Washington Street #3, Medford, MA 02155
MLS# 73517629Listed by: Lamacchia Realty, Inc.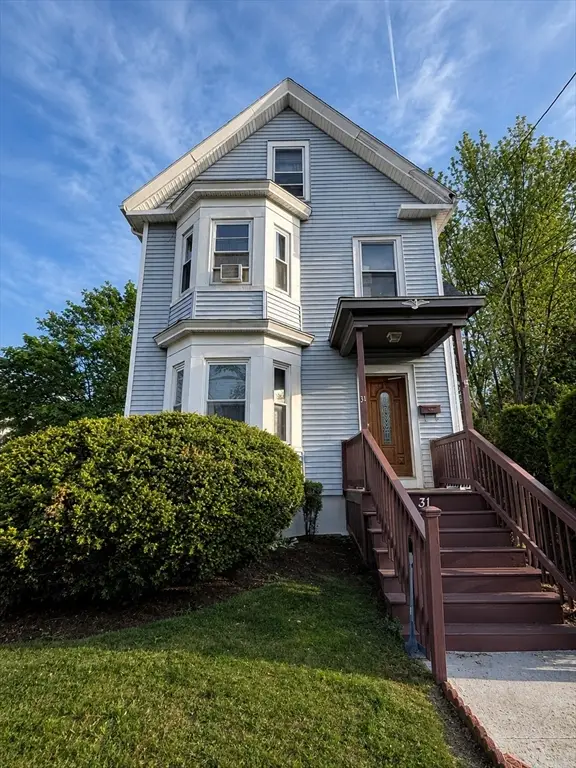 $739,999Active3 beds 2 baths1,712 sq. ft.
31 Central Ave, Medford, MA 02155
MLS# 73517469Listed by: Cameron Real Estate Group $830,000Active3 beds 1 baths1,828 sq. ft.
61 Central Ave, Medford, MA 02155
MLS# 73515839Listed by: Charlesgate Realty Group, llc $719,000Active1 beds 1 baths877 sq. ft.
87 Medford Street #407, Medford, MA 02145
MLS# 73517288Listed by: Gibson Sotheby's International Realty $1,200,000Active5 beds 3 baths2,400 sq. ft.
17 Chery St #1, Medford, MA 02155
MLS# 73515488Listed by: My First Realty Group $1,100,000Active5 beds 3 baths2,280 sq. ft.
17 Cherry St #2, Medford, MA 02155
MLS# 73515491Listed by: My First Realty Group $1,125,000Active5 beds 2 baths2,613 sq. ft.
4-6 West Street, Medford, MA 02155
MLS# 73514941Listed by: Coldwell Banker Realty - Milton $779,999Active3 beds 3 baths1,524 sq. ft.
15 Murray Hill Rd, Medford, MA 02155
MLS# 73514277Listed by: Century 21 North East $929,000Active4 beds 2 baths2,408 sq. ft.
10 Oak Bluff St, Medford, MA 02155
MLS# 73514131Listed by: Anderson Realty Partners $895,000Active3 beds 3 baths2,310 sq. ft.
12 Ship Ave #1, Medford, MA 02155
MLS# 73514150Listed by: PWK Realty LLC $919,900Active2 beds 2 baths1,432 sq. ft.
320 Middlesex Ave #E307, Medford, MA 02155
MLS# 73513570Listed by: Leading Edge Real Estate- Open Sat, 12 to 1pm
 $1,875,000Active5 beds 4 baths3,531 sq. ft.
26-28 Pitcher Ave, Medford, MA 02155
MLS# 73513006Listed by: Gibson Sotheby's International Realty - Open Sat, 12 to 1pm
 $899,000Active2 beds 2 baths1,591 sq. ft.
26 Pitcher Ave #1, Medford, MA 02155
MLS# 73512998Listed by: Gibson Sotheby's International Realty  $925,000Active2 beds 2 baths1,223 sq. ft.
100 Station Landing #1101, Medford, MA 02155
MLS# 73513344Listed by: Fenway Property Advisors- Open Sat, 12 to 1pm
 $999,000Active3 beds 2 baths1,940 sq. ft.
28 Pitcher Ave #2, Medford, MA 02155
MLS# 73512997Listed by: Gibson Sotheby's International Realty - Open Thu, 10:30 to 11:30am
 $1,999,900Active7 beds 5 baths3,718 sq. ft.
7-9 Second St, Medford, MA 02155
MLS# 73512748Listed by: Gibson Sotheby's International Realty  $1,850,000Active5 beds 5 baths4,177 sq. ft.
77 Wolcott Street, Medford, MA 02155
MLS# 73509095Listed by: The Lovely Advisory LLC $1,205,000Active2 beds 2 baths1,787 sq. ft.
421 High St #309, Medford, MA 02155
MLS# 73512349Listed by: Douglas Elliman Real Estate - The Sarkis Team $519,900Active2 beds 2 baths1,119 sq. ft.
235 Winthrop St #4401, Medford, MA 02155
MLS# 73511230Listed by: REMAX Andrew Realty Services- Open Fri, 5 to 7pm
 $939,000Active3 beds 2 baths1,740 sq. ft.
65 Hillsdale Rd #U1, Medford, MA 02155
MLS# 73506251Listed by: LAER Realty Partners  $1,249,000Active4 beds 3 baths2,832 sq. ft.
13 Leyden St, Medford, MA 02155
MLS# 73509931Listed by: Thread Real Estate, LLC $1,089,000Active4 beds 3 baths1,715 sq. ft.
16 Willard Ave #1, Medford, MA 02155
MLS# 73509812Listed by: Compass $649,000Active2 beds 2 baths1,050 sq. ft.
19 Fourth St #19, Medford, MA 02155
MLS# 73509469Listed by: Better Homes and Gardens Real Estate - The Shanahan Group $1,099,900Active5 beds 2 baths2,415 sq. ft.
57 Lawrence Street, Medford, MA 02155
MLS# 73509373Listed by: Mass Realty Properties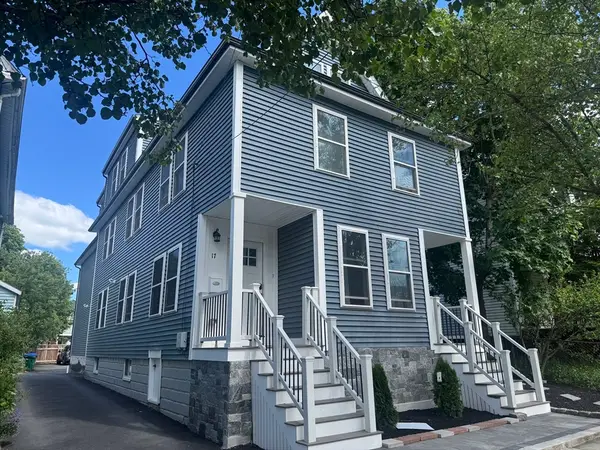 $2,299,900Active10 beds 6 baths4,680 sq. ft.
17 Cherry Street, Medford, MA 02155
MLS# 73509374Listed by: My First Realty Group- Open Sat, 10:30am to 12pm
 $1,399,900Active4 beds 4 baths3,187 sq. ft.
17 Manning St #17, Medford, MA 02155
MLS# 73509125Listed by: Keller Williams Realty Boston Northwest 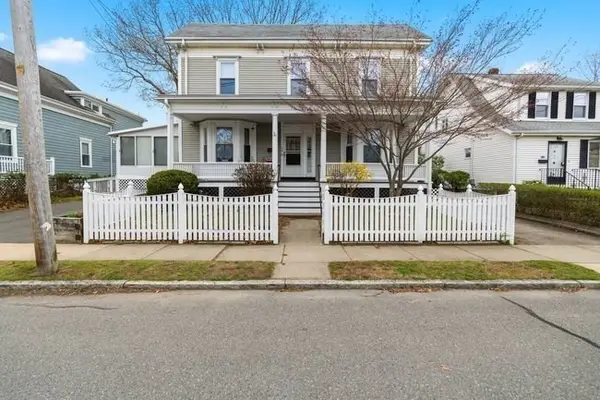 $1,049,000Active5 beds 2 baths2,155 sq. ft.
92 Dudley St, Medford, MA 02155
MLS# 73507486Listed by: Welcome Home Properties, Inc.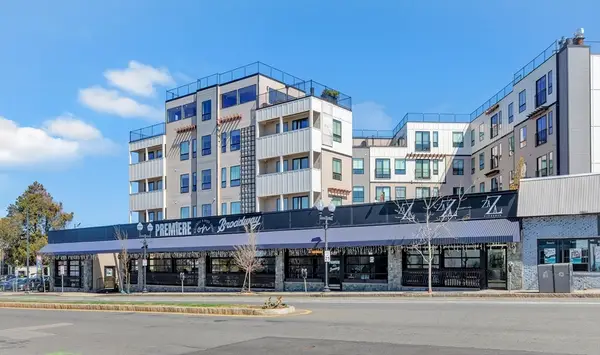 $719,000Active1 beds 1 baths877 sq. ft.
519 Broadway #407, Somerville, MA 02145
MLS# 73505824Listed by: Gibson Sotheby's International Realty $779,000Active6 beds 2 baths1,820 sq. ft.
525 Winthrop St, Medford, MA 02155
MLS# 73504792Listed by: Elia Realty Group, Inc $645,800Active1 beds 1 baths690 sq. ft.
87 Medford St #215, Medford, MA 02155
MLS# 73504554Listed by: Hooli Homes Boston $915,000Active2 beds 2 baths1,474 sq. ft.
320 Middlesex Avenue #B209, Medford, MA 02155
MLS# 73503404Listed by: Redfin Corp. $977,000Active4 beds 2 baths1,948 sq. ft.
123 Willis Ave, Medford, MA 02155
MLS# 73503117Listed by: Gibson Sotheby's International Realty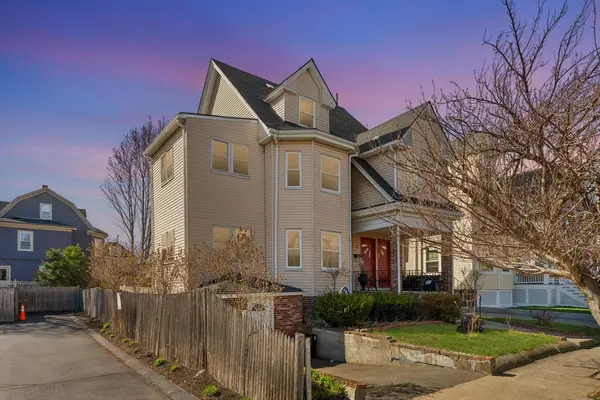 $1,100,000Active6 beds 3 baths2,513 sq. ft.
92 Sheridan Ave, Medford, MA 02155
MLS# 73502964Listed by: eXp Realty- Open Sat, 11:30am to 1:30pm
 $735,000Active3 beds 2 baths1,554 sq. ft.
25 Wason St., Medford, MA 02155
MLS# 73502829Listed by: Competitive Edge Real Estate Services - Open Thu, 5:30 to 7pm
 $1,075,000Active6 beds 3 baths3,069 sq. ft.
72 College Ave, Medford, MA 02155
MLS# 73502067Listed by: LAER Realty Partners 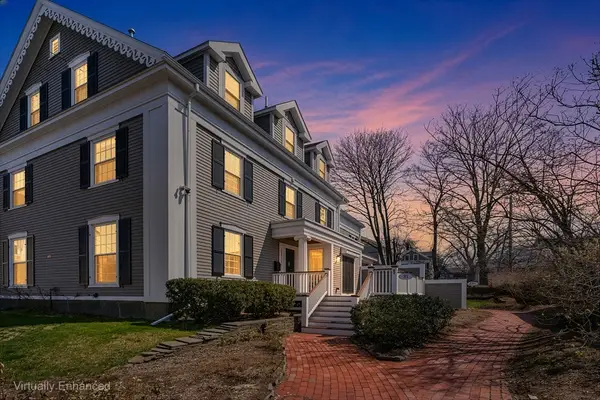 $925,000Active3 beds 2 baths2,172 sq. ft.
81 Forest St #81, Medford, MA 02155
MLS# 73501707Listed by: Redfin Corp. $1,799,900Active9 beds 3 baths4,128 sq. ft.
320 Fellsway West, Medford, MA 02155
MLS# 73501633Listed by: Coldwell Banker Realty - Concord $775,000Active2 beds 2 baths1,272 sq. ft.
244 Central Ave #2, Medford, MA 02155
MLS# 73501237Listed by: Coldwell Banker Realty - Lynnfield $999,900Active2 beds 2 baths1,228 sq. ft.
519 Broadway #305, Somerville, MA 02145
MLS# 73500460Listed by: RE/MAX Real Estate Center $999,900Active3 beds 3 baths1,825 sq. ft.
179 Main St #1, Medford, MA 02155
MLS# 73499416Listed by: REMAX Andrew Realty Services $1,199,000Active3 beds 3 baths2,220 sq. ft.
28 Cherry St #28, Medford, MA 02155
MLS# 73498990Listed by: Blue Ocean Realty, LLC $1,399,000Active7 beds 3 baths3,488 sq. ft.
15-17 Golden Ave, Medford, MA 02155
MLS# 73498708Listed by: Colombo Real Estate LLC $999,900Active2 beds 2 baths1,228 sq. ft.
87 Medford St. #305, Medford, MA 02155
MLS# 73498495Listed by: RE/MAX Real Estate Center $399,000Active2 beds 1 baths792 sq. ft.
50 Water Street #46, Medford, MA 02155
MLS# 73497877Listed by: Classified Realty Group $950,000Active6 beds 2 baths2,070 sq. ft.
82 Second Street, Medford, MA 02155
MLS# 73497519Listed by: Advanced Realty Company $485,000Active1 beds 1 baths742 sq. ft.
21 Bradlee Rd #32, Medford, MA 02155
MLS# 73497389Listed by: Compass $925,000Active2 beds 2 baths1,265 sq. ft.
100 Station Lndg #702, Medford, MA 02155
MLS# 73497355Listed by: Greater Boston Rental & Sales $485,000Active1 beds 2 baths841 sq. ft.
54 Forest Street #320, Medford, MA 02155
MLS# 73496042Listed by: The Minuteman Realty Group $829,000Active2 beds 2 baths1,146 sq. ft.
421 High St #101A, Medford, MA 02155
MLS# 73495174Listed by: Douglas Elliman Real Estate - The Sarkis Team $849,000Active3 beds 3 baths1,554 sq. ft.
34 Salem St #301, Medford, MA 02155
MLS# 73495009Listed by: 1M Realty LLC $849,000Active3 beds 2 baths1,924 sq. ft.
177 Brooks Street, Medford, MA 02155
MLS# 73494350Listed by: Coldwell Banker Realty - Waltham $809,900Active2 beds 2 baths1,372 sq. ft.
244 Central Ave #5, Medford, MA 02155
MLS# 73494019Listed by: Coldwell Banker Realty - Lexington $1,975,000Active9 beds 8 baths5,373 sq. ft.
24 Linden St, Medford, MA 02155
MLS# 73493817Listed by: Northeast Private Client Group, LLC $368,000Active1 beds 1 baths596 sq. ft.
297 Main St #3, Medford, MA 02155
MLS# 73491586Listed by: Gibson Sotheby's International Realty $695,000Active2 beds 1 baths1,222 sq. ft.
7 Smith Street #2, Medford, MA 02155
MLS# 73489378Listed by: Centre Realty Group $625,000Active2 beds 1 baths1,056 sq. ft.
7 Smith Street #1, Medford, MA 02155
MLS# 73489323Listed by: Centre Realty Group $1,300,000Active4 beds 2 baths2,278 sq. ft.
7 Smith Street, Medford, MA 02155
MLS# 73487790Listed by: Centre Realty Group $749,999Active3 beds 1 baths1,187 sq. ft.
23 Murray Hill Rd, Medford, MA 02155
MLS# 73487365Listed by: eXp Realty $499,000Active1 beds 1 baths742 sq. ft.
21 Bradlee Rd #52, Medford, MA 02155
MLS# 73486410Listed by: Errico Realty, LLC $689,900Active2 beds 1 baths805 sq. ft.
421 High St #203B, Medford, MA 02155
MLS# 73485391Listed by: Douglas Elliman Real Estate - The Sarkis Team $375,000Active0.1 Acres
12 Gaston St, Medford, MA 02155
MLS# 73483673Listed by: Escalate Real Estate $650,000Active1 beds 1 baths1,019 sq. ft.
240 Salem St #3B, Medford, MA 02155
MLS# 73482945Listed by: Gibson Sotheby's International Realty $1,049,000Active4 beds 3 baths2,136 sq. ft.
122 Woodruff Ave #122, Medford, MA 02155
MLS# 73478580Listed by: Keller Williams Realty Boston Northwest $759,900Active3 beds 2 baths1,700 sq. ft.
2500 Mystic Valley Pkwy #401, Medford, MA 02155
MLS# 73474441Listed by: Arcieri Real Estate $840,000Active6 beds 2 baths2,256 sq. ft.
49 Baxter St, Medford, MA 02155
MLS# 73469955Listed by: oNest Real Estate $1,799,900Active4 beds 5 baths3,700 sq. ft.
545 Winthrop St. #Lot 6, Medford, MA 02155
MLS# 73462164Listed by: Serhant $649,000Active2 beds 2 baths1,206 sq. ft.
3920 Mystic Valley Pkwy #303, Medford, MA 02155
MLS# 73458026Listed by: LAER Realty Partners $1,290,000Active4 beds 4 baths2,798 sq. ft.
15-17 Colby St, Medford, MA 02155
MLS# 73490309Listed by: Flow Realty, Inc. $1,129,000Active3 beds 3 baths2,230 sq. ft.
54 South St #5, Medford, MA 02155
MLS# 73436200Listed by: REMAX Andrew Realty Services $550,000Active2 beds 1 baths1,079 sq. ft.
314 Riverside Ave #305, Medford, MA 02155
MLS# 73428194Listed by: Gibson Sotheby's International Realty $1,100,000Active4 beds 3 baths3,500 sq. ft.
63 Doonan St, Medford, MA 02155
MLS# 73372058Listed by: Brad Hutchinson Real Estate $799,000Active0.34 Acres
Lot 126 South Border Rd, Winchester, MA 01890
MLS# 73187810Listed by: Better Homes and Gardens Real Estate - The Shanahan Group $609,000Active2 beds 2 baths1,130 sq. ft.
235 Winthrop St #3302, Medford, MA 02155
MLS# 73175408Listed by: Get Listed Realty, LLC $1,160,000Active3 beds 3 baths1,915 sq. ft.
252 Main St #103, Medford, MA 02155
MLS# 73112829Listed by: Keller Williams Realty Cambridge $1,285,000Active3 beds 3 baths1,896 sq. ft.
252 Main St #PH302, Medford, MA 02155
MLS# 73106840Listed by: Keller Williams Realty Cambridge $769,000Active3 beds 2 baths1,664 sq. ft.
39 Cross St, Medford, MA 02155
MLS# 73102992Listed by: Thread Real Estate, LLC
Local realty services provided by:CENTURY 21 Mario Real Estate
Popular searches near 02155
Popular neighborhoods near 02155
- Ball Square, Somerville homes for sale
- Bell Rock, Malden homes for sale
- Davis Square, Somerville homes for sale
- Downtown Medford, Medford homes for sale
- Glenwood, Medford homes for sale
- Hillside, Somerville homes for sale
- Lawrence Estates, Medford homes for sale
- Magoun Square, Somerville homes for sale
- Medford Hillside, Medford homes for sale
- North Cambridge, Cambridge homes for sale
- North Medford, Medford homes for sale
- Oak Grove, Melrose homes for sale
- Porter Square, Somerville homes for sale
- South Medford, Medford homes for sale
- Teele Square, Somerville homes for sale
- Wellington, Medford homes for sale
- West End, Malden homes for sale
- West Medford, Medford homes for sale
- Winter Hill, Somerville homes for sale
- Wyoming, Melrose homes for sale
Counties near Medford, 02155
- Barnstable County homes for sale
- Bristol County homes for sale
- Bristol County homes for sale
- Cheshire County homes for sale
- Essex County homes for sale
- Hillsborough County homes for sale
- Kent County homes for sale
- Merrimack County homes for sale
- Middlesex County homes for sale
- Newport County homes for sale
- Norfolk County homes for sale
- Northeastern Connecticut County homes for sale
- Plymouth County homes for sale
- Providence County homes for sale
- Rockingham County homes for sale
- Strafford County homes for sale
- Suffolk County homes for sale
- Windham County homes for sale
- Worcester County homes for sale
- York County homes for sale
Protect your home and budget from life's surprises with an Assurant Home Warranty, backed by a partner that supports you through every step of homeownership. Explore Plans.
©2026 Century 21 Real Estate LLC. All rights reserved. CENTURY 21®, the CENTURY 21 Logo and C21® are service marks owned by Century 21 Real Estate LLC. Century 21 Real Estate LLC fully supports the principles of the Fair Housing Act and the Equal Opportunity Act. Each office is independently owned and operated. Listing information is deemed reliable but not guaranteed accurate.