- Bancroft homes for sale
- Bath charter township homes for sale
- Bennington homes for sale
- Burns homes for sale
- Conway homes for sale
- Fowlerville homes for sale
- Haslett homes for sale
- Haslett homes for sale
- Laingsburg homes for sale
- Laingsburg homes for sale
- Leroy homes for sale
- Morrice homes for sale
- Perry homes for sale
- Perry Township homes for sale
- Sciota homes for sale
- Shiawassee Township homes for sale
- Webberville homes for sale
- Williamston homes for sale
- Williamstown homes for sale
- Woodhull homes for sale
48872, MI - homes for sale
11 of 11 results displayed
 $45,000Active2.05 Acres
4949 W Beard Road, Perry, MI 48872
MLS# 20261020230Listed by: VISION REALTY CENTERS
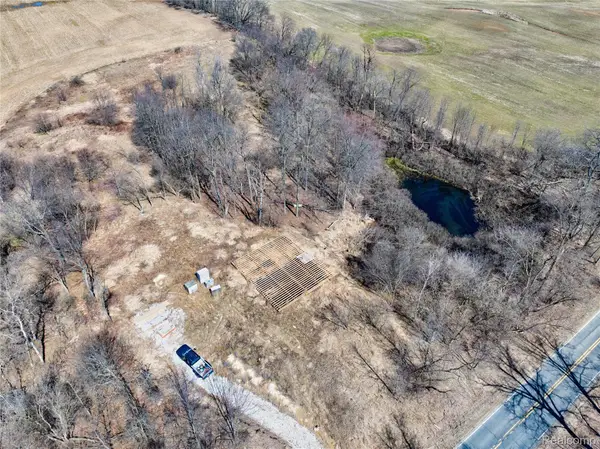
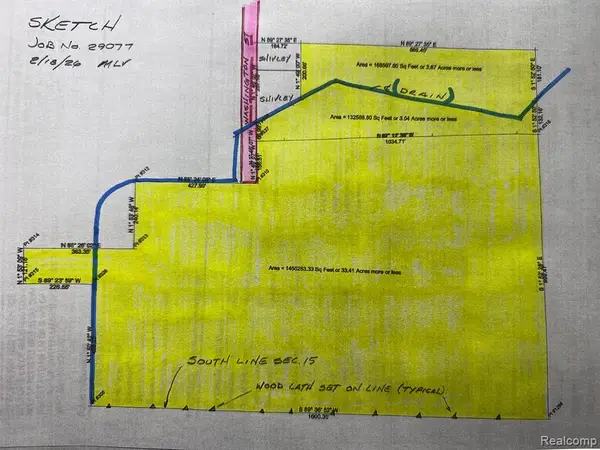 $450,000Active40 Acres
VL Washington, Perry, MI 48872
MLS# 50202288Listed by: KELLER WILLIAMS FIRST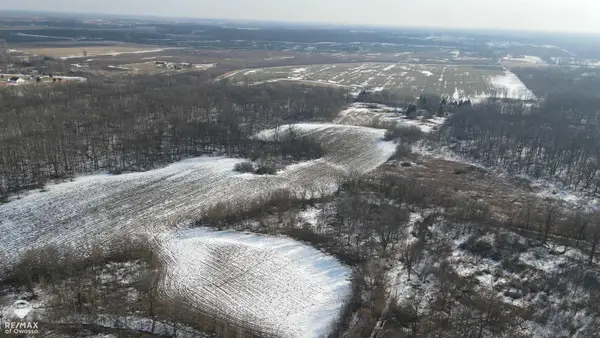 $560,000Active70 Acres
Lovejoy, Perry, MI 48872
MLS# 50201964Listed by: RE/MAX OF OWOSSO $150,000Active21 Acres
Vacant Land Tyrrell, Owosso, MI 48857
MLS# 50196035Listed by: KORI SHOOK & ASSOCIATES $264,900Active35.5 Acres
35.5 V/L Lovejoy, Perry, MI 48872
MLS# 26000487Listed by: WILDLIFE REALTY $42,900Active0 Acres
807 Little Creek Path, Perry, MI 48872
MLS# 292422Listed by: COLDWELL BANKER PROFESSIONALS-E.L. $42,900Active0 Acres
603 Country Drive, Perry, MI 48872
MLS# 292405Listed by: COLDWELL BANKER PROFESSIONALS-E.L. $42,900Active1 Acres
712 Starlight Way, Perry, MI 48872
MLS# 292406Listed by: COLDWELL BANKER PROFESSIONALS-E.L.
 $999,900Active1.7 Acres
10980 S M 52, Perry, MI 48872
MLS# 290533Listed by: CENTURY 21 AFFILIATED $39,875Pending0 Acres
4 Blue Water Way, Perry, MI 48872
MLS# 278316Listed by: COLDWELL BANKER PROFESSIONALS-E.L. $21,500Pending1 Acres
0 M-52, Perry, MI 48872
MLS# 261982Listed by: COLDWELL BANKER PROFESSIONALS-E.L.
Local realty services provided by:CENTURY 21 Metro Brokers, CENTURY 21 Northland, CENTURY 21 Bayshore Real Estate, CENTURY 21 Affiliated
Popular searches near 48872
Popular neighborhoods near 48872
- Baker, Lansing homes for sale
- Bingham, Lansing homes for sale
- Chesterfield Hills, East Lansing homes for sale
- College Fields, Okemos homes for sale
- Creston, Lansing homes for sale
- Eastside, Lansing homes for sale
- Fairview Area, Lansing homes for sale
- Forest View, Lansing homes for sale
- Foster, Lansing homes for sale
- Green Oak, Lansing homes for sale
- Green Oaks, Lansing homes for sale
- Groesbeck, Lansing homes for sale
- Holmes Street, Lansing homes for sale
- Hunter Park East, Lansing homes for sale
- Hunter Park West, Lansing homes for sale
- Lilac Lawn Farm, East Lansing homes for sale
- Northtown, Lansing homes for sale
- Northwestside, Lansing homes for sale
- Potter Walsh, Lansing homes for sale
- Scott Woods, Lansing homes for sale
Counties near Perry, 48872
- Barry County homes for sale
- Calhoun County homes for sale
- Clinton County homes for sale
- Eaton County homes for sale
- Genesee County homes for sale
- Gratiot County homes for sale
- Ingham County homes for sale
- Ionia County homes for sale
- Jackson County homes for sale
- Lapeer County homes for sale
- Lenawee County homes for sale
- Livingston County homes for sale
- Midland County homes for sale
- Montcalm County homes for sale
- Oakland County homes for sale
- Saginaw County homes for sale
- Shiawassee County homes for sale
- Tuscola County homes for sale
- Washtenaw County homes for sale
- Wayne County homes for sale
Protect your home and budget from life's surprises with an Assurant Home Warranty, backed by a partner that supports you through every step of homeownership. Explore Plans.
©2026 Century 21 Real Estate LLC. All rights reserved. CENTURY 21®, the CENTURY 21 Logo and C21® are service marks owned by Century 21 Real Estate LLC. Century 21 Real Estate LLC fully supports the principles of the Fair Housing Act and the Equal Opportunity Act. Each office is independently owned and operated. Listing information is deemed reliable but not guaranteed accurate.