- Allston homes for sale
- Boston homes for sale
- Brighton homes for sale
- Brookline homes for sale
- Cambridge homes for sale
- Charlestown homes for sale
- Chestnut Hill homes for sale
- Dorchester homes for sale
- Dorchester Center homes for sale
- East Boston homes for sale
- Hyde Park homes for sale
- Jamaica Plain homes for sale
- Mattapan homes for sale
- Newton Center homes for sale
- Roslindale homes for sale
- Roxbury homes for sale
- Roxbury Crossing homes for sale
- Somerville homes for sale
- South Boston homes for sale
- West Roxbury homes for sale
02119, MA - homes for sale
4 of 4 results displayed
 $2,699,900Active0.27 Acres
26-28-30 Notre Dame, Boston, MA 02119
MLS# 73499821Listed by: Steve Bremis Realty Group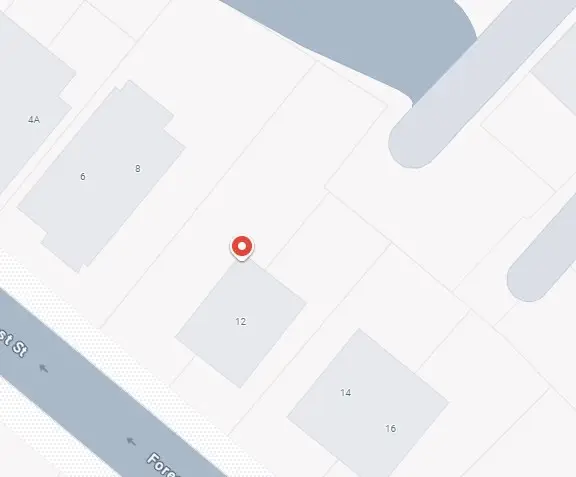 $999,000Active0.09 Acres
10 Forest St, Boston, MA 02119
MLS# 73474448Listed by: NextGen Realty, Inc.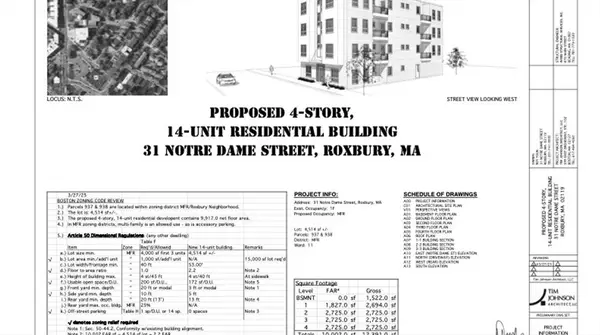 $949,000Active0.1 Acres
29-31 Notre Dame, Boston, MA 02119
MLS# 73471844Listed by: Pondside Realty $1,695,000Active0.28 Acres
1881 Columbus Avenue, Boston, MA 02119
MLS# 73171150Listed by: Insight Realty Group, Inc.
Local realty services provided by:CENTURY 21 Elite Realty, Inc.
Popular searches near 02119
Popular neighborhoods near 02119
- Back Streets, Boston homes for sale
- Blackstone, Boston homes for sale
- Boston University Medical Area, Boston homes for sale
- Brookline Village, Brookline homes for sale
- Chester Square, Boston homes for sale
- Claremont, Boston homes for sale
- Dudley Square, Roxbury homes for sale
- Egleston Square, Jamaica Plain homes for sale
- Hyde Square, Jamaica Plain homes for sale
- Jamaica Plain, Jamaica Plain homes for sale
- Meeting House Hill, Dorchester homes for sale
- Mission Hill, Roxbury Crossing homes for sale
- Mount Bowdoin, Dorchester homes for sale
- Parker Hill, Roxbury Crossing homes for sale
- Roxbury, Dorchester homes for sale
- Rutland Street, Boston homes for sale
- South End, Boston homes for sale
- Upham's Corner, Dorchester homes for sale
- West Concord Street, Boston homes for sale
- Worcester Square, Boston homes for sale
Counties near Roxbury, 02119
- Barnstable County homes for sale
- Bristol County homes for sale
- Bristol County homes for sale
- Dukes County homes for sale
- Essex County homes for sale
- Hillsborough County homes for sale
- Kent County homes for sale
- Middlesex County homes for sale
- Newport County homes for sale
- Norfolk County homes for sale
- Northeastern Connecticut County homes for sale
- Plymouth County homes for sale
- Providence County homes for sale
- Rockingham County homes for sale
- Strafford County homes for sale
- Suffolk County homes for sale
- Tolland County homes for sale
- Washington County homes for sale
- Windham County homes for sale
- Worcester County homes for sale
Protect your home and budget from life's surprises with an Assurant Home Warranty, backed by a partner that supports you through every step of homeownership. Explore Plans.
©2026 Century 21 Real Estate LLC. All rights reserved. CENTURY 21®, the CENTURY 21 Logo and C21® are service marks owned by Century 21 Real Estate LLC. Century 21 Real Estate LLC fully supports the principles of the Fair Housing Act and the Equal Opportunity Act. Each office is independently owned and operated. Listing information is deemed reliable but not guaranteed accurate.