- Algonquin, Cambridge homes for sale
- Cambridge, Cambridge homes for sale
- Chesapeake Ranch Estates, Lusby homes for sale
- Denton, Denton homes for sale
- Drum Point, Lusby homes for sale
- East New Market, East New Market homes for sale
- Easton, Easton homes for sale
- Federalsburg, Federalsburg homes for sale
- Fishing Creek, Fishing Creek homes for sale
- Greensboro, Greensboro homes for sale
- Hurlock, Hurlock homes for sale
- Lusby, Lusby homes for sale
- Oxford, Oxford homes for sale
- Preston, Preston homes for sale
- Ridgely, Ridgely homes for sale
- Riverview, Felton homes for sale
- St. Michaels, Saint Michaels homes for sale
- Secretary, Secretary homes for sale
- Taylors Island, Taylors Island homes for sale
- Trappe, Trappe homes for sale
Salisbury, MD - homes for sale
5 of 5 results displayed
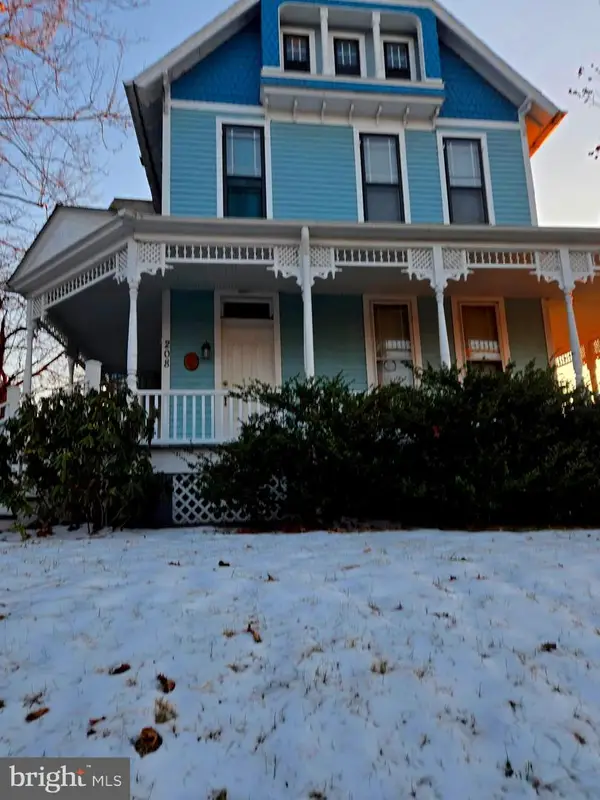 $312,000Active9 beds -- baths2,636 sq. ft.
208 W Isabella St, SALISBURY, MD 21801
MLS# MDWC2021494Listed by: LONG & FOSTER REAL ESTATE, INC. $300,000Active3 beds -- baths1,832 sq. ft.
810 N Division St, SALISBURY, MD 21801
MLS# MDWC2021322Listed by: EXP REALTY, LLC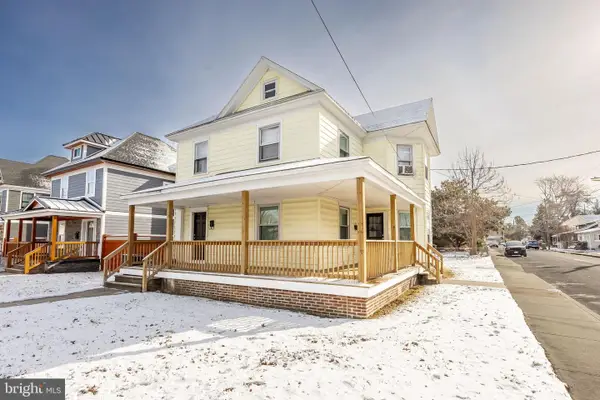 $239,900Active4 beds -- baths1,968 sq. ft.
812 E Church St, SALISBURY, MD 21804
MLS# MDWC2020548Listed by: KELLER WILLIAMS REALTY DELMARVA $225,000Active3 beds -- baths1,760 sq. ft.
117 Washington St, SALISBURY, MD 21804
MLS# MDWC2020552Listed by: KELLER WILLIAMS REALTY DELMARVA $330,000Active4 beds -- baths1,736 sq. ft.
231 Newton St, SALISBURY, MD 21801
MLS# MDWC2020098Listed by: EXP REALTY, LLC
Local realty services provided by:CENTURY 21 Advantage Gold
Neighborhoods near Salisbury, MD
Zip codes near Salisbury, MD
- 19940 homes for sale
- 19956 homes for sale
- 19973 homes for sale
- 21659 homes for sale
- 21801 homes for sale
- 21804 homes for sale
- 21814 homes for sale
- 21822 homes for sale
- 21826 homes for sale
- 21830 homes for sale
- 21837 homes for sale
- 21849 homes for sale
- 21850 homes for sale
- 21853 homes for sale
- 21856 homes for sale
- 21861 homes for sale
- 21863 homes for sale
- 21869 homes for sale
- 21874 homes for sale
- 21875 homes for sale
Popular searches near Salisbury, MD
- 11, Delmar homes for sale
- 13, Camden homes for sale
- 15, Hebron homes for sale
- 16, Fruitland homes for sale
- 2, Quantico homes for sale
- 4, Pittsburg homes for sale
- 4, Western homes for sale
- 5, Parsons homes for sale
- 7, Trappe homes for sale
- 8, Nutters homes for sale
- 9, Salisbury homes for sale
- Delmar homes for sale
- Delmar homes for sale
- Eden homes for sale
- Fruitland homes for sale
- Hebron homes for sale
- Mardela Springs homes for sale
- Parsonsburg homes for sale
- Pittsville homes for sale
- Quantico homes for sale
Protect your home and budget from life's surprises with an Assurant Home Warranty, backed by a partner that supports you through every step of homeownership. Explore Plans.
©2026 Century 21 Real Estate LLC. All rights reserved. CENTURY 21®, the CENTURY 21 Logo and C21® are service marks owned by Century 21 Real Estate LLC. Century 21 Real Estate LLC fully supports the principles of the Fair Housing Act and the Equal Opportunity Act. Each office is independently owned and operated. Listing information is deemed reliable but not guaranteed accurate.