- Cibolo homes for sale
- Geronimo homes for sale
- Kingsbury homes for sale
- La Vernia homes for sale
- Lake Dunlap homes for sale
- Leesville homes for sale
- Luling homes for sale
- Marion homes for sale
- Martindale homes for sale
- McQueeney homes for sale
- New Berlin homes for sale
- New Braunfels homes for sale
- Northeast Guadalupe homes for sale
- Redwood homes for sale
- Santa Clara homes for sale
- Schertz-Cibolo homes for sale
- Seguin homes for sale
- Southeast Guadalupe homes for sale
- Southwest Guadalupe homes for sale
- Zuehl homes for sale
78155, TX - homes for sale
300 of 1,051 results displayed
- New
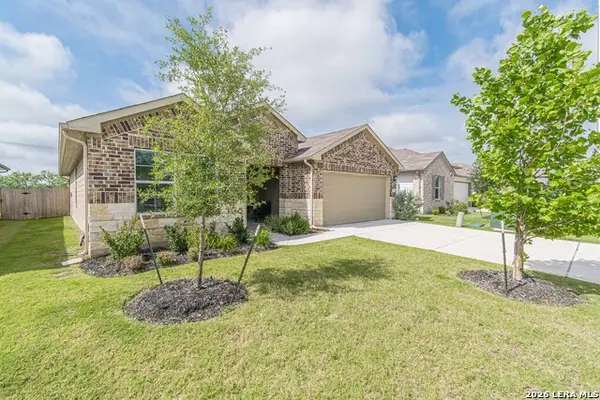
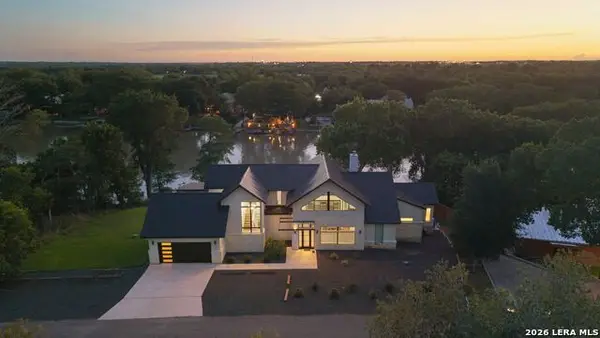
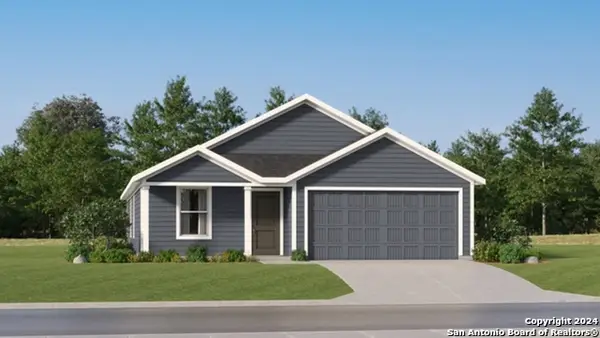
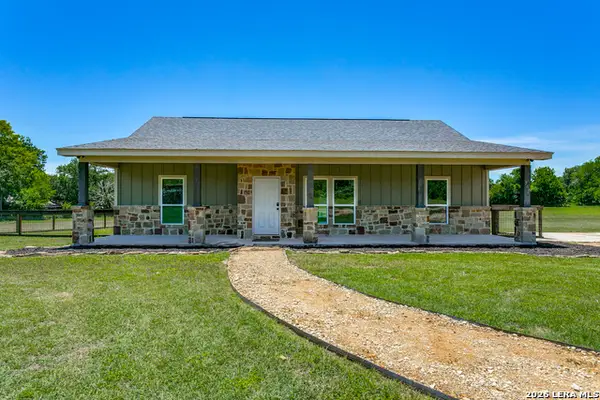
 $590,000Active4 beds 4 baths2,494 sq. ft.
1535 Prairie Pass, Seguin, TX 78155
MLS# 1973615Listed by: BK REAL ESTATE - New
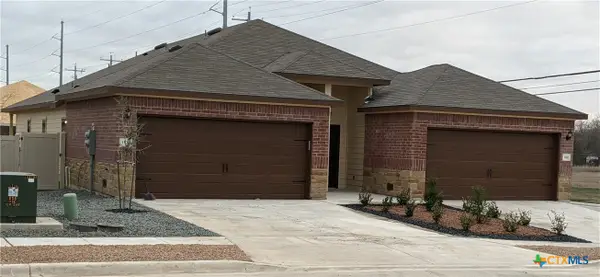
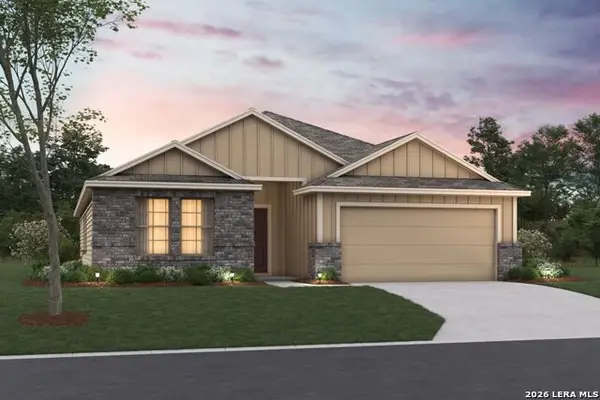
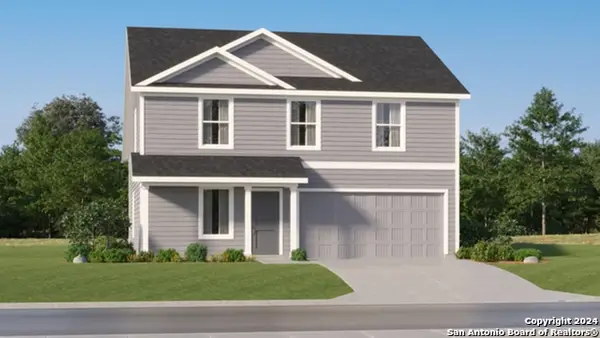
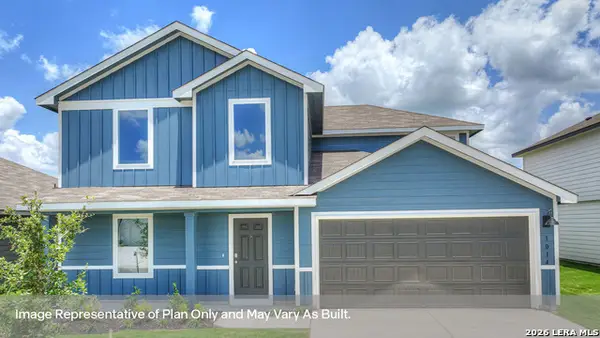
 $345,500Active4 beds 3 baths2,304 sq. ft.
2708 Coral Vly, Seguin, TX 78155
MLS# 1973491Listed by: 1ST CHOICE REALTY GROUP - New
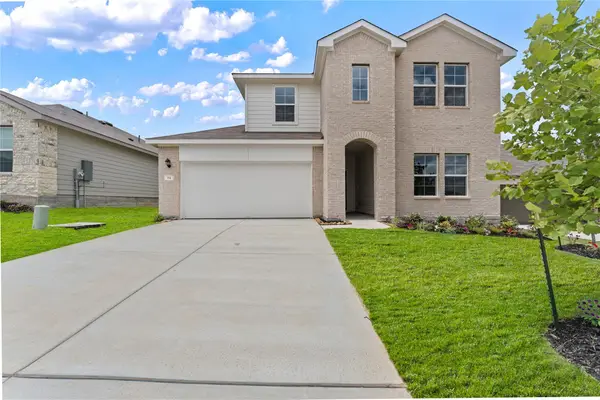
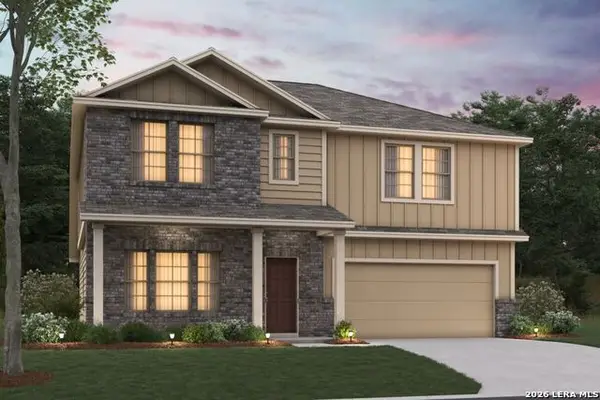
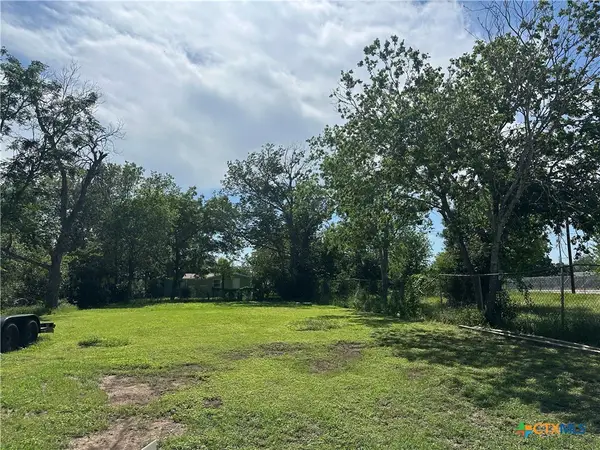
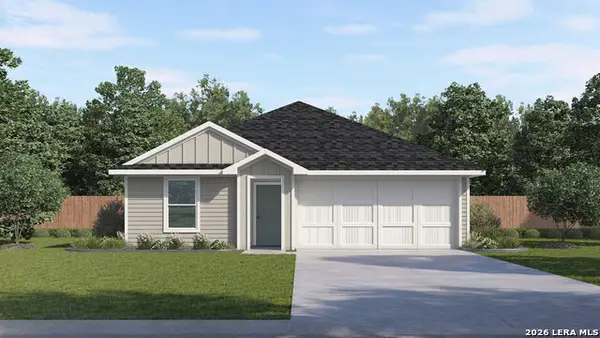
 $378,000Active3 beds 2 baths1,931 sq. ft.
3739 Canby Oak, Seguin, TX 78155
MLS# 1973451Listed by: UNITED REALTY GROUP OF TEXAS, LLC - New
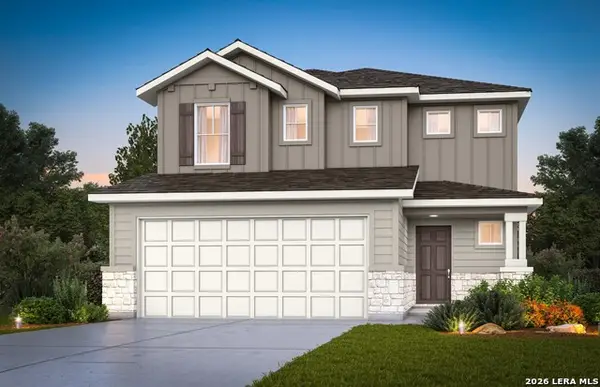
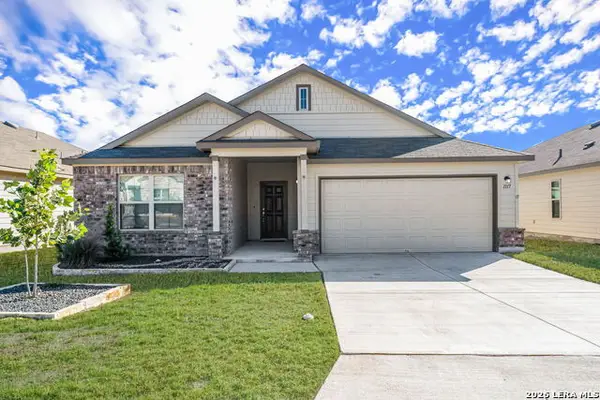
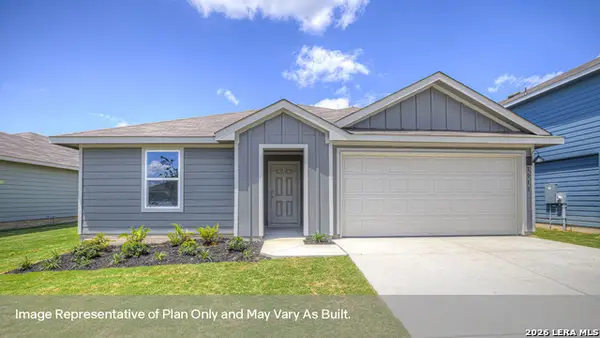
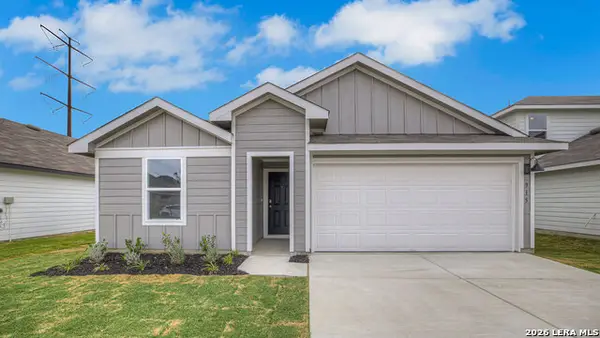
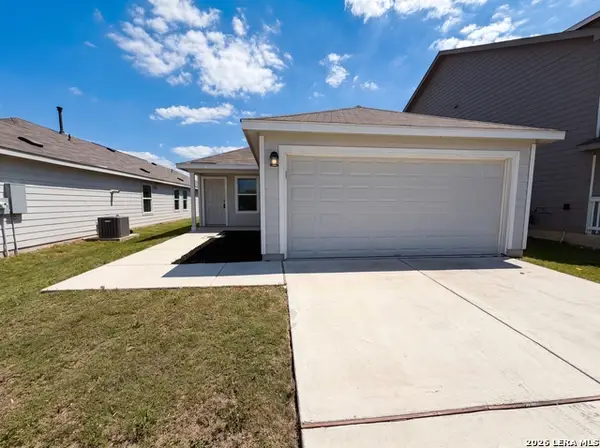
 $299,000Active3 beds 3 baths2,248 sq. ft.
16567 Fm 725, Seguin, TX 78155
MLS# 616055Listed by: BLOOM REALTY, LLC - New
 $339,000Active2.28 Acres
2490 Schwab, Seguin, TX 78155
MLS# 1973332Listed by: BHHS PENFED REALTY - New
 $160,000Active0.64 Acres
216 S Cherry St, Seguin, TX 78155
MLS# 1973299Listed by: ALL CITY SAN ANTONIO REGISTERED SERIES - New
 $219,990Active4 beds 2 baths1,574 sq. ft.
1544 Gateshead Drive, Seguin, TX 78155
MLS# 615367Listed by: KELLER WILLIAMS HERITAGE - New
 $255,000Active3 beds 2 baths1,406 sq. ft.
809 Nodding Nixie, Seguin, TX 78155
MLS# 615616Listed by: RE/MAX GO - NB - New
 $549,000Active-- beds -- baths2,856 sq. ft.
1002 River Oak Dr, Seguin, TX 78155
MLS# 1973168Listed by: BECKER PROPERTIES, LLC - New
 $189,900Active3 beds 2 baths1,440 sq. ft.
5933 Antonio Pl, Seguin, TX 78155
MLS# 1973077Listed by: NEWFOUND REAL ESTATE - New
 $219,500Active3 beds 2 baths1,403 sq. ft.
775 Short Avenue, Seguin, TX 78155
MLS# 615709Listed by: SEGUIN REALTY - New
 $375,000Active4 beds 3 baths2,372 sq. ft.
8935 Rancher Place, Seguin, TX 78155
MLS# 615973Listed by: BLOOM REALTY, LLC - New
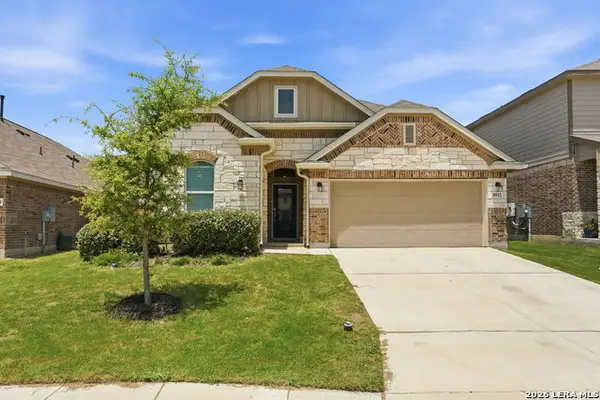 $375,000Active4 beds 3 baths2,372 sq. ft.
8912 Luciano Ridge, Seguin, TX 78155
MLS# 1973055Listed by: EVOKE REALTY - New
 $889,000Active3 beds 3 baths3,061 sq. ft.
412 Farmstead Dr, Seguin, TX 78155
MLS# 8765742Listed by: CLARK REAL ESTATE AGENCY - New
 $180,000Active3 beds 2 baths1,440 sq. ft.
5875 Coahulia Rdg, Seguin, TX 78155
MLS# 1972971Listed by: WEALTH PARTNERS REALTY GROUP, LLC - New
 $974,900Active5 beds 3 baths3,760 sq. ft.
939 Reiley Rd, Seguin, TX 78155
MLS# 2009684Listed by: KELLER WILLIAMS HERITAGE - New
 $299,000Active3 beds 2 baths1,568 sq. ft.
844 Peccary Place, Seguin, TX 78155
MLS# 615859Listed by: KELLER WILLIAMS HERITAGE - New
 $355,000Active4 beds 2 baths1,992 sq. ft.
2984 Grove Ter, Seguin, TX 78155
MLS# 9310655Listed by: OUTLAW REALTY - New
 $1,600,000Active4 beds 4 baths2,819 sq. ft.
5335 Fm 775, Seguin, TX 78155
MLS# 1972841Listed by: HOMESTEAD & RANCH REAL ESTATE - New
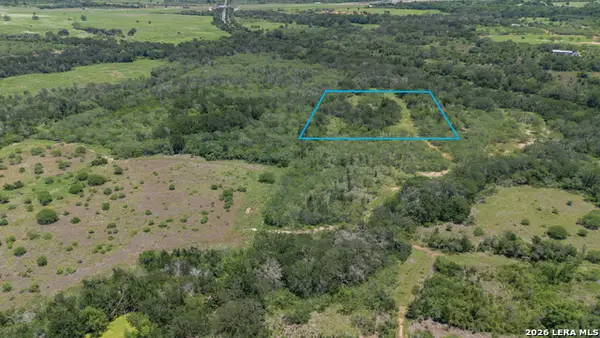
 $299,999Active15 Acres
0 Fm 3353, Kingsbury, TX 78155
MLS# 1972774Listed by: SOUTH TEXAS REALTY, LLC - New
 $295,990Active3 beds 2 baths1,568 sq. ft.
844 Peccary, Seguin, TX 78155
MLS# 1972805Listed by: KELLER WILLIAMS HERITAGE - New
 $384,000Active-- beds -- baths2,738 sq. ft.
1101&1103 Stanley Way, Seguin, TX 78155
MLS# 615445Listed by: PROPERTY PROFESSIONALS, INC - New
 $335,000Active4 beds 3 baths2,294 sq. ft.
314 Boatman Cv, Seguin, TX 78155
MLS# 2581509Listed by: MARTI REALTY GROUP - New
 $276,535Active4 beds 3 baths2,331 sq. ft.
4126 Bermuda Lane, Seguin, TX 78155
MLS# 1972571Listed by: MOVE UP AMERICA - New
 $253,932Active3 beds 3 baths1,837 sq. ft.
4068 Bermuda Lane, Seguin, TX 78155
MLS# 1972573Listed by: MOVE UP AMERICA - New
 $74,000Active0.35 Acres
111 Arroyo, Seguin, TX 78155
MLS# 1972537Listed by: SOUTHERN CAPITAL REALTY - New
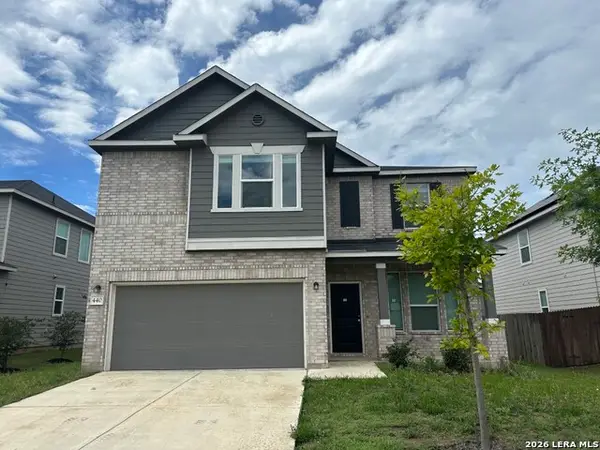 $274,900Active4 beds 3 baths2,892 sq. ft.
440 Sunrise Park, Seguin, TX 78155
MLS# 1972493Listed by: DAVALOS & ASSOCIATES - New
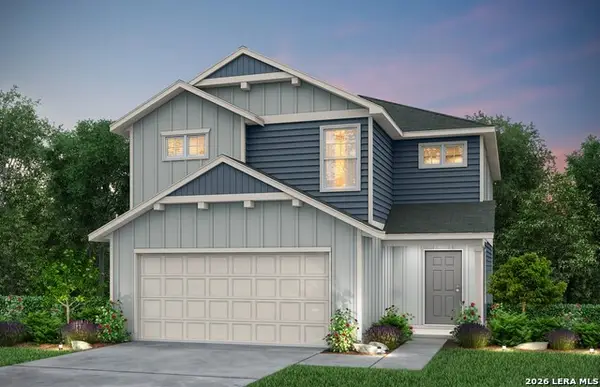
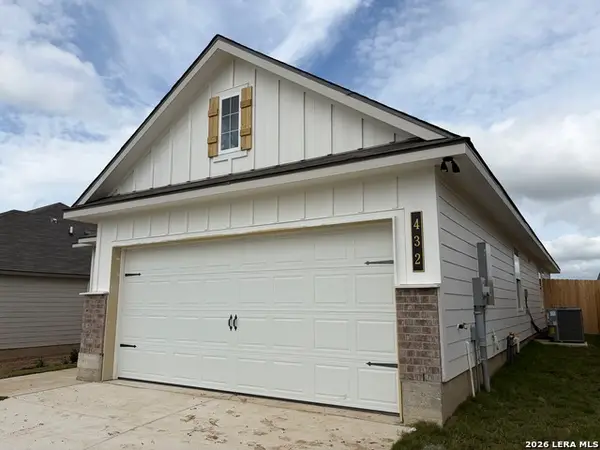 $290,900Active3 beds 2 baths1,613 sq. ft.
432 Honeydew Way, Seguin, TX 78155
MLS# 1972244Listed by: STYLECRAFT BROKERAGE, LLC - New
 $2,400,000Active5 beds 6 baths4,301 sq. ft.
230 Turtle Ln, Seguin, TX 78155
MLS# 1972207Listed by: KUPER SOTHEBY'S INT'L REALTY - New
 $279,500Active3 beds 2 baths1,401 sq. ft.
225 Greenway Dr, Seguin, TX 78155
MLS# 1972181Listed by: BHHS DON JOHNSON REALTORS - NB - New
 $455,000Active4 beds 3 baths2,469 sq. ft.
2976 Creek Ridge Street, Seguin, TX 78155
MLS# 615417Listed by: D LEE EDWARDS REALTY, INC - New
 $799,000Active4 beds 4 baths1,685 sq. ft.
48 River Oak Dr, Seguin, TX 78155
MLS# 1972013Listed by: KELLER WILLIAMS HERITAGE - New
 $318,710Active3 beds 2 baths1,975 sq. ft.
1024 Eagle Crossing, Seguin, TX 78155
MLS# 1971922Listed by: ESCAPE REALTY - New
 $327,560Active4 beds 2 baths1,687 sq. ft.
1028 Eagle Crossing, Seguin, TX 78155
MLS# 1971956Listed by: ESCAPE REALTY - New
 $359,295Active5 beds 3 baths2,799 sq. ft.
1040 Eagle Crossing, Seguin, TX 78155
MLS# 1971884Listed by: ESCAPE REALTY - New
 $299,000Active4 beds 3 baths2,147 sq. ft.
1117 Amber Lk, Seguin, TX 78155
MLS# 1971868Listed by: KELLER WILLIAMS HERITAGE - New
 $169,000Active3.06 Acres
TBD Merriweather, Seguin, TX 78155
MLS# 1971820Listed by: OPTION ONE REAL ESTATE - New
 $149,900Active3 beds 2 baths1,428 sq. ft.
219 Lopez, Seguin, TX 78155
MLS# 1971696Listed by: ALL CITY SAN ANTONIO REGISTERED SERIES - New
 $1,100,000Active-- beds -- baths
2990 Fm 467, Seguin, TX 78155
MLS# 1971707Listed by: KUSTOM REAL ESTATE - New
 $229,900Active3 beds 2 baths1,542 sq. ft.
415 N Erskine, Seguin, TX 78155
MLS# 1971708Listed by: ALL CITY SAN ANTONIO REGISTERED SERIES - New
 $348,935Active4 beds 3 baths2,188 sq. ft.
1032 Eagle Crossing, Seguin, TX 78155
MLS# 1971626Listed by: ESCAPE REALTY - New
 $415,000Active4 beds 3 baths2,479 sq. ft.
2964 Coral Way, Seguin, TX 78155
MLS# 615216Listed by: BHHS DON JOHNSON REALTORS - NB - New
 $239,790Active3 beds 2 baths1,417 sq. ft.
4125 Woodside Dr, Seguin, TX 78155
MLS# 1971500Listed by: SATEX PROPERTIES, INC. - New
 $1,899,000Active4 beds 4 baths4,754 sq. ft.
1293 Pioneer Rd, Seguin, TX 78155
MLS# 8205434Listed by: ZACHARY BIERMANN, BROKER - New
 $455,000Active-- beds -- baths
9057 Sycamore Shade Ln, Kingsbury, TX 78155
MLS# 9517463Listed by: ZACHARY BIERMANN, BROKER - New
 $59,900Active0.36 Acres
Lot 7 W Seideman St, Seguin, TX 78155
MLS# 1359603Listed by: WHITE LINE REALTY LLC - New
 $200,000Active2 beds 2 baths1,036 sq. ft.
604 Saxon Street, Seguin, TX 78155
MLS# 615262Listed by: RELIANCE RESIDENTIAL REALTY - - New
 $725,000Active3 beds 3 baths2,250 sq. ft.
381 Schneider Road, Seguin, TX 78155
MLS# 615341Listed by: CORNER POST REAL ESTATE, LLC - New
 $249,900Active3 beds 2 baths1,658 sq. ft.
227 E College St, Seguin, TX 78155
MLS# 1971283Listed by: KELLER WILLIAMS HERITAGE - New
 $875,000Active3 beds 2 baths1,200 sq. ft.
279 Fermin Ln, Seguin, TX 78155
MLS# 1971278Listed by: WEST AND SWOPE RANCHES - New
 $140,000Active0.51 Acres
537 Longhorn Trail, Seguin, TX 78155
MLS# 615269Listed by: CORNER POST REAL ESTATE, LLC - New
 $222,999Active4 beds 2 baths1,667 sq. ft.
3601 Canyon Ridge, Seguin, TX 78155
MLS# 1971227Listed by: MARTI REALTY GROUP - New
 $216,999Active4 beds 3 baths1,891 sq. ft.
3556 Sky Place, Seguin, TX 78155
MLS# 1971230Listed by: MARTI REALTY GROUP - New
 $37,000Active0.15 Acres
652 Flores Street, Seguin, TX 78155
MLS# 615248Listed by: VANTAGE REAL ESTATE GROUP, LLC - New
 $291,990Active4 beds 2 baths1,647 sq. ft.
1017 Prince Albert, Seguin, TX 78155
MLS# 1971061Listed by: D.R. HORTON, AMERICA'S BUILDER - New
 $524,900Active3 beds 2 baths1,566 sq. ft.
768 Burges St, Seguin, TX 78155
MLS# 1971062Listed by: TEXAS EDGE REALTY - New
 $305,990Active5 beds 3 baths1,874 sq. ft.
1013 Prince Albert, Seguin, TX 78155
MLS# 1971069Listed by: D.R. HORTON, AMERICA'S BUILDER - New
 $331,990Active5 beds 3 baths2,236 sq. ft.
1107 Prince Albert, Seguin, TX 78155
MLS# 1971081Listed by: D.R. HORTON, AMERICA'S BUILDER - New
 $264,990Active3 beds 2 baths1,325 sq. ft.
1006 Bold Run, Seguin, TX 78155
MLS# 1971040Listed by: D.R. HORTON, AMERICA'S BUILDER - New
 $283,990Active4 beds 2 baths1,476 sq. ft.
1019 Gladys Run, Seguin, TX 78155
MLS# 1971052Listed by: D.R. HORTON, AMERICA'S BUILDER - New
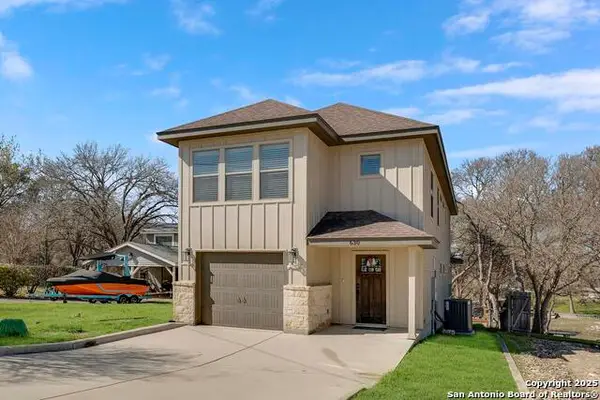 $1,225,000Active3 beds 3 baths2,428 sq. ft.
630 Three Oaks Rd, Seguin, TX 78155
MLS# 1970827Listed by: COMPASS RE TEXAS, LLC - New
 $315,000Active3 beds 2 baths2,236 sq. ft.
1011 Bold Run, Seguin, TX 78155
MLS# 1971004Listed by: MARTI REALTY GROUP - New
 $275,000Active4 beds 2 baths1,647 sq. ft.
1005 Prince Albert, Seguin, TX 78155
MLS# 1970992Listed by: MARTI REALTY GROUP - New
 $320,000Active3 beds 2 baths2,236 sq. ft.
919 Prince Albert, Seguin, TX 78155
MLS# 1970998Listed by: MARTI REALTY GROUP - New
 $262,500Active3 beds 2 baths1,613 sq. ft.
1160 Water Valley, Seguin, TX 78155
MLS# 1970972Listed by: TEXAS HOME REALTY - New
 $1,195,000Active6 beds 5 baths3,140 sq. ft.
295 Mcknight Road, Seguin, TX 78155
MLS# 613322Listed by: GREGSON REALTY ADVISORS - New
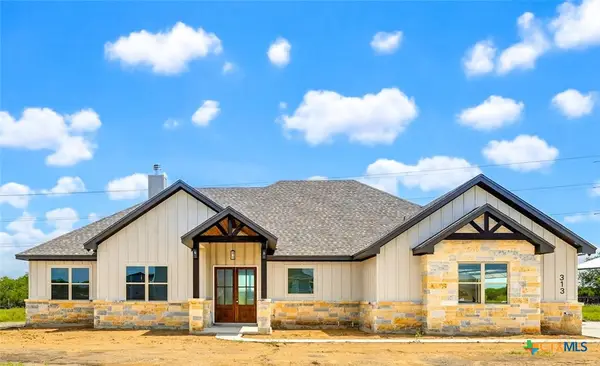 $685,000Active4 beds 3 baths2,434 sq. ft.
313 Farmhouse Drive, Marion, TX 78124
MLS# 615182Listed by: SOUTHERN CAPITAL REALTY - New
 $278,500Active3 beds 2 baths1,632 sq. ft.
1513 Preston Dr, Seguin, TX 78155
MLS# 1970797Listed by: SHARON PETERS - New
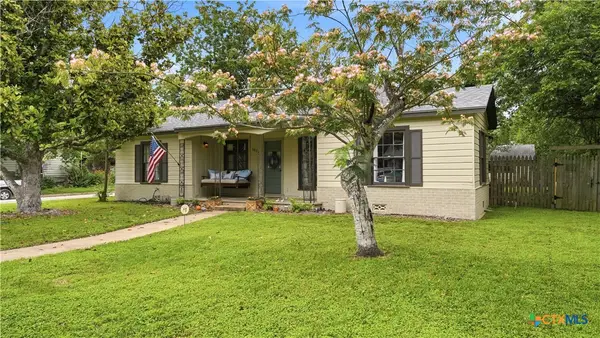 $310,000Active3 beds 2 baths1,688 sq. ft.
1031 E Walnut Street, Seguin, TX 78155
MLS# 615065Listed by: RELIANCE RESIDENTIAL REALTY - - New
 $69,900Active0.13 Acres
1732 Nordberg, Seguin, TX 78155
MLS# 4564086Listed by: CELINA ROSS REALTY, LLC - New
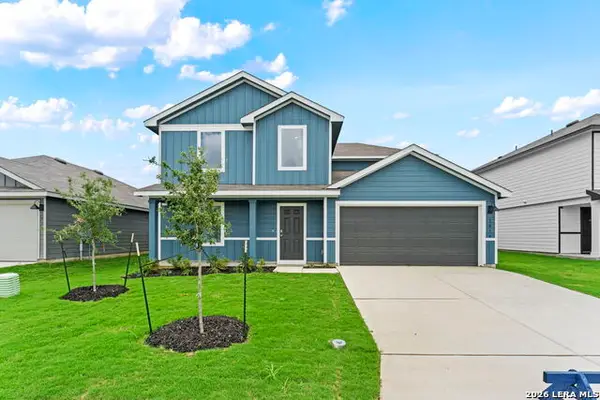 $320,000Active3 beds 2 baths2,236 sq. ft.
1014 Bold Run, Seguin, TX 78155
MLS# 1970664Listed by: MARTI REALTY GROUP - New
 $549,000Active4 beds 4 baths2,118 sq. ft.
324 Kimbrough Rd, Seguin, TX 78155
MLS# 1970633Listed by: MACHADO INTERNATIONAL REALTY - New
 $189,900Active1 beds 1 baths432 sq. ft.
148 Dewey Lane, Seguin, TX 78155
MLS# 615087Listed by: DAWSON & ASSOCIATES - New
 $275,000Active3 beds 2 baths1,409 sq. ft.
832 Cinnamon Teal, Seguin, TX 78155
MLS# 1970450Listed by: EXP REALTY  $169,900Active3 beds 2 baths1,252 sq. ft.
211 W College Street, Seguin, TX 78155
MLS# 615037Listed by: JLA REALTY - NB $250,000Active4 beds 2 baths1,574 sq. ft.
1437 Birmingham, Seguin, TX 78155
MLS# 1970336Listed by: KAREN MCMILLAN PROPERTIES $227,500Active3 beds 2 baths1,136 sq. ft.
123 Navarro Xing #12-A, Seguin, TX 78155
MLS# 9445691Listed by: CELINA ROSS REALTY, LLC
 $421,075Active4 beds 3 baths2,344 sq. ft.
5032 S Santa Clara Road, Seguin, TX 78155
MLS# 614996Listed by: CENTURY 21 INTEGRA $275,000Active4 beds 2 baths1,647 sq. ft.
1018 Bold Run, Seguin, TX 78155
MLS# 21283099Listed by: 1ST BROKERAGE $265,000Active4 beds 2 baths1,476 sq. ft.
915 Prince Albert, Seguin, TX 78155
MLS# 21282990Listed by: 1ST BROKERAGE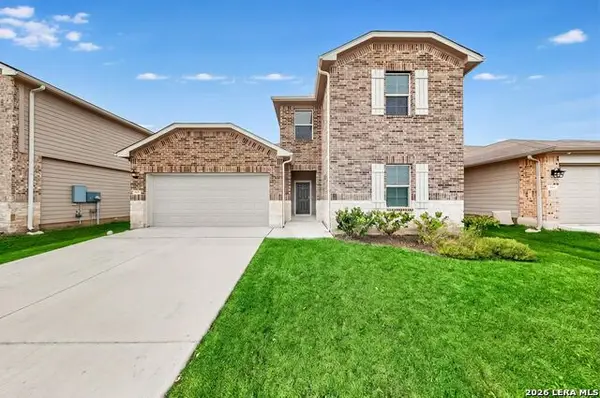 $289,900Active4 beds 3 baths2,175 sq. ft.
820 Cinnamon Teal, Seguin, TX 78155
MLS# 1970209Listed by: TEXAS HOME REALTY $260,000Active3 beds 2 baths1,415 sq. ft.
204 Yucca, Seguin, TX 78155
MLS# 1969080Listed by: REDFIN CORPORATION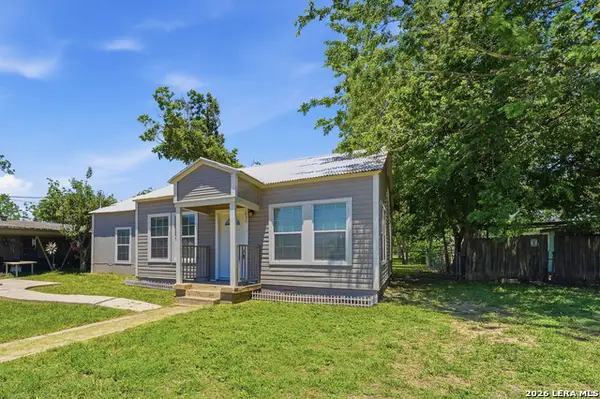 $169,000Active2 beds 1 baths1,076 sq. ft.
630 E Pine St, Seguin, TX 78155
MLS# 1970187Listed by: REAL BROKER, LLC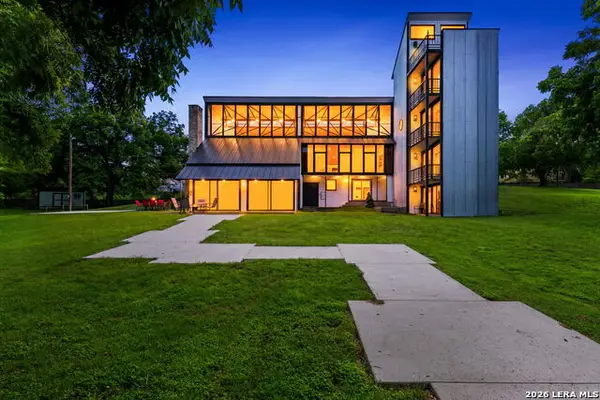 $1,695,000Active5 beds 5 baths6,953 sq. ft.
102 Lenz Dr, Seguin, TX 78155
MLS# 1970139Listed by: PHYLLIS BROWNING COMPANY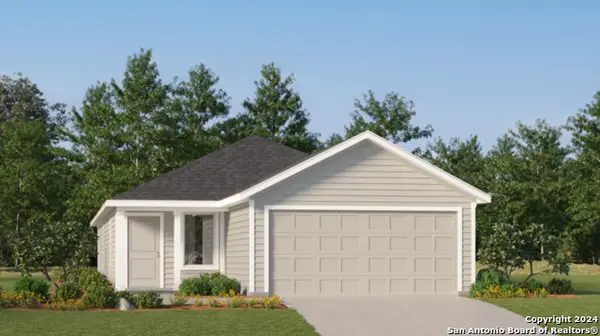 $212,999Active4 beds 2 baths1,600 sq. ft.
5511 Gatewood Trl, Seguin, TX 78155
MLS# 1970086Listed by: MARTI REALTY GROUP $231,999Active4 beds 2 baths1,575 sq. ft.
5515 Gatewood Trl, Seguin, TX 78155
MLS# 1970087Listed by: MARTI REALTY GROUP $221,999Active3 beds 2 baths1,402 sq. ft.
5519 Gatewood Trl, Seguin, TX 78155
MLS# 1970088Listed by: MARTI REALTY GROUP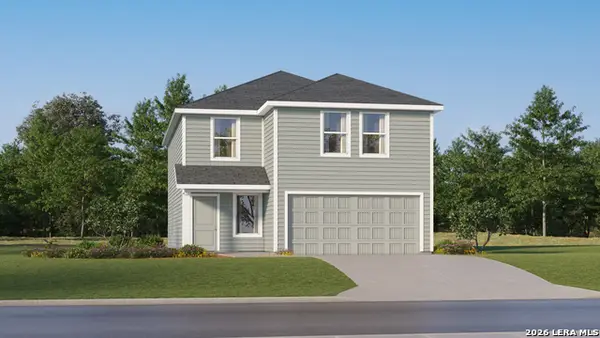 $236,999Active4 beds 3 baths2,173 sq. ft.
5523 Gatewood Trl, Seguin, TX 78155
MLS# 1970089Listed by: MARTI REALTY GROUP $191,999Active3 beds 2 baths1,266 sq. ft.
5527 Gatewood Trl, Seguin, TX 78155
MLS# 1970090Listed by: MARTI REALTY GROUP $232,999Active4 beds 2 baths1,600 sq. ft.
5531 Gatewood Trl, Seguin, TX 78155
MLS# 1970092Listed by: MARTI REALTY GROUP $237,999Active4 beds 2 baths1,600 sq. ft.
5546 Alope Way, Seguin, TX 78155
MLS# 1970093Listed by: MARTI REALTY GROUP $303,999Active4 beds 3 baths2,302 sq. ft.
8963 Turkey Creek, Seguin, TX 78155
MLS# 1970094Listed by: MARTI REALTY GROUP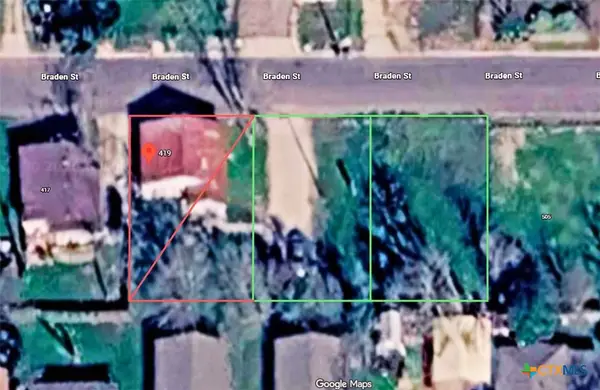 $33,000Active0.28 Acres
419 Braden Street, Seguin, TX 78155
MLS# 610750Listed by: WHITE LINE REALTY LLC $225,000Active3 beds 2 baths1,456 sq. ft.
1361 Mills Way, Seguin, TX 78155
MLS# 614703Listed by: PATRICK EDWARD MCFARLAND $155,000Active5.08 Acres
225 Sandy Oaks, Seguin, TX 78155
MLS# 1969661Listed by: LEVI RODGERS REAL ESTATE GROUP $560,000Active3 beds 2 baths1,736 sq. ft.
337 Dewey Ln, Seguin, TX 78155
MLS# 1969624Listed by: REGAL REALTY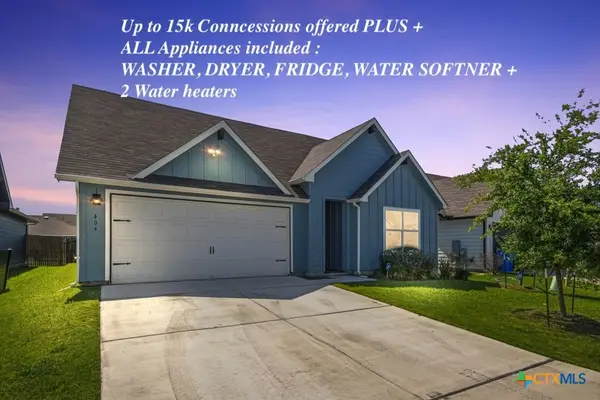 $275,000Active4 beds 3 baths2,034 sq. ft.
404 Signe, Seguin, TX 78155
MLS# 614758Listed by: JPAR - NEW BRAUNFELS $65,000Active0.24 Acres
764 Johnson, Seguin, TX 78155
MLS# 1969590Listed by: SOUTH TEXAS REALTY, LLC $265,000Active4 beds 3 baths2,178 sq. ft.
2512 Ayers, Seguin, TX 78155
MLS# 1969586Listed by: IH 10 REALTY $198,999Active4 beds 2 baths1,667 sq. ft.
3552 Sky Place, Seguin, TX 78155
MLS# 1969509Listed by: MARTI REALTY GROUP $131,500Active2 beds 2 baths948 sq. ft.
1051 Country Club Drive, Seguin, TX 78155
MLS# 614648Listed by: ANDERS PIERCE REALTY, LLC $474,900Active4 beds 3 baths2,529 sq. ft.
2972 Sprouted Grain, Seguin, TX 78155
MLS# 1969382Listed by: PERRY HOMES REALTY, LLC $338,990Active4 beds 3 baths1,917 sq. ft.
425 Tims Way, Seguin, TX 78155
MLS# 21279292Listed by: EXP REALTY LLC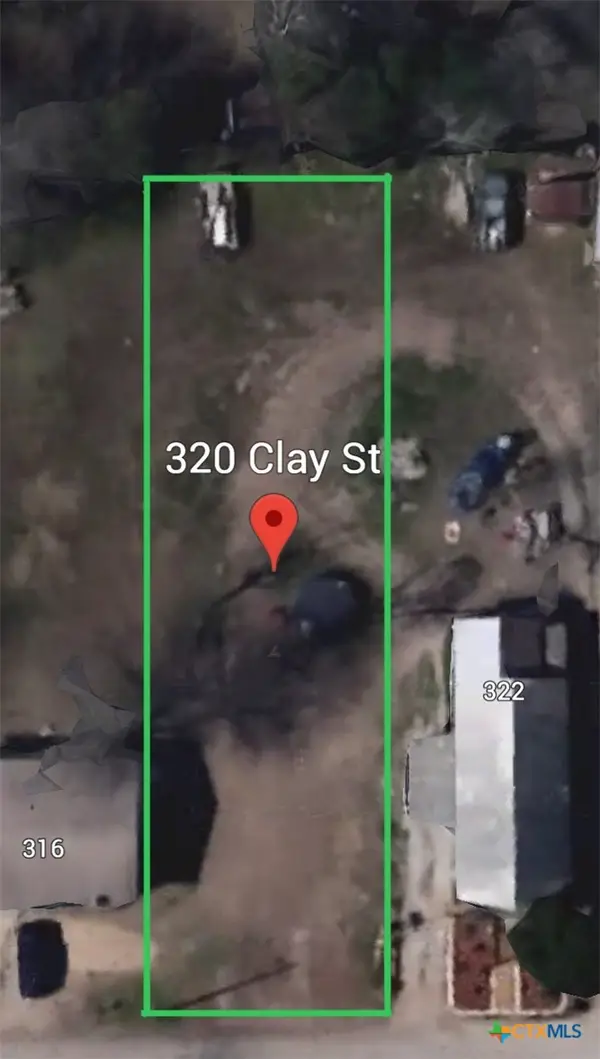 $36,900Active0.21 Acres
320 Clay Street, Seguin, TX 78155
MLS# 612419Listed by: WHITE LINE REALTY LLC $309,990Active4 beds 2 baths1,917 sq. ft.
1036 Eagle Crossing, Seguin, TX 78155
MLS# 1969274Listed by: ESCAPE REALTY $299,990Active3 beds 2 baths1,613 sq. ft.
2852 Cavern Grove, Seguin, TX 78155
MLS# 1969278Listed by: ESCAPE REALTY $315,000Active4 beds 3 baths2,601 sq. ft.
4037 Sun Meadow Lane, Seguin, TX 78155
MLS# 613166Listed by: KELLER WILLIAMS HERITAGE $350,000Active3 beds 2 baths1,536 sq. ft.
646 Old Colony Road, Seguin, TX 78155
MLS# 614100Listed by: KAREN MCMILLAN PROPERTIES $279,000Active4 beds 3 baths2,034 sq. ft.
1012 Betsy Dr Dr, Seguin, TX 78155
MLS# 5812169Listed by: REAL BROKER, LLC $178,000Active3 beds 1 baths1,000 sq. ft.
937 Anderson St, Seguin, TX 78155
MLS# 1969224Listed by: REAL BROKER, LLC $274,990Active3 beds 2 baths1,523 sq. ft.
1204 Sweden, Seguin, TX 78155
MLS# 1969197Listed by: LEGEND HOMES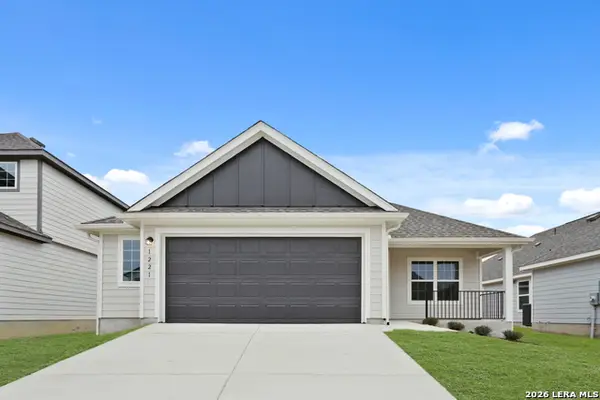 $284,990Active3 beds 2 baths1,697 sq. ft.
1221 Sweden, Seguin, TX 78155
MLS# 1969200Listed by: LEGEND HOMES $324,990Active4 beds 4 baths2,246 sq. ft.
1228 Sweden, Seguin, TX 78155
MLS# 1969202Listed by: LEGEND HOMES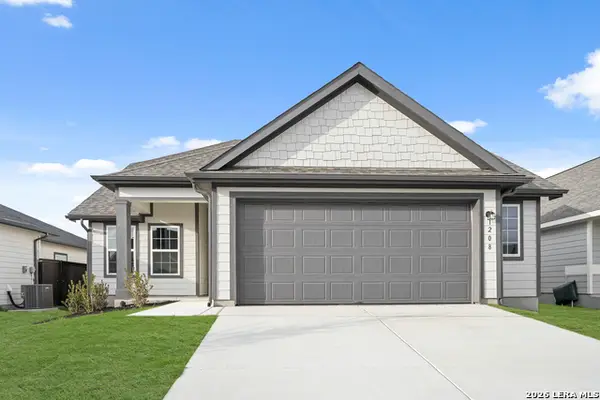 $329,990Active4 beds 3 baths2,356 sq. ft.
1208 Sweden, Seguin, TX 78155
MLS# 1969205Listed by: LEGEND HOMES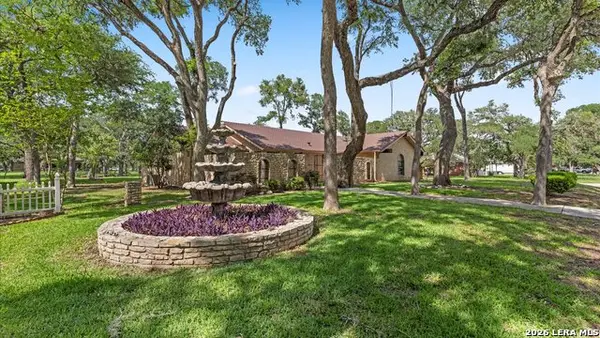 $284,990Active3 beds 3 baths2,341 sq. ft.
162 Lone Oak St, Seguin, TX 78155
MLS# 1969182Listed by: RUBY COVE REAL ESTATE, LLC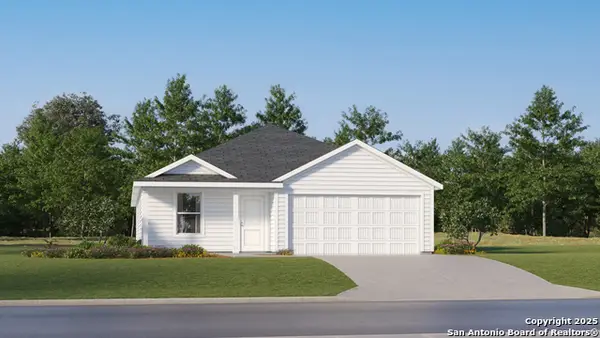 $213,999Active4 beds 2 baths1,850 sq. ft.
3553 Sky Place, Seguin, TX 78155
MLS# 1969133Listed by: MARTI REALTY GROUP $185,999Active3 beds 2 baths1,474 sq. ft.
3560 Sky Place, Seguin, TX 78155
MLS# 1969134Listed by: MARTI REALTY GROUP $285,000Active4 beds 3 baths2,097 sq. ft.
2532 Ayers Dr., Seguin, TX 78155
MLS# 1969124Listed by: HECHT REAL ESTATE GROUP- Open Fri, 10:30am to 1:30pm
 $449,999Active4 beds 3 baths2,658 sq. ft.
972 Nolte Bend, Seguin, TX 78155
MLS# 1969046Listed by: DILLINGHAM & TOONE REAL ESTATE  $345,190Active4 beds 3 baths2,042 sq. ft.
485 Cottonmouth Lane, Seguin, TX 78155
MLS# 614533Listed by: DR HORTON-AUSTIN $357,190Active4 beds 3 baths2,042 sq. ft.
704 Peccary Place, Seguin, TX 78155
MLS# 614538Listed by: DR HORTON-AUSTIN $361,990Active4 beds 3 baths2,292 sq. ft.
724 Peccary Place, Seguin, TX 78155
MLS# 614543Listed by: DR HORTON-AUSTIN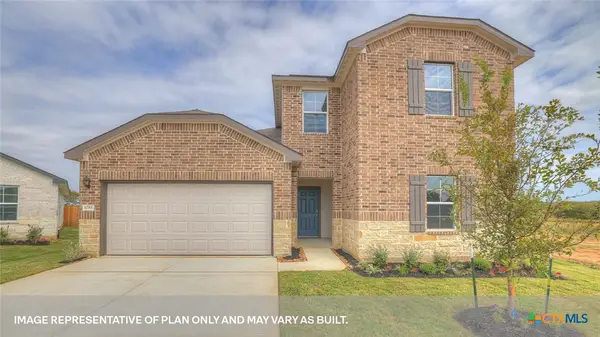 $347,990Active4 beds 3 baths2,170 sq. ft.
720 Peccary Place, Seguin, TX 78155
MLS# 614512Listed by: DR HORTON-AUSTIN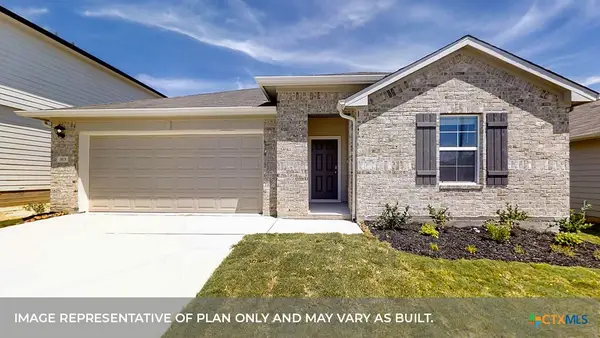 $344,990Active4 beds 3 baths2,042 sq. ft.
716 Peccary Place, Seguin, TX 78155
MLS# 614530Listed by: DR HORTON-AUSTIN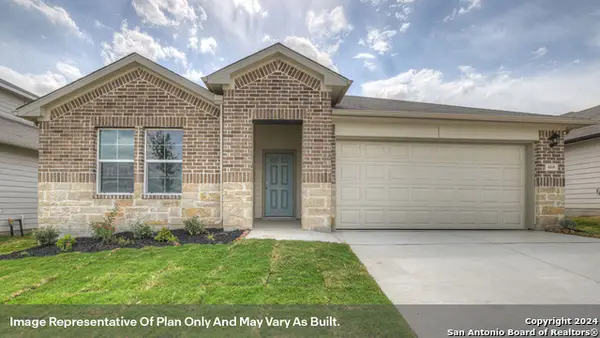 $327,990Active4 beds 2 baths1,796 sq. ft.
708 Peccary Place, Seguin, TX 78155
MLS# 1968907Listed by: D.R. HORTON, AMERICA'S BUILDER $312,990Active4 beds 2 baths1,796 sq. ft.
477 Cottonmouth Lane, Seguin, TX 78155
MLS# 1968917Listed by: D.R. HORTON, AMERICA'S BUILDER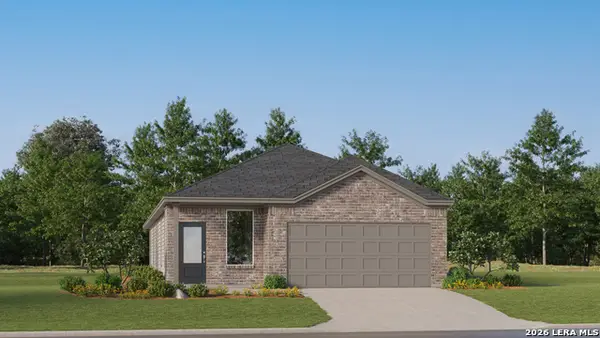 $268,999Active4 beds 3 baths1,802 sq. ft.
10128 Gold Point, Seguin, TX 78155
MLS# 1968689Listed by: MARTI REALTY GROUP $252,999Active4 beds 3 baths2,024 sq. ft.
8924 Gila Ridge, Seguin, TX 78155
MLS# 1968690Listed by: MARTI REALTY GROUP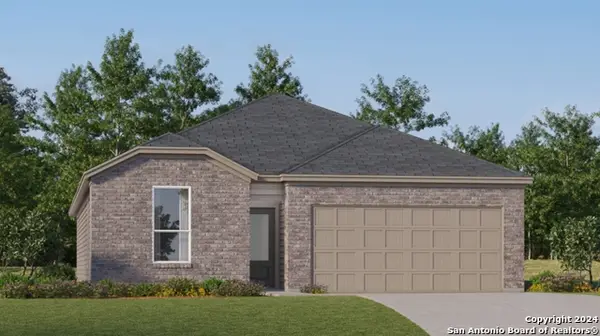 $205,499Active4 beds 3 baths1,667 sq. ft.
441 Wolf Crest Blvd, Guadalupe, TX 78155
MLS# 1968693Listed by: MARTI REALTY GROUP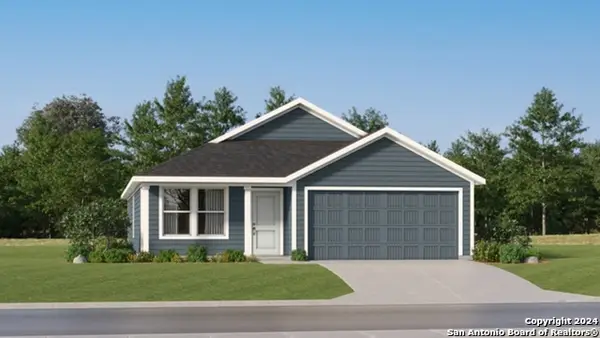 $191,999Active3 beds 2 baths1,474 sq. ft.
472 Wolf Crest Blvd, Seguin, TX 78155
MLS# 1968694Listed by: MARTI REALTY GROUP $59,000Active3 beds 1 baths1,016 sq. ft.
1326 Aldama St, Seguin, TX 78155
MLS# 1968644Listed by: OPTION ONE REAL ESTATE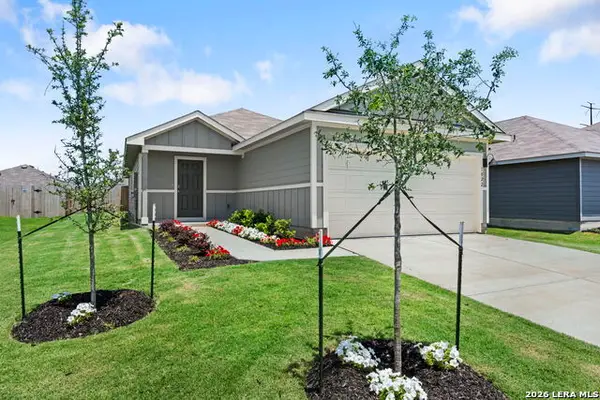 $270,000Active4 beds 2 baths1,573 sq. ft.
1022 Bold Run, Seguin, TX 78155
MLS# 1968555Listed by: MARTI REALTY GROUP $265,000Active4 beds 2 baths1,572 sq. ft.
1038 Bold Run, Seguin, TX 78155
MLS# 1968559Listed by: MARTI REALTY GROUP $275,000Active4 beds 3 baths1,892 sq. ft.
1026 Indian Way, Seguin, TX 78155
MLS# 1968560Listed by: MARTI REALTY GROUP $357,990Active4 beds 3 baths2,074 sq. ft.
133 Yale St, Seguin, TX 78155
MLS# 1968500Listed by: EXP REALTY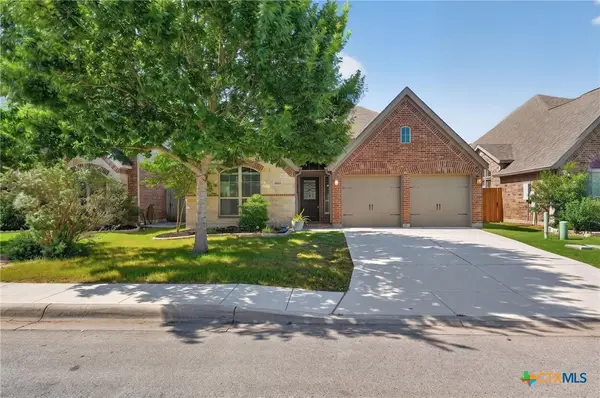 $340,000Active3 beds 2 baths2,088 sq. ft.
1925 Field Brook, Seguin, TX 78155
MLS# 614097Listed by: 1ST CHOICE REALTY GROUP $275,000Active4 beds 3 baths2,042 sq. ft.
832 Indian Mallow, Seguin, TX 78155
MLS# 1968390Listed by: KELLER WILLIAMS HERITAGE $271,123Active4 beds 3 baths2,218 sq. ft.
4109 Lazy Lily Dr, Seguin, TX 78155
MLS# 1968379Listed by: MOVE UP AMERICA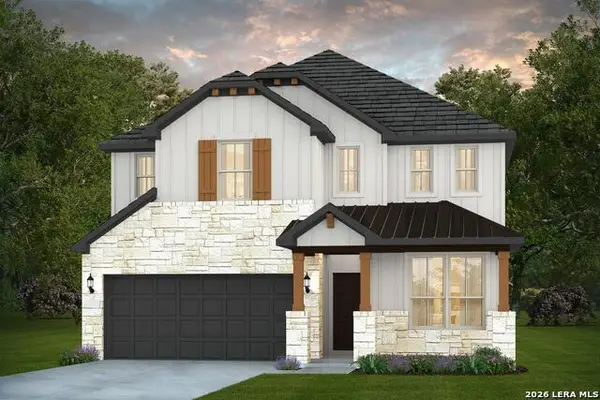 $449,330Active4 beds 3 baths2,938 sq. ft.
220 Wild Creek Rd, Seguin, TX 78155
MLS# 1968374Listed by: MOVE UP AMERICA $850,000Active8 beds 9 baths323,000 sq. ft.
999 Ch Chacara 08, ,
MLS# B26026547Listed by: UNITED REALTY GROUP, INC $220,000Active10.1 Acres
TR 13 Private Road, Other, TX 78155
MLS# 24012457Listed by: BLUE INDIE REALTY INC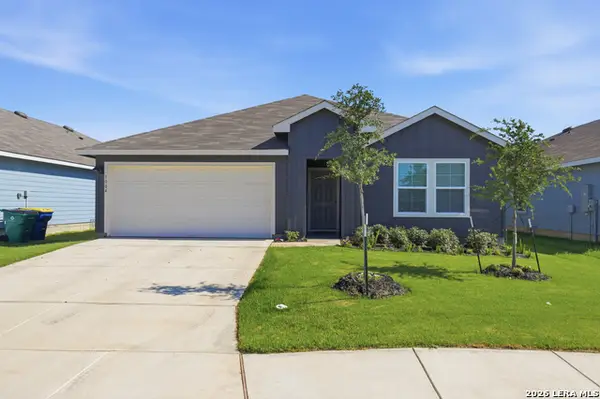 $289,990Active4 beds 2 baths1,796 sq. ft.
1004 Village Run, Seguin, TX 78155
MLS# 1968341Listed by: ERA BROKERS CONSOLIDATED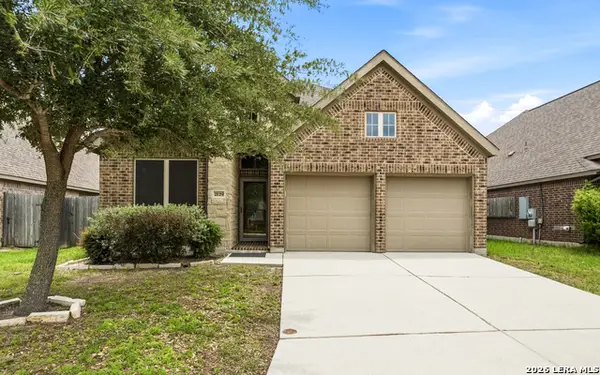 $335,800Active3 beds 2 baths1,969 sq. ft.
2129 Range Rd, Seguin, TX 78155
MLS# 1965352Listed by: COMPASS RE TEXAS, LLC - SA $550,000Active2 beds 1 baths1,400 sq. ft.
766 Rawhide Road, Seguin, TX 78155
MLS# 613676Listed by: CENTURY 21 INTEGRA $259,999Active4 beds 3 baths2,072 sq. ft.
2505 Dino Drive, Seguin, TX 78155
MLS# 614320Listed by: CENTURY 21 SCOTT MYERS, REALTO $150,000Active0.62 Acres
346 Deer Slayer Dr, Seguin, TX 78155
MLS# 1968208Listed by: TEXAS PRESTIGE REALTY $285,000Active5 beds 3 baths1,892 sq. ft.
1034 Gladys Run, Seguin, TX 78155
MLS# 1968222Listed by: MARTI REALTY GROUP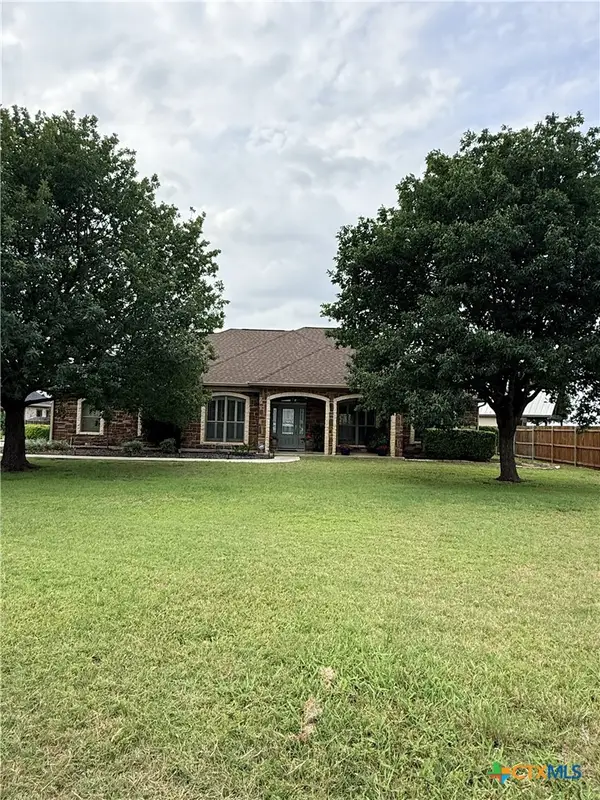 $450,000Pending4 beds 3 baths2,190 sq. ft.
256 Kimbrough, Seguin, TX 78155
MLS# 614098Listed by: CENTURY 21 INTEGRA $259,900Active3 beds 2 baths1,200 sq. ft.
221 Roosevelt Drive, Seguin, TX 78155
MLS# 614268Listed by: PRESTON T JAMES, BROKER $350,000Active-- beds -- baths
0 Batey Rd, Nixon, TX 78140
MLS# 4540788Listed by: HELTA HOMES $405,990Active5 beds 4 baths3,051 sq. ft.
140 Yale St, Seguin, TX 78155
MLS# 1968113Listed by: EXP REALTY $351,990Active4 beds 3 baths1,916 sq. ft.
121 Yale St, Seguin, TX 78155
MLS# 1968134Listed by: EXP REALTY $499,000Active3 beds 3 baths2,528 sq. ft.
225 Deerslayer Drive, Seguin, TX 78155
MLS# 614141Listed by: KELLER WILLIAMS HERITAGE $299,000Active3 beds 2 baths920 sq. ft.
105 Pioneer Home, Seguin, TX 78155
MLS# 614188Listed by: TKO LISTINGS, LLC $399,000Active2 beds 1 baths2,688 sq. ft.
8395 Fm 1101, Seguin, TX 78155
MLS# 1968026Listed by: KELLER WILLIAMS LEGACY $265,000Active3 beds 2 baths1,575 sq. ft.
441 Milfoil Dr, Seguin, TX 78155
MLS# 1965444Listed by: KELLER WILLIAMS HERITAGE $499,000Active3 beds 3 baths2,400 sq. ft.
1139 Creekside Pond Rd, Seguin, TX 78155
MLS# 1959880Listed by: KELLER WILLIAMS HERITAGE $215,000Active4 beds 2 baths1,357 sq. ft.
527 Roosevelt Drive, Seguin, TX 78155
MLS# 614117Listed by: BHHS DON JOHNSON REALTORS - NB $269,000Active3 beds 2 baths1,793 sq. ft.
780 Burges Street, Seguin, TX 78155
MLS# 613979Listed by: ANDERS PIERCE REALTY, LLC $499,000Active3 beds 3 baths2,400 sq. ft.
1139 Creekside Pond, Seguin, TX 78155
MLS# 614070Listed by: KELLER WILLIAMS HERITAGE $289,400Active4 beds 3 baths2,359 sq. ft.
5801 Musquiz Rdg, Seguin, TX 78155
MLS# 9374585Listed by: KELLER WILLIAMS HERITAGE $953,195.15Active52.97 Acres
52.97AC Cross Road, Seguin, TX 78155
MLS# 614020Listed by: SOUTH TEXAS REALTY, LLC $339,005Active4 beds 3 baths2,656 sq. ft.
2533 Heritance Pass, Seguin, TX 78155
MLS# 614026Listed by: EXP REALTY LLC $575,000Active3 beds 2 baths2,161 sq. ft.
2007 Leissner School Rd, Seguin, TX 78155
MLS# 1967653Listed by: ALL CITY SAN ANTONIO REGISTERED SERIES $165,000Active3 beds 2 baths1,752 sq. ft.
276 Riverview Terrace, Seguin, TX 78155
MLS# 613282Listed by: RE/MAX UNITY $700,000Pending2 beds 3 baths1,712 sq. ft.
4450 Old Seguin Luling Road, Seguin, TX 78155
MLS# 613722Listed by: CENTURY 21 INTEGRA $284,000Active3 beds 2 baths1,595 sq. ft.
96 W Hampton Drive, Seguin, TX 78155
MLS# 613918Listed by: ALL CITY SAN ANTONIO REGISTERE $298,900Active3 beds 2 baths2,103 sq. ft.
1648 Eastwood Dr, Seguin, TX 78155
MLS# 1967596Listed by: ALL CITY SAN ANTONIO REGISTERED SERIES $79,900Pending2 beds 1 baths792 sq. ft.
222 N Vaughan Ave, Seguin, TX 78155
MLS# 5606077Listed by: CENTRAL METRO REALTY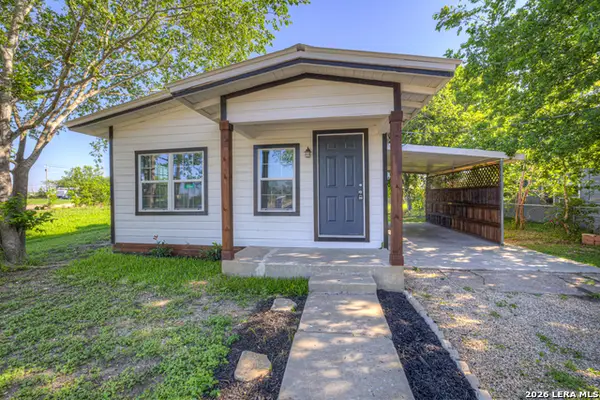 $135,000Active2 beds 1 baths560 sq. ft.
1054 Morelos, Seguin, TX 78155
MLS# 1967455Listed by: KELLER WILLIAMS HERITAGE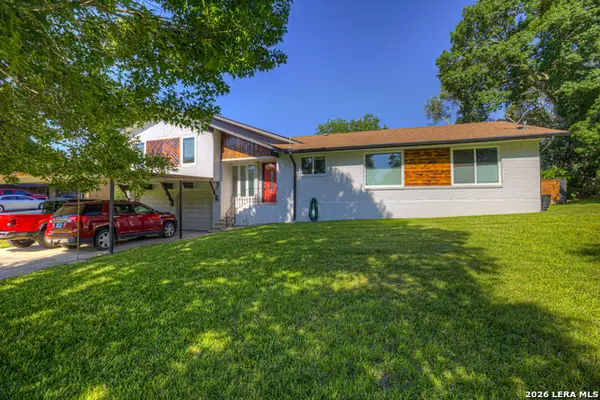 $284,000Active3 beds 2 baths1,595 sq. ft.
96 W Hampton Dr, Seguin, TX 78155
MLS# 1967313Listed by: ALL CITY SAN ANTONIO REGISTERED SERIES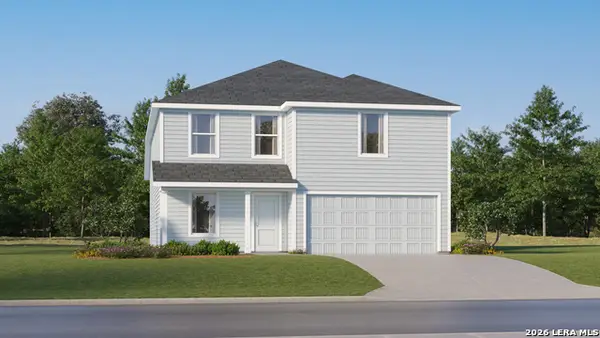 $248,999Active4 beds 3 baths2,193 sq. ft.
3557 Sky Place, Seguin, TX 78155
MLS# 1967314Listed by: MARTI REALTY GROUP- Open Mon, 9am to 7pm
 $210,000Active3 beds 2 baths2,027 sq. ft.
5829 Texas Spur, Seguin, TX 78155
MLS# 1967264Listed by: OPENDOOR BROKERAGE, LLC  $244,575Active3 beds 2 baths1,416 sq. ft.
405 Sunrise Park, Seguin, TX 78155
MLS# 1967101Listed by: SATEX PROPERTIES, INC. $261,645Active3 beds 2 baths1,604 sq. ft.
409 Sunrise Park, Seguin, TX 78155
MLS# 1967106Listed by: SATEX PROPERTIES, INC. $273,004Active3 beds 3 baths1,780 sq. ft.
413 Sunrise Park, Seguin, TX 78155
MLS# 1967110Listed by: SATEX PROPERTIES, INC. $165,000Active3 beds 2 baths1,753 sq. ft.
276 Riverview Ter, Seguin, TX 78155
MLS# 1966980Listed by: RE/MAX UNITY $269,990Active3 beds 2 baths1,459 sq. ft.
3473 Canyon, Seguin, TX 78155
MLS# 1966959Listed by: JB GOODWIN, REALTORS $2,390,000Active5 beds 5 baths4,654 sq. ft.
308 Paseo Del Rio, Seguin, TX 78155
MLS# 1966913Listed by: KELLER WILLIAMS HERITAGE $700,000Active1.07 Acres
3465 N State Highway 46, Seguin, TX 78155
MLS# 1966868Listed by: RED MANSIONS REALTY $624,900Active2 beds 2 baths1,164 sq. ft.
526 Cypress, McQueeney, TX 78123
MLS# 1966760Listed by: NB HOME FINDERS $589,999Active3 beds 2 baths2,200 sq. ft.
1276 River Trl, Seguin, TX 78155
MLS# 1966774Listed by: REAL BROKER, LLC $875,000Active3 beds 3 baths
188 Guadalupe Ranch Ln, Seguin, TX 78155
MLS# 1966792Listed by: KELLER WILLIAMS CITY-VIEW $450,000Active3 beds 2 baths1,984 sq. ft.
501 Turkey Tree Trl, Seguin, TX 78155
MLS# 5318401Listed by: SUNNY LANE REALTY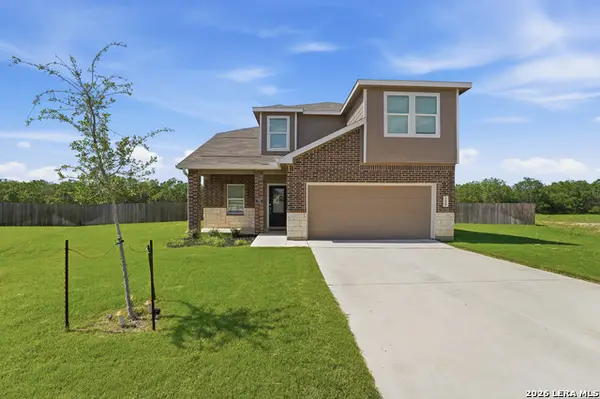 $330,000Active5 beds 4 baths2,467 sq. ft.
200 Alta Vista Ter, Seguin, TX 78155
MLS# 1966733Listed by: CARE REAL ESTATE $695,000Active4 beds 3 baths2,856 sq. ft.
4821 Fm 467, Seguin, TX 78155
MLS# 611575Listed by: HOELKER REAL ESTATE $283,999Active4 beds 3 baths2,278 sq. ft.
10120 Gold Point, Seguin, TX 78155
MLS# 1966578Listed by: MARTI REALTY GROUP $266,999Active4 beds 4 baths2,156 sq. ft.
10132 Gold Point, Seguin, TX 78155
MLS# 1966583Listed by: MARTI REALTY GROUP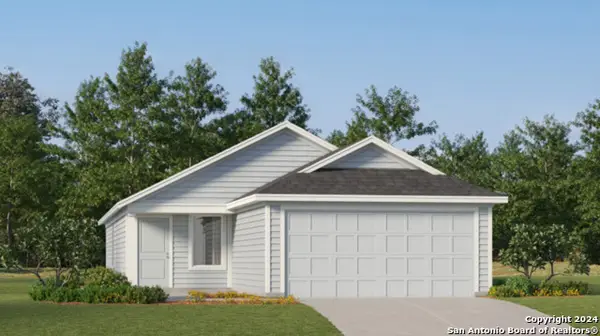 $201,999Active3 beds 2 baths1,402 sq. ft.
5534 Alope Way, Seguin, TX 78155
MLS# 1966590Listed by: MARTI REALTY GROUP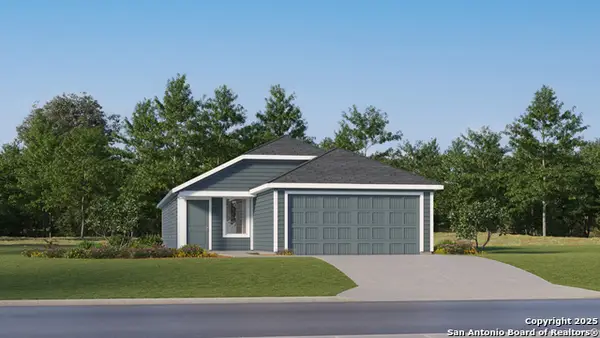 $209,999Active4 beds 2 baths1,575 sq. ft.
5538 Alope Way, Seguin, TX 78155
MLS# 1966593Listed by: MARTI REALTY GROUP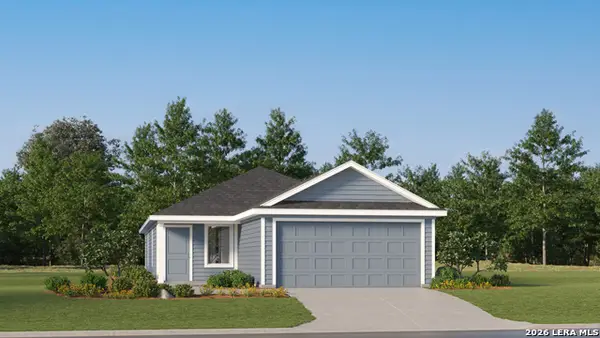 $200,999Active3 beds 2 baths1,411 sq. ft.
5542 Alope Way, Seguin, TX 78155
MLS# 1966597Listed by: MARTI REALTY GROUP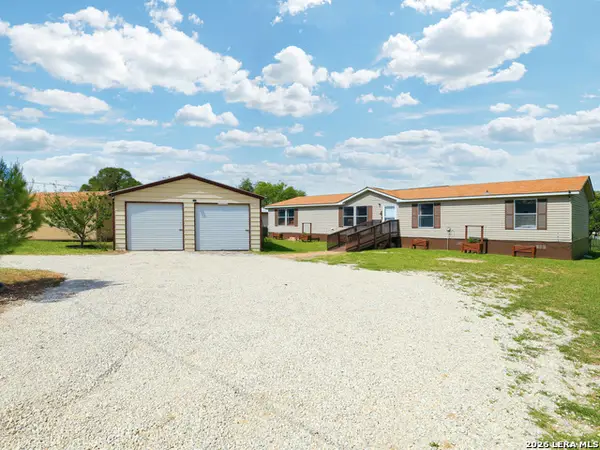 $279,999Active5 beds 3 baths2,040 sq. ft.
107 Frontier Way, Seguin, TX 78155
MLS# 1966515Listed by: EXP REALTY $575,000Active4 beds 3 baths2,687 sq. ft.
145 Bobwhite Trl, Seguin, TX 78155
MLS# 1966494Listed by: TRAVIS SHAW REALTY $318,990Active4 beds 3 baths2,034 sq. ft.
1017 Village Run, Seguin, TX 78155
MLS# 1966431Listed by: D.R. HORTON, AMERICA'S BUILDER $65,000Active0.12 Acres
1622 Starcke St, Seguin, TX 78155
MLS# 9726424Listed by: EXP REALTY, LLC $299,500Active4 beds 3 baths2,304 sq. ft.
2700 La Mundial Street, Seguin, TX 78155
MLS# 613583Listed by: SHARON PETERS, BROKER $275,990Active4 beds 2 baths1,476 sq. ft.
1010 Gladys Run, Seguin, TX 78155
MLS# 1966403Listed by: D.R. HORTON, AMERICA'S BUILDER $299,990Active5 beds 3 baths1,874 sq. ft.
1022 Gladys Run, Seguin, TX 78155
MLS# 1966409Listed by: D.R. HORTON, AMERICA'S BUILDER $325,990Active5 beds 2 baths2,236 sq. ft.
1018 Gladys Run, Seguin, TX 78155
MLS# 1966419Listed by: D.R. HORTON, AMERICA'S BUILDER $299,900Active3 beds 2 baths1,613 sq. ft.
2905 Greenbriar, Seguin, TX 78155
MLS# 613413Listed by: A CUT ABOVE REALTY, LLC $1,880,000Active3 beds 3 baths2,916 sq. ft.
8293 Boenig Road, Seguin, TX 78155
MLS# 613570Listed by: SAN ANTONIO ELITE REALTY $299,990Pending4 beds 3 baths2,034 sq. ft.
731 Prince Albert, Seguin, TX 78155
MLS# 1966381Listed by: D.R. HORTON, AMERICA'S BUILDER $284,990Active4 beds 2 baths1,647 sq. ft.
1030 Gladys Run, Seguin, TX 78155
MLS# 1966398Listed by: D.R. HORTON, AMERICA'S BUILDER $287,490Active3 beds 2 baths1,412 sq. ft.
1519 Splashing Wave Drive, Iowa Colony, TX 77583
MLS# 58016476Listed by: D.R. HORTON $349,990Active4 beds 3 baths2,042 sq. ft.
1518 Splashing Wave Drive, Iowa Colony, TX 77583
MLS# 34985744Listed by: D.R. HORTON $499,000Active4 beds 3 baths1,936 sq. ft.
472 Hickory Forrest Drive, Seguin, TX 78155
MLS# 613519Listed by: KELLER WILLIAMS HERITAGE $1,050,000Active5 beds 3 baths2,625 sq. ft.
10210 S State Highway 123, Seguin, TX 78155
MLS# 1966075Listed by: CENTURY 21 INTEGRA $250,000Active3 beds 2 baths1,450 sq. ft.
808 E Krezdorn Street, Seguin, TX 78155
MLS# 613106Listed by: CENTURY 21 INTEGRA $335,000Active3 beds 2 baths1,939 sq. ft.
2973 Coral Way, Seguin, TX 78155
MLS# 1965988Listed by: RE/MAX GO - NB $390,000Active3 beds 2 baths1,736 sq. ft.
4776 Fm 20, Seguin, TX 78155
MLS# 1965865Listed by: WOUNDED WARRIOR REALTY, LLC $599,000Active4 beds 3 baths3,060 sq. ft.
113 Las Brisas Boulevard, Seguin, TX 78155
MLS# 613097Listed by: CENTURY 21 INTEGRA $185,000Active3.66 Acres
920 Mills Way, Seguin, TX 78155
MLS# 1965667Listed by: BLOOM REALTY $1,050,000Active5 beds 3 baths2,625 sq. ft.
10210 S State Highway 123, Seguin, TX 78155
MLS# 613288Listed by: CENTURY 21 INTEGRA $199,900Active3 beds 2 baths1,090 sq. ft.
528 New Braunfels, Seguin, TX 78155
MLS# 1965562Listed by: DAVALOS & ASSOCIATES $204,900Active3 beds 2 baths1,298 sq. ft.
1602 Sunset St, Seguin, TX 78155
MLS# 1965563Listed by: DAVALOS & ASSOCIATES $225,000Active4 beds 2 baths1,627 sq. ft.
9227 Honey Mesquite, Seguin, TX 78155
MLS# 6778412Listed by: LPT REALTY, LLC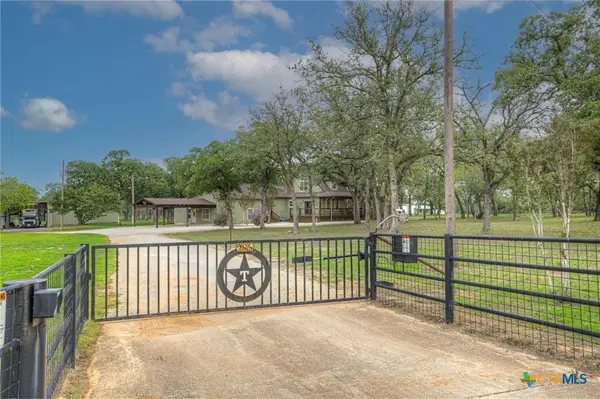 $995,000Active5 beds 4 baths4,253 sq. ft.
285 Rangeland Road, Seguin, TX 78155
MLS# 613233Listed by: RE/MAX GO - SEGUIN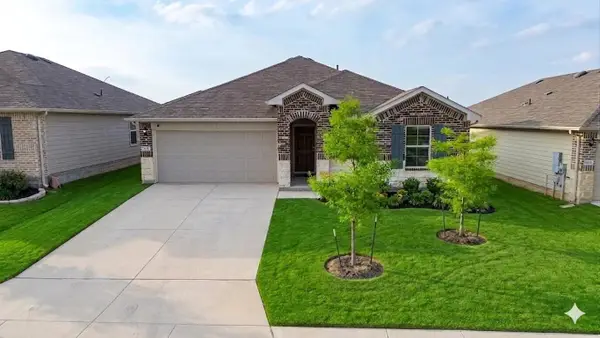 $261,988Active3 beds 2 baths1,263 sq. ft.
821 Gerardia Ct, Seguin, TX 78155
MLS# 2579016Listed by: REAL BROKER, LLC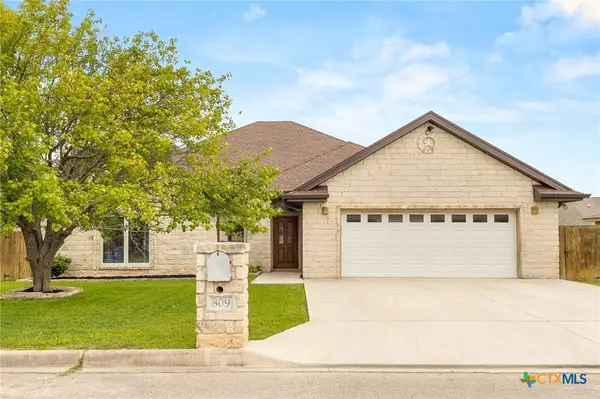 $325,000Active3 beds 2 baths2,101 sq. ft.
809 Saint James, Seguin, TX 78155
MLS# 612689Listed by: CORNER POST REAL ESTATE, LLC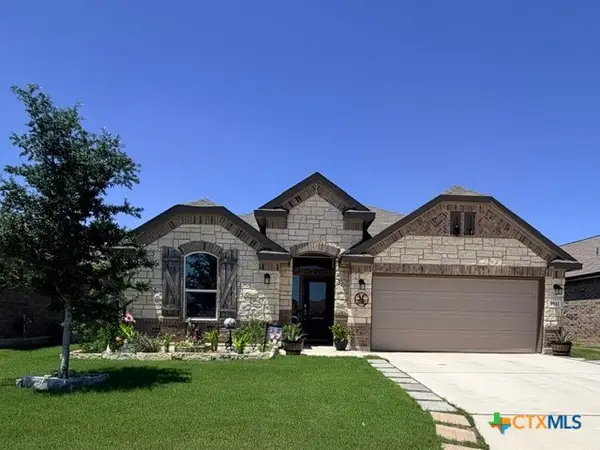 $364,500Active4 beds 3 baths2,377 sq. ft.
8942 Rancher Place, Seguin, TX 78155
MLS# 612328Listed by: A CUT ABOVE REALTY, LLC $315,000Active3 beds 2 baths1,742 sq. ft.
1705 Sudberg, Seguin, TX 78155
MLS# 612542Listed by: ANDERS PIERCE REALTY, LLC $205,000Active3 beds 2 baths1,010 sq. ft.
2409 Ranger Pass, Seguin, TX 78155
MLS# 1965300Listed by: CENTURY 21 INTEGRA $470,000Active3 beds 3 baths2,276 sq. ft.
1132 Creekside Pond Road, Seguin, TX 78155
MLS# 613180Listed by: EPIQUE REALTY LLC $385,000Active-- beds -- baths2,738 sq. ft.
1113/1115 Renee Way, Seguin, TX 78155
MLS# 1965275Listed by: MARSHALL REDDICK REAL ESTATE $385,000Active-- beds -- baths2,738 sq. ft.
1105/1107 Renee Way, Seguin, TX 78155
MLS# 1965279Listed by: MARSHALL REDDICK REAL ESTATE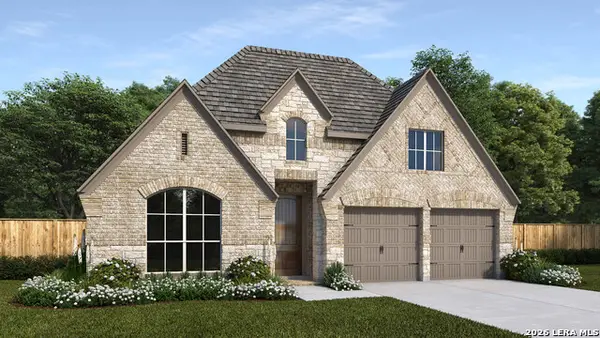 $484,900Active4 beds 3 baths2,545 sq. ft.
2932 Sprouted Grain, Seguin, TX 78155
MLS# 1965224Listed by: PERRY HOMES REALTY, LLC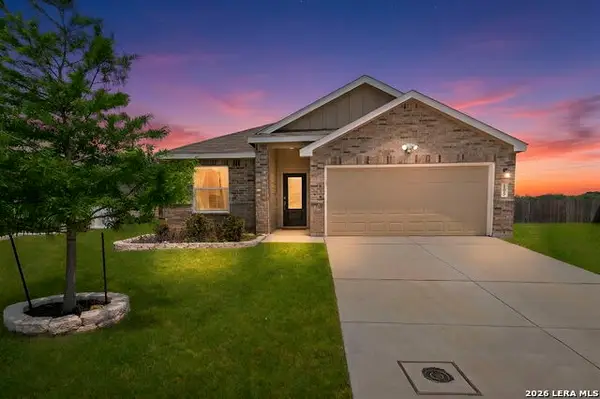 $270,000Active3 beds 2 baths1,675 sq. ft.
105 Olympic Cv, Seguin, TX 78155
MLS# 1965114Listed by: COLDWELL BANKER D'ANN HARPER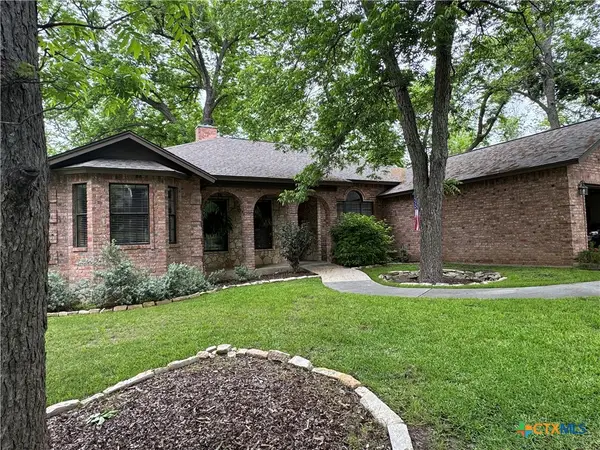 $519,000Active4 beds 2 baths2,159 sq. ft.
433 Las Brisas Boulevard, Seguin, TX 78155
MLS# 613074Listed by: HILL COUNTRY LAND LOCATORS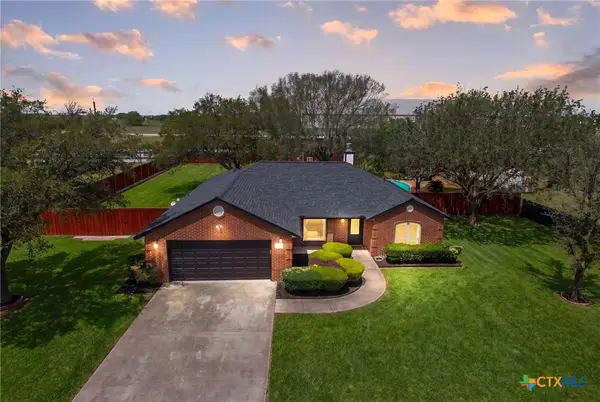 $420,000Active3 beds 2 baths1,553 sq. ft.
268 Cordova Loop, Seguin, TX 78155
MLS# 612247Listed by: COMPASS RE TEXAS, LLC $231,999Active3 beds 3 baths1,657 sq. ft.
10124 Gold Point, Seguin, TX 78155
MLS# 1964954Listed by: MARTI REALTY GROUP $329,900Active4 beds 3 baths2,421 sq. ft.
605 Oleander Crk, Seguin, TX 78155
MLS# 1964959Listed by: KELLER WILLIAMS HERITAGE $250,000Pending2 beds 2 baths1,656 sq. ft.
2620 Blumberg Park Rd, Seguin, TX 78155
MLS# 1964859Listed by: CENTURY 21 RANDALL MORRIS $149,900Active2 beds 1 baths
2425 N Austin St, Seguin, TX 78155
MLS# 1964822Listed by: WHITE LINE REALTY LLC- Open Sat, 9am to 6pm
 $275,000Active4 beds 3 baths1,892 sq. ft.
1027 Gladys Run, Seguin, TX 78155
MLS# 1964666Listed by: MARTI REALTY GROUP 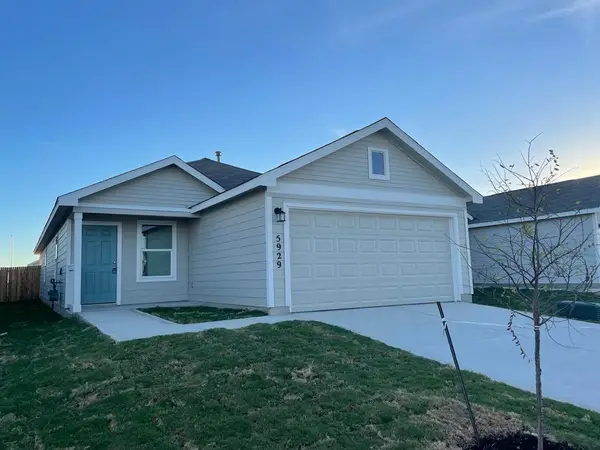 $220,000Active4 beds 2 baths1,627 sq. ft.
5929 Antonio Pl, Seguin, TX 78155
MLS# 5905068Listed by: HORSESHOE BAY RESORT REALTY $450,000Active3 beds 2 baths1,984 sq. ft.
501 Turkey Tree Trl, Seguin, TX 78155
MLS# 1018468Listed by: SUNNY LANE REALTY $512,900Pending3 beds 3 baths2,251 sq. ft.
2945 Sprouted Grain, Seguin, TX 78155
MLS# 1964588Listed by: PERRY HOMES REALTY, LLC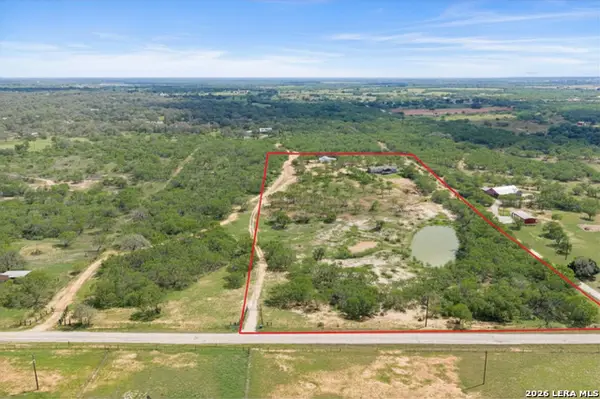 $495,000Pending4 beds 2 baths2,280 sq. ft.
1930 Odaniel Rd, Seguin, TX 78155
MLS# 1964561Listed by: JB GOODWIN, REALTORS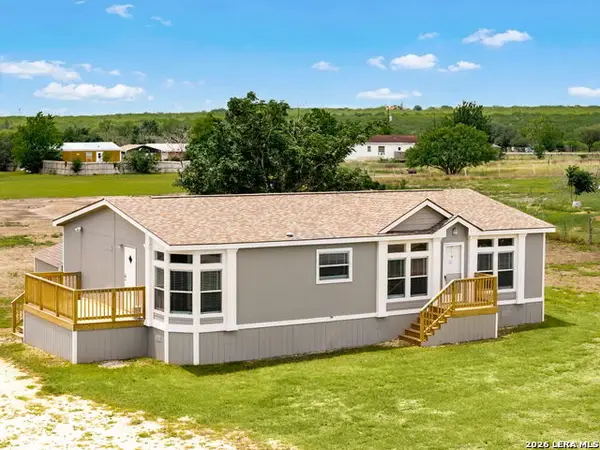 $239,000Active3 beds 2 baths1,486 sq. ft.
407 High Ridge Drive, Seguin, TX 78155
MLS# 1964409Listed by: WIGLESWORTH PROPERTIES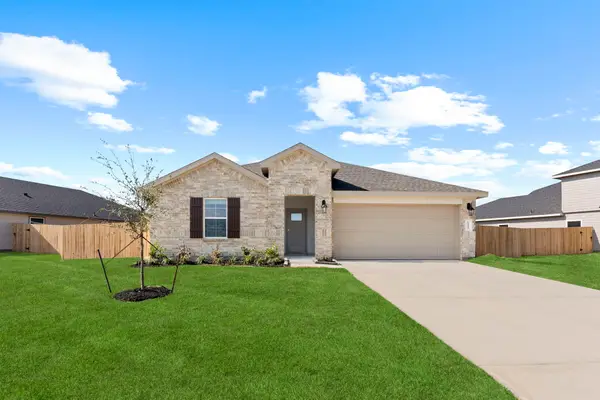 $323,490Pending4 beds 2 baths2,035 sq. ft.
1510 Splashing Wave, Iowa Colony, TX 77583
MLS# 82161325Listed by: D.R. HORTON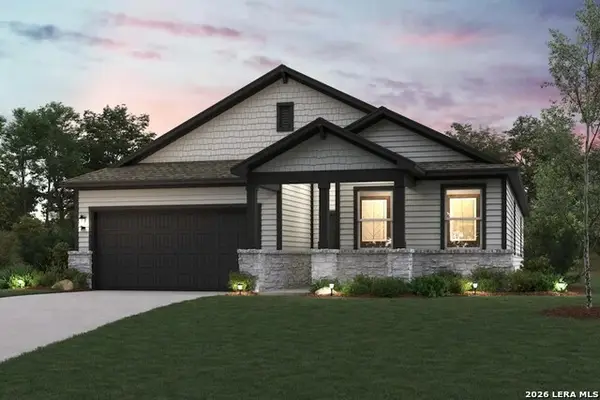 $311,515Active4 beds 3 baths2,013 sq. ft.
2532 Heritance Pass, Seguin, TX 78155
MLS# 1964178Listed by: EXP REALTY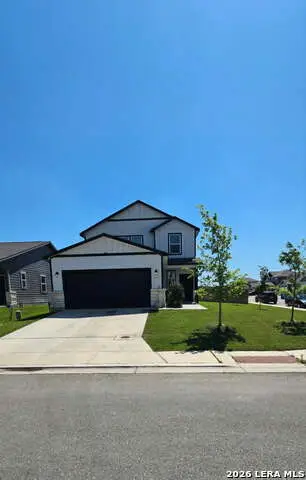 $295,000Active4 beds 3 baths2,178 sq. ft.
2517 Windle Ln, Seguin, TX 78155
MLS# 1964160Listed by: JPAR SAN ANTONIO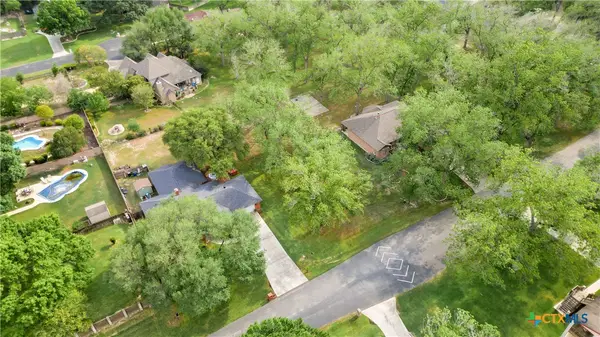 $64,900Active0.35 Acres
427 Las Brisas, Seguin, TX 78155
MLS# 612829Listed by: KELLER WILLIAMS HERITAGE $499,900Active4 beds 4 baths2,574 sq. ft.
2917 Hops Cone, Seguin, TX 78155
MLS# 1964088Listed by: PERRY HOMES REALTY, LLC $150,000Pending1 beds 1 baths399 sq. ft.
2691 Leissner School, Seguin, TX 78155
MLS# 1964058Listed by: KELLER WILLIAMS HERITAGE $624,900Active5 beds 5 baths3,546 sq. ft.
1705 Weissen Way, Seguin, TX 78155
MLS# 1964071Listed by: PERRY HOMES REALTY, LLC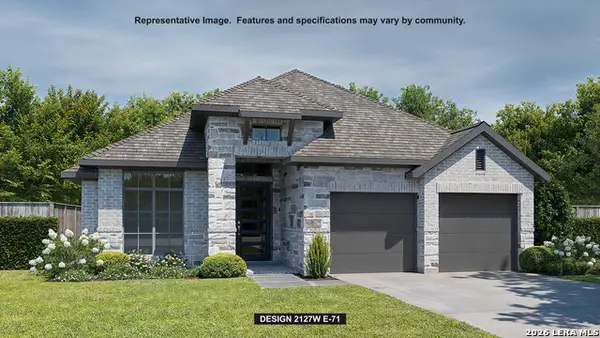 $444,900Active3 beds 2 baths2,127 sq. ft.
2916 Flaxen Way, Seguin, TX 78155
MLS# 1964079Listed by: PERRY HOMES REALTY, LLC $405,000Active4 beds 2 baths2,344 sq. ft.
122 Castlewood Dr, Seguin, TX 78155
MLS# 1964044Listed by: EXP REALTY $322,950Active12.92 Acres
TRACT 1 Hartfield, Seguin, TX 78121
MLS# 1963943Listed by: PREMIUM PROPERTY SERVICES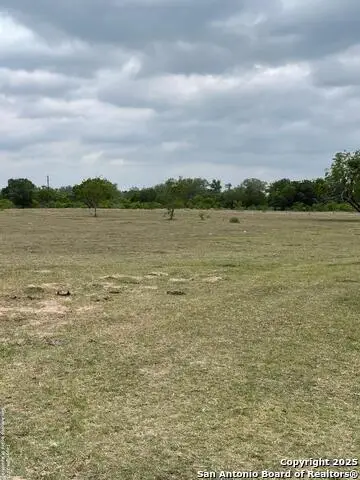 $245,000Active10.1 Acres
TRACT 4 Hartfield, Seguin, TX 78155
MLS# 1963949Listed by: PREMIUM PROPERTY SERVICES $309,990Active3 beds 2 baths1,683 sq. ft.
1020 Amber Lake, Seguin, TX 78155
MLS# 1963973Listed by: ESCAPE REALTY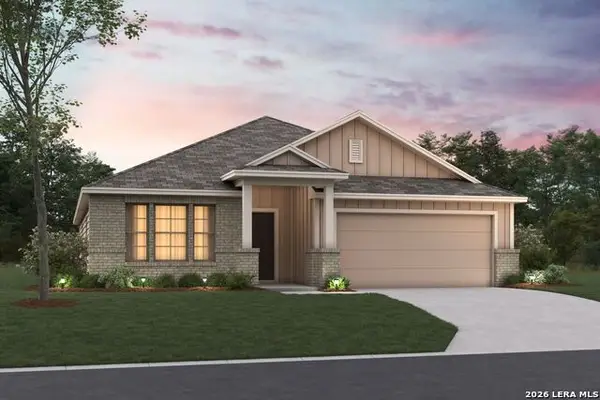 $339,990Active4 beds 3 baths2,240 sq. ft.
2848 Cavern Grove, Seguin, TX 78155
MLS# 1963957Listed by: ESCAPE REALTY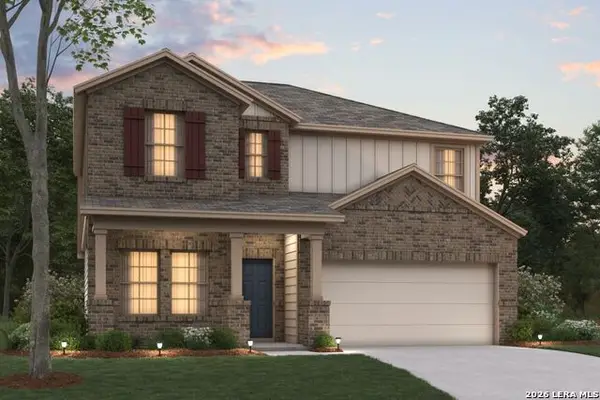 $354,990Active5 beds 3 baths2,444 sq. ft.
1012 Amber Lake, Seguin, TX 78155
MLS# 1963962Listed by: ESCAPE REALTY $344,990Active4 beds 3 baths2,188 sq. ft.
1016 Amber Lake, Seguin, TX 78155
MLS# 1963965Listed by: ESCAPE REALTY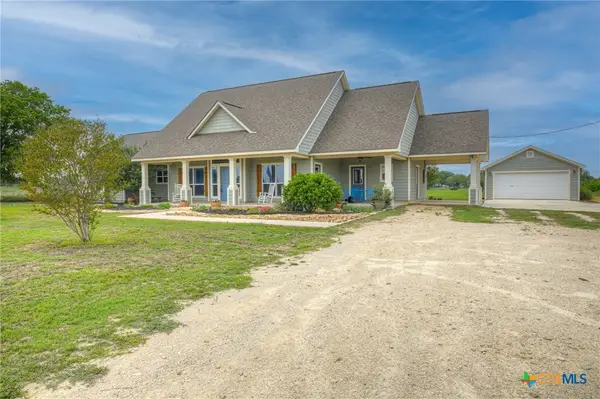 $649,000Active3 beds 4 baths2,405 sq. ft.
2048 E Martindale Road, Seguin, TX 78155
MLS# 612717Listed by: GERONIMO CREEK REALTY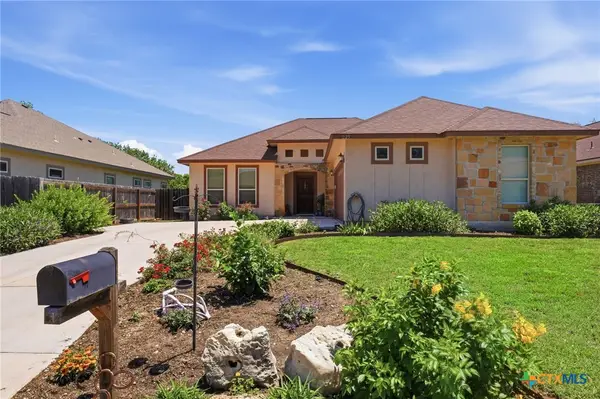 $279,500Active3 beds 2 baths1,401 sq. ft.
225 Greenway Drive, Seguin, TX 78155
MLS# 612599Listed by: BHHS DON JOHNSON REALTORS - NB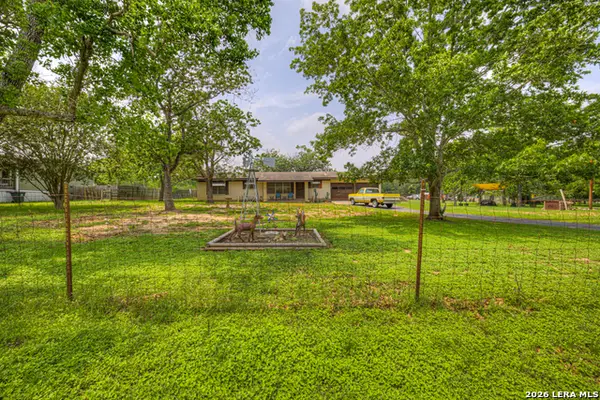 $350,000Active3 beds 3 baths1,774 sq. ft.
236 Shady Ln, Seguin, TX 78155
MLS# 1963719Listed by: RE/MAX GO - NB $749,000Active3 beds 2 baths2,040 sq. ft.
21.16 1951 Dowdy Rd, Seguin, TX 78155
MLS# 1963588Listed by: STEPSTONE REALTY, LLC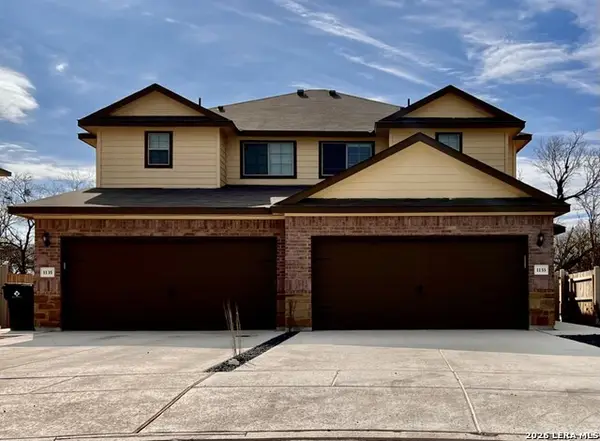 $379,900Active-- beds -- baths2,744 sq. ft.
1133/1135 Renee, Seguin, TX 78155
MLS# 1963547Listed by: MARSHALL REDDICK REAL ESTATE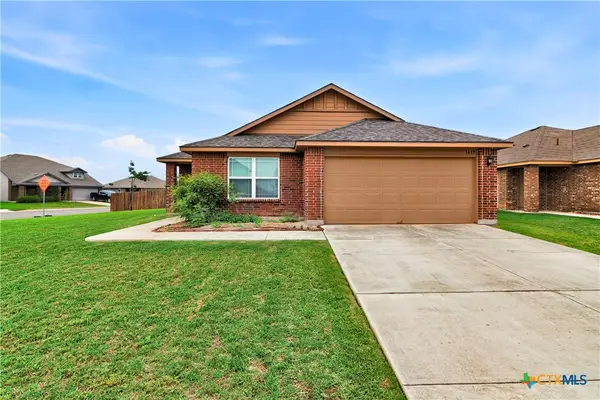 $250,000Active4 beds 2 baths1,574 sq. ft.
1437 Birmingham Drive, Seguin, TX 78155
MLS# 612196Listed by: KAREN MCMILLAN PROPERTIES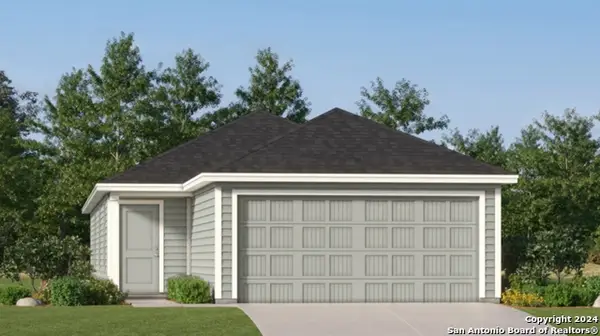 $209,999Active4 beds 2 baths1,483 sq. ft.
202 Pastar Falls, Seguin, TX 78155
MLS# 1963509Listed by: MARTI REALTY GROUP $795,000Active4 beds 2 baths1,200 sq. ft.
1576 Settlers Way #2, Seguin, TX 78155
MLS# 612529Listed by: CENTURY 21 RUNNING S REALTY $795,000Active4 beds 2 baths2,000 sq. ft.
1576 Settlers Way, Seguin, TX 78155
MLS# 1963469Listed by: CENTURY 21 RUNNING S REALTY $699,900Active4 beds 3 baths3,160 sq. ft.
180 Wampum Way, Seguin, TX 78155
MLS# 5974521Listed by: KELLER WILLIAMS HERITAGE $319,990Active4 beds 3 baths2,042 sq. ft.
339 Boatman Cove, Seguin, TX 78155
MLS# 1963271Listed by: D.R. HORTON, AMERICA'S BUILDER $329,900Active4 beds 3 baths2,042 sq. ft.
800 Bahia Place, Seguin, TX 78155
MLS# 612516Listed by: KELLER WILLIAMS HERITAGE $59,900Active0.36 Acres
Lot 7A W Seideman Street, Seguin, TX 78155
MLS# 612420Listed by: WHITE LINE REALTY LLC $349,384Active5 beds 3 baths2,622 sq. ft.
1233 Sweden, Seguin, TX 78155
MLS# 1963049Listed by: LEGEND HOMES $34,000Active0.5 Acres
LOT 102 & 103 Hollamon Dr, Seguin, TX 78155
MLS# 1962869Listed by: THE HESLES AGENCY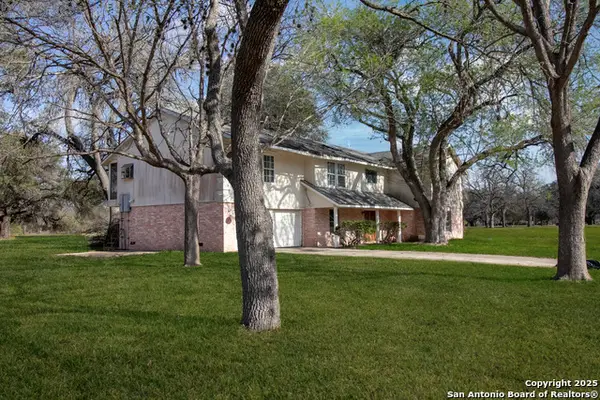 $240,000Active4 beds 2 baths2,477 sq. ft.
7 Glen Cove Dr, Seguin, TX 78155
MLS# 1962870Listed by: THE HESLES AGENCY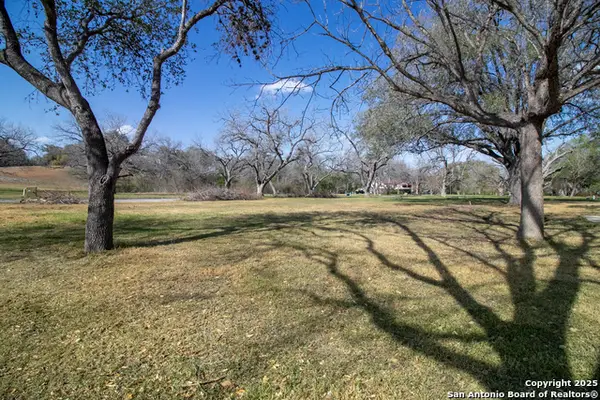 $34,000Active0.37 Acres
5 E Hampton Dr, Seguin, TX 78155
MLS# 1962871Listed by: THE HESLES AGENCY $319,990Active4 beds 3 baths2,042 sq. ft.
315 Boatman Cove, Seguin, TX 78155
MLS# 1962779Listed by: D.R. HORTON, AMERICA'S BUILDER $650,000Active3 beds 2 baths1,791 sq. ft.
3727 Fm 467, Seguin, TX 78155
MLS# 1962763Listed by: TEXAS EDGE REALTY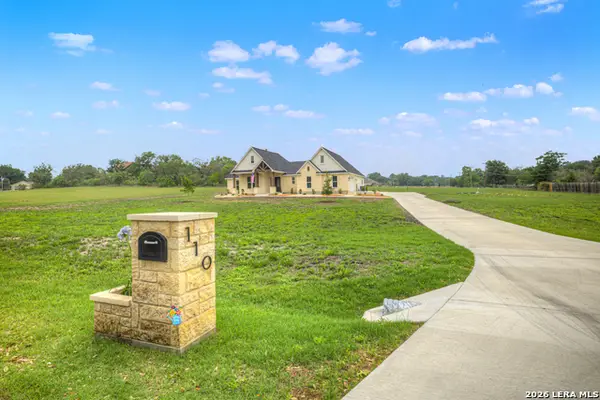 $750,000Active4 beds 3 baths2,215 sq. ft.
110 Lake Village Rd, Seguin, TX 78155
MLS# 1962769Listed by: ALL CITY SAN ANTONIO REGISTERED SERIES $248,475Active3 beds 2 baths1,576 sq. ft.
4117 Lazy Lily Dr, Seguin, TX 78155
MLS# 1962659Listed by: MOVE UP AMERICA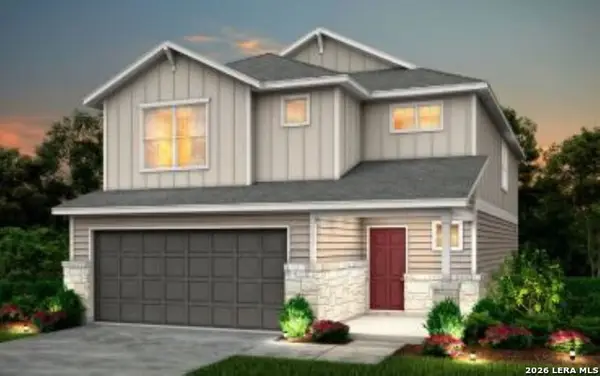 $276,535Active4 beds 3 baths2,331 sq. ft.
4121 Lazy Lily Dr, Seguin, TX 78155
MLS# 1962662Listed by: MOVE UP AMERICA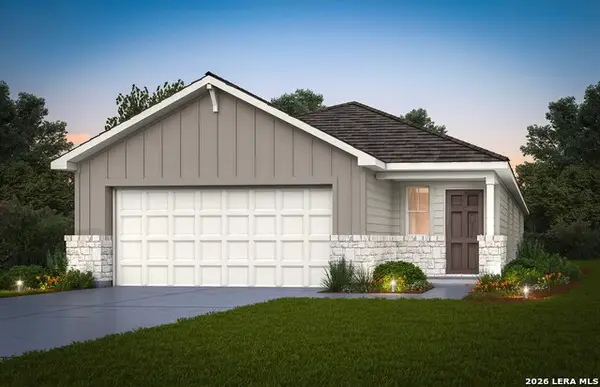 $257,567Active4 beds 2 baths1,776 sq. ft.
4125 Lazy Lily Dr, Seguin, TX 78155
MLS# 1962664Listed by: MOVE UP AMERICA $324,990Pending5 beds 3 baths2,688 sq. ft.
125 Dionicio Loop, Seguin, TX 78155
MLS# 1962675Listed by: CA & COMPANY, REALTORS $314,990Active4 beds 3 baths2,268 sq. ft.
129 Dionicio Loop, Seguin, TX 78155
MLS# 1962679Listed by: CA & COMPANY, REALTORS $247,990Active3 beds 2 baths1,402 sq. ft.
136 Dionicio Loop, Seguin, TX 78155
MLS# 1962680Listed by: CA & COMPANY, REALTORS $274,990Active5 beds 3 baths1,892 sq. ft.
1023 Gladys Run, Seguin, TX 78155
MLS# 1962538Listed by: D.R. HORTON, AMERICA'S BUILDER $269,990Active5 beds 3 baths1,892 sq. ft.
1014 Gladys Run, Seguin, TX 78155
MLS# 1962550Listed by: D.R. HORTON, AMERICA'S BUILDER $318,990Active4 beds 3 baths2,034 sq. ft.
1016 Village Run, Seguin, TX 78155
MLS# 1962553Listed by: D.R. HORTON, AMERICA'S BUILDER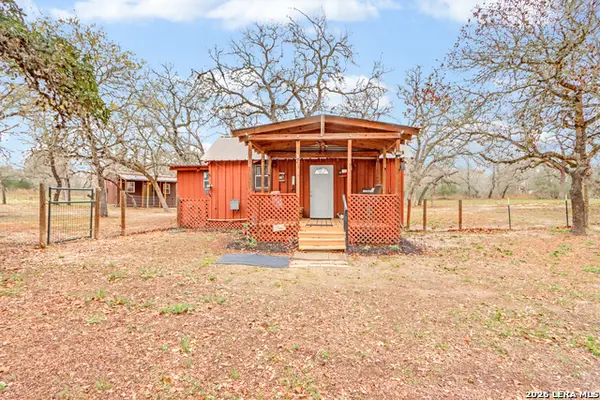 $319,000Active1 beds -- baths580 sq. ft.
12851 Fm 1117, Seguin, TX 78155
MLS# 1962503Listed by: ANDERS PIERCE REALTY $289,990Active3 beds 3 baths1,883 sq. ft.
11115 Luckenbach Loop, Converse, TX 78109
MLS# 1962237Listed by: LEGEND HOMES $238,000Active3 beds 2 baths1,211 sq. ft.
240 W Martindale St, Seguin, TX 78155
MLS# 1962144Listed by: FRAIRE REALTY GROUP, INC.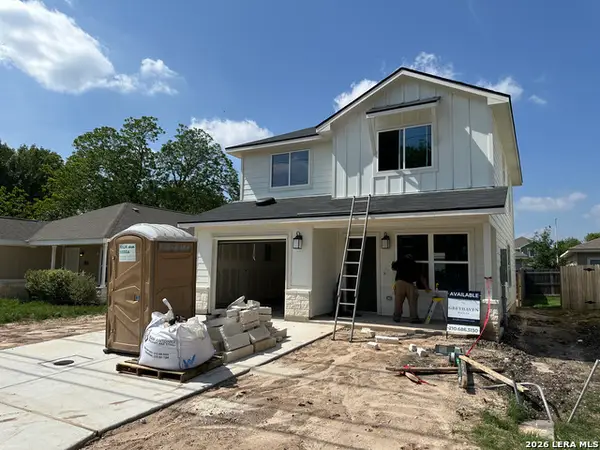 $238,000Active3 beds 3 baths1,370 sq. ft.
304 W Martindale, Seguin, TX 78155
MLS# 1962157Listed by: FRAIRE REALTY GROUP, INC.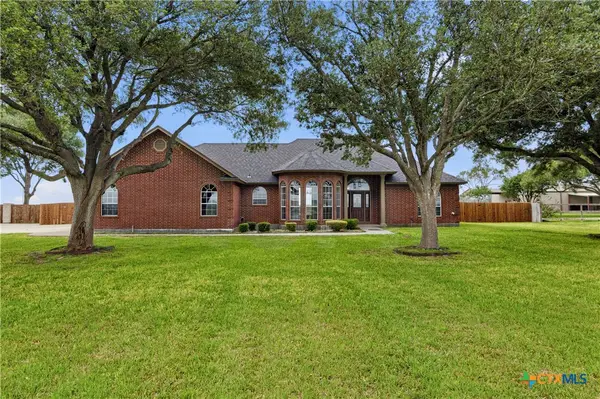 $625,000Active5 beds 3 baths2,812 sq. ft.
1031 Fm 20, Seguin, TX 78155
MLS# 610353Listed by: A CUT ABOVE REALTY, LLC $152,900Active3 beds 1 baths864 sq. ft.
412 E Walnut Street, Seguin, TX 78155
MLS# 612005Listed by: REAL BROKER, LLC $297,000Active4 beds 2 baths1,781 sq. ft.
937 Cinnamon Teal, Seguin, TX 78155
MLS# 1962021Listed by: EXP REALTY $514,999Active4 beds 4 baths3,377 sq. ft.
3067 Mustang Meadow, Seguin, TX 78155
MLS# 611998Listed by: MIDCITI REALTY $140,000Active0.51 Acres
537 Longhorn, Seguin, TX 78155
MLS# 1961805Listed by: CORNER POST REAL ESTATE, LLC $329,777Active4 beds 3 baths2,055 sq. ft.
608 Cypress Arbor, Seguin, TX 78155
MLS# 611705Listed by: KELLER WILLIAMS HERITAGE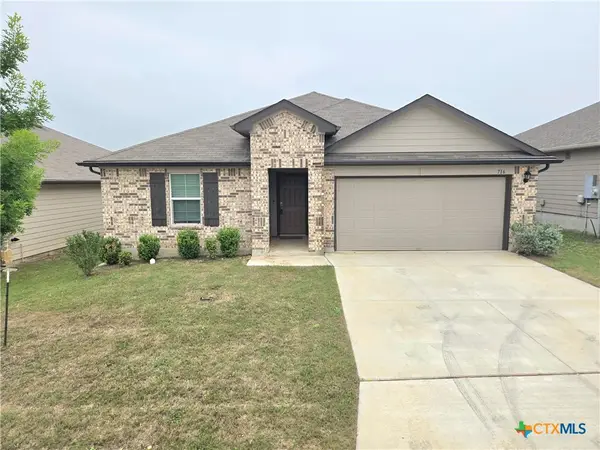 $235,000Pending4 beds 2 baths1,781 sq. ft.
716 Monarch Drive, Seguin, TX 78155
MLS# 612031Listed by: WALKER TEXAS TEAM, KW REALTY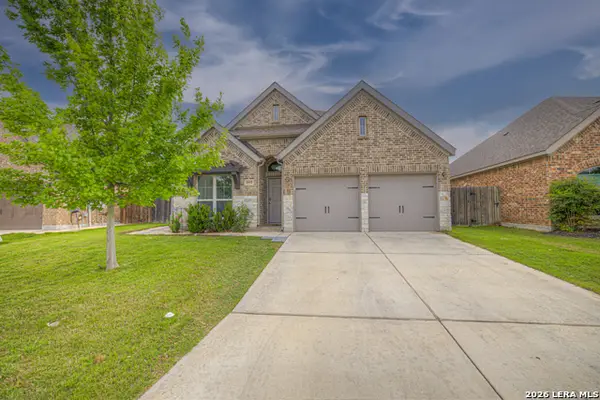 $415,000Active4 beds 3 baths2,286 sq. ft.
2977 Grove Terrace, Seguin, TX 78155
MLS# 1961590Listed by: RE/MAX GO - NB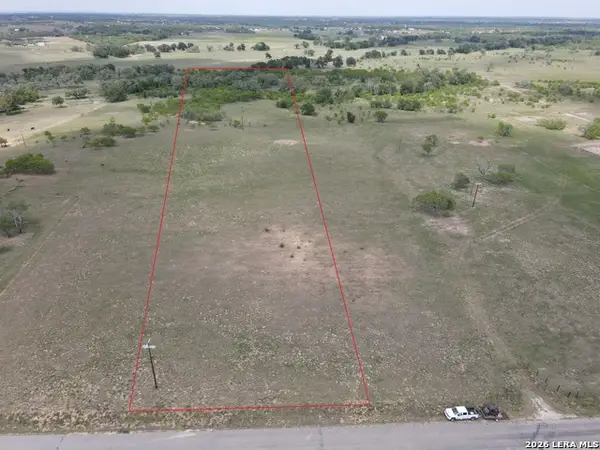 $245,000Active10.1 Acres
1110 Hartfield Road, Seguin, TX 78155
MLS# 1961516Listed by: CENTURY 21 INTEGRA $549,999Active4 beds 5 baths2,873 sq. ft.
400 N Bowie Street, Seguin, TX 78155
MLS# 611932Listed by: CORNER POST REAL ESTATE, LLC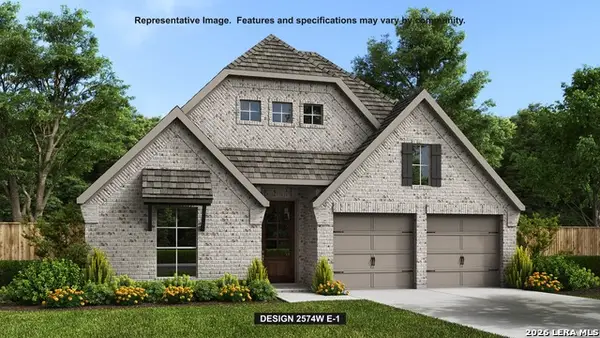 $494,900Active4 beds 3 baths2,574 sq. ft.
2940 Sprouted Grain, Seguin, TX 78155
MLS# 1961360Listed by: PERRY HOMES REALTY, LLC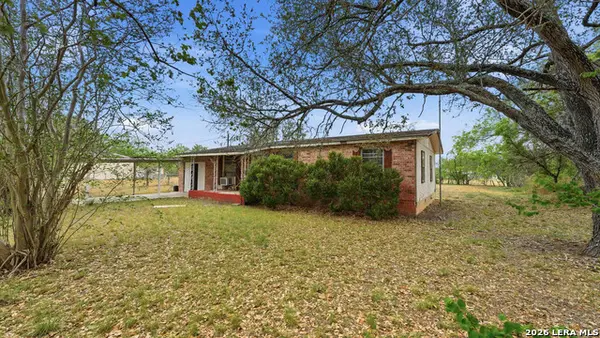 $150,000Active3 beds 1 baths1,008 sq. ft.
3651 E Ih 10, Seguin, TX 78155
MLS# 1961099Listed by: KELLER WILLIAMS HERITAGE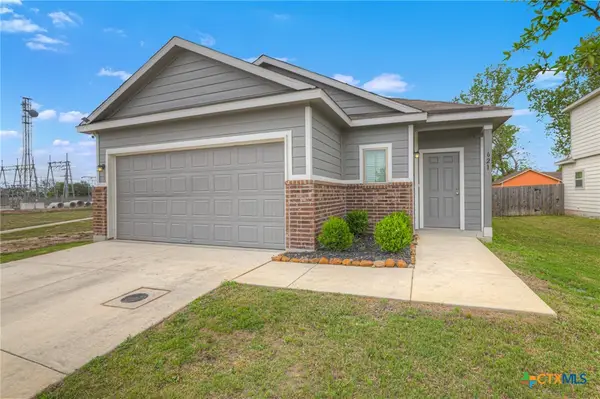 $255,990Active3 beds 2 baths1,500 sq. ft.
621 Kulpa Cross, Seguin, TX 78155
MLS# 611757Listed by: RE/MAX GO - NB
Local realty services provided by:CENTURY 21 North East, CENTURY 21 Judge Fite Company, CENTURY 21 Harvey Properties, CENTURY 21 Move With Us
Some properties that appear for sale on this web site may subsequently have been sold and may no longer be available. The data relating to real estate for sale on this web site comes in part from the FHAAR IDX INFO SHARE PROGRAM. Real estate listings held by brokerage firms other than CENTURY 21 North East include the name of the listing agent. Copyright 2026 FHAAR IDX INFO SHARE PROGRAM. Last Updated June 7, 2026 TX_FRAR Member Broker: Lisa Shaw
Information provided, in part, by North Texas Real Estate Information Systems, Inc. Last Updated June 7, 2026 Listings with the NTREIS logo are listed by brokerages other than CENTURY 21 Harvey Properties. GDAR Member Broker: Renee Harvey
Copyright 2026, Houston Realtors Information Service, Inc. All information provided is deemed reliable but is not guaranteed and should be independently verified. IDX information is provided exclusively for consumers' personal, non-commercial use, it may not be used for any purpose other than to identify prospective properties consumers may be interested in purchasing, and the data is deemed reliable but is not guaranteed accurate by the MLS. HARMLS Member Broker: Ashley Conlon
Popular searches near 78155
Popular neighborhoods near 78155
- Cotton Crossing, New Braunfels homes for sale
- Cottonwood Creek, San Marcos homes for sale
- Cypress Rapids at Gruene, New Braunfels homes for sale
- Downtown, New Braunfels homes for sale
- Gruene Crossing, New Braunfels homes for sale
- Havenwood at Hunter's Crossing, New Braunfels homes for sale
- Hunters Creek, New Braunfels homes for sale
- Lake McQueeney Area, McQueeney homes for sale
- Las Palomas Country Club, Stockdale homes for sale
- Mission Oaks, New Braunfels homes for sale
- Morningstar, New Braunfels homes for sale
- Northpark Meadows, New Braunfels homes for sale
- Oak Run, New Braunfels homes for sale
- Oakwood Estates, New Braunfels homes for sale
- Oelkers Acres, New Braunfels homes for sale
- Park Ridge, New Braunfels homes for sale
- River Oaks, New Braunfels homes for sale
- Rolling Valley, New Braunfels homes for sale
- Town Creek, New Braunfels homes for sale
- West Pointe, New Braunfels homes for sale
Counties near Seguin, 78155
- Atascosa County homes for sale
- Bandera County homes for sale
- Bastrop County homes for sale
- Bexar County homes for sale
- Blanco County homes for sale
- Caldwell County homes for sale
- Comal County homes for sale
- DeWitt County homes for sale
- Fayette County homes for sale
- Goliad County homes for sale
- Gonzales County homes for sale
- Guadalupe County homes for sale
- Hays County homes for sale
- Karnes County homes for sale
- Kendall County homes for sale
- Lavaca County homes for sale
- Medina County homes for sale
- Travis County homes for sale
- Williamson County homes for sale
- Wilson County homes for sale
Protect your home and budget from life's surprises with an Assurant Home Warranty, backed by a partner that supports you through every step of homeownership. Explore Plans.
©2026 Century 21 Real Estate LLC. All rights reserved. CENTURY 21®, the CENTURY 21 Logo and C21® are service marks owned by Century 21 Real Estate LLC. Century 21 Real Estate LLC fully supports the principles of the Fair Housing Act and the Equal Opportunity Act. Each office is independently owned and operated. Listing information is deemed reliable but not guaranteed accurate.