- Birmingham homes for sale
- Chadds Ford homes for sale
- Chadds Ford homes for sale
- Dilworthtown homes for sale
- East Bradford homes for sale
- East Caln homes for sale
- East Goshen homes for sale
- East Marlborough homes for sale
- Newlin homes for sale
- Pennsbury homes for sale
- Pocopson homes for sale
- Thornbury homes for sale
- Thornbury homes for sale
- Thornton homes for sale
- Unionville homes for sale
- West Bradford homes for sale
- West Chester homes for sale
- West Goshen Township homes for sale
- West Whiteland homes for sale
- Westtown homes for sale
19382, PA - homes for sale
181 of 181 results displayed
- New
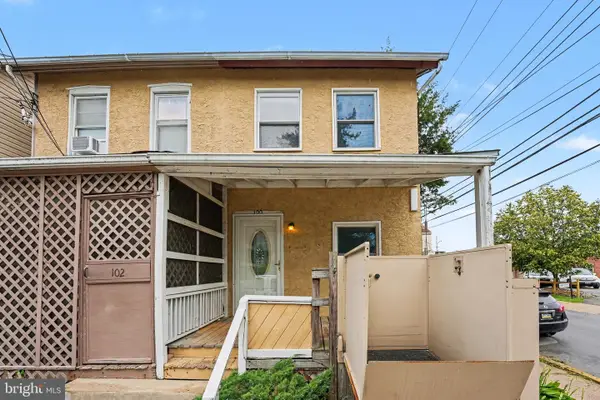 $325,000Active2 beds 1 baths804 sq. ft.
100 Poplar St, WEST CHESTER, PA 19382
MLS# PACT2129772Listed by: KELLER WILLIAMS OF CENTRAL PA - New
 $690,000Active4 beds 3 baths4,204 sq. ft.
522 Raspberry Ln, WEST CHESTER, PA 19382
MLS# PACT2128976Listed by: EXP REALTY, LLC - Coming SoonOpen Thu, 4 to 6pm
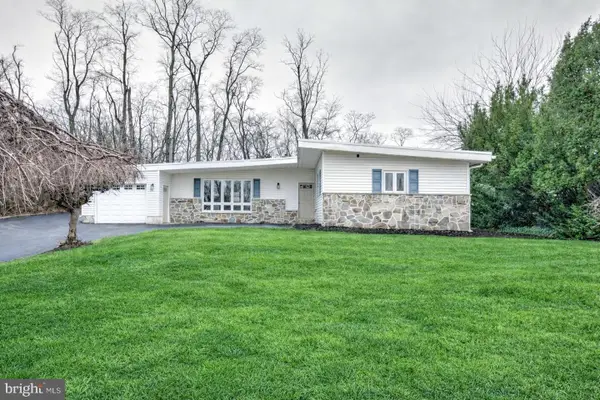
 $535,000Coming Soon3 beds 3 baths
95 Greenview Dr, WEST CHESTER, PA 19382
MLS# PACT2129682Listed by: KW GREATER WEST CHESTER - New
 $445,000Active3 beds 3 baths2,112 sq. ft.
751 Scotch Way #65, WEST CHESTER, PA 19382
MLS# PACT2129522Listed by: BHHS FOX & ROACH-WEST CHESTER - Coming Soon
 $649,000Coming Soon3 beds 3 baths
2749 Whittleby Ct #25, WEST CHESTER, PA 19382
MLS# PACT2129572Listed by: RE/MAX PREFERRED - NEWTOWN SQUARE - Coming Soon
 $730,000Coming Soon3 beds 2 baths
1058 Lenape Rd, WEST CHESTER, PA 19382
MLS# PACT2129556Listed by: KELLER WILLIAMS REAL ESTATE - WEST CHESTER - New
 $749,995Active3 beds 4 baths3,167 sq. ft.
54 Old Barn Dr, WEST CHESTER, PA 19382
MLS# PADE2118486Listed by: HOWARD HANNA REAL ESTATE SERVICES - New
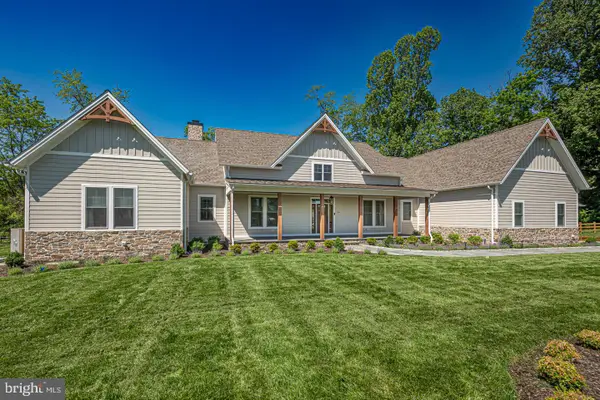
 $1,195,000Active5 beds 4 baths3,301 sq. ft.
875 Locust Grove Rd, WEST CHESTER, PA 19382
MLS# PACT2129306Listed by: RE/MAX PREFERRED - NEWTOWN SQUARE - Coming Soon
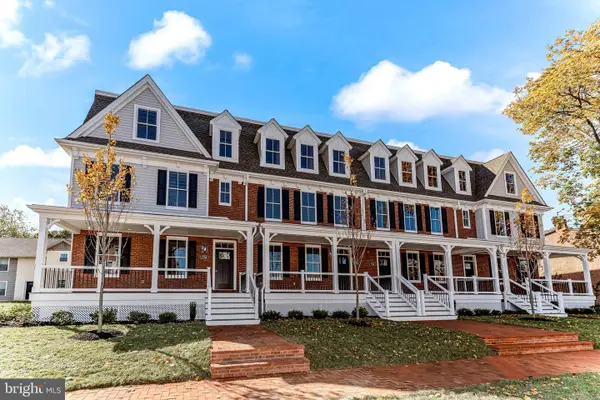
 $1,995,000Coming Soon-- Acres
1121 S New Street, WEST CHESTER, PA 19382
MLS# PACT2126386Listed by: KURFISS SOTHEBY'S INTERNATIONAL REALTY - Coming Soon
 $2,895,000Coming Soon4 beds 5 baths
501 W Street Rd, WEST CHESTER, PA 19382
MLS# PACT2127046Listed by: KURFISS SOTHEBY'S INTERNATIONAL REALTY - Coming Soon
 $2,195,000Coming Soon5 beds 2 baths
1123 S New Street, WEST CHESTER, PA 19382
MLS# PACT2127048Listed by: KURFISS SOTHEBY'S INTERNATIONAL REALTY - New
 $925,000Active4 beds 2 baths1,902 sq. ft.
708 Old Westtown Rd, WEST CHESTER, PA 19382
MLS# PACT2129270Listed by: RE/MAX MAIN LINE-PAOLI - New
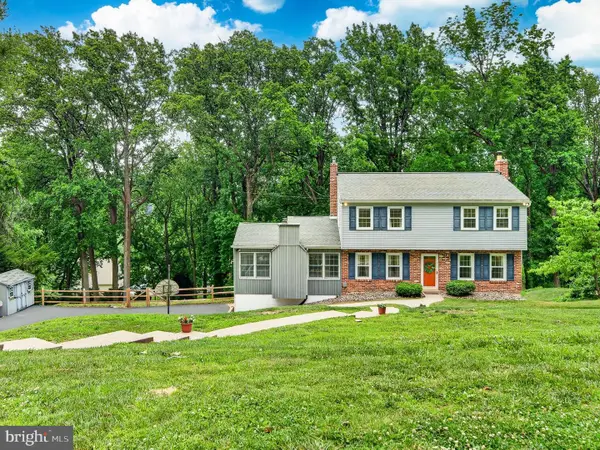
 $975,000Active4 beds 3 baths3,588 sq. ft.
609 Winston Ln, WEST CHESTER, PA 19382
MLS# PACT2128172Listed by: RE/MAX INTEGRITY 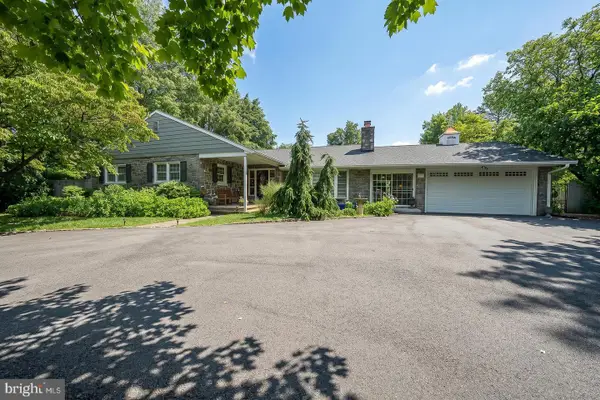 $780,000Pending5 beds 4 baths4,812 sq. ft.
837 S High St, WEST CHESTER, PA 19382
MLS# PACT2128952Listed by: BHHS FOX & ROACH-MEDIA- New
 $750,000Active4 beds 4 baths2,884 sq. ft.
1518 Woodland Rd, WEST CHESTER, PA 19382
MLS# PACT2129116Listed by: RE/MAX TOWN & COUNTRY - Coming Soon
 $295,000Coming Soon1 beds 1 baths
407 Everest Cir #407, WEST CHESTER, PA 19382
MLS# PACT2128936Listed by: KELLER WILLIAMS REALTY DEVON-WAYNE 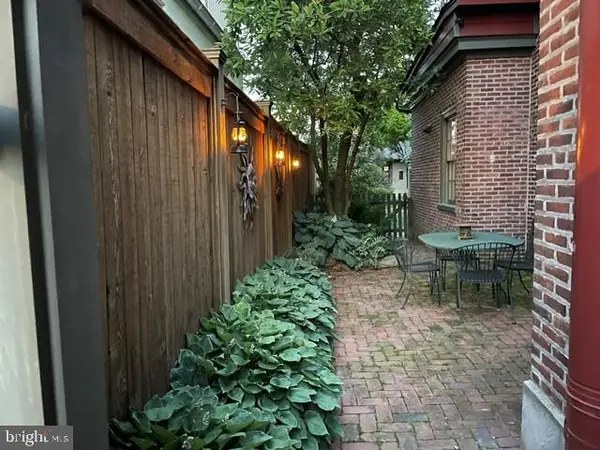 $795,000Pending3 beds 2 baths1,912 sq. ft.
216 W Miner St, WEST CHESTER, PA 19382
MLS# PACT2128444Listed by: COLDWELL BANKER REALTY- New
 $685,000Active4 beds 3 baths2,286 sq. ft.
974 Francis Cir, WEST CHESTER, PA 19382
MLS# PACT2129054Listed by: KELLER WILLIAMS REAL ESTATE-BLUE BELL - New
 $1,750,000Active4 beds 4 baths3,868 sq. ft.
1110 W Street Rd, WEST CHESTER, PA 19382
MLS# PACT2129038Listed by: BHHS FOX & ROACH-MEDIA - New
 $2,750,000Active4 beds 4 baths5,000 sq. ft.
1110 W Street Rd #b, WEST CHESTER, PA 19382
MLS# PACT2129042Listed by: BHHS FOX & ROACH-MEDIA  $675,000Pending4 beds 3 baths2,800 sq. ft.
505 Emily Cir, WEST CHESTER, PA 19382
MLS# PACT2128272Listed by: REAL BROKER, LLC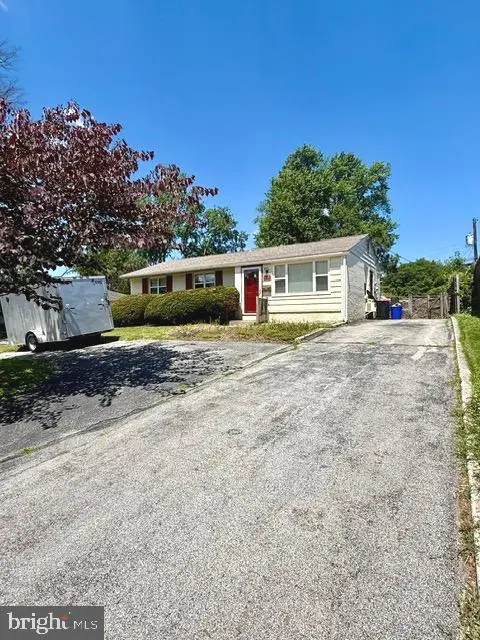 $339,900Pending2 beds 1 baths952 sq. ft.
409 W Rosedale Ave, WEST CHESTER, PA 19382
MLS# PACT2128922Listed by: ABSOLUTE REAL ESTATE CHESCO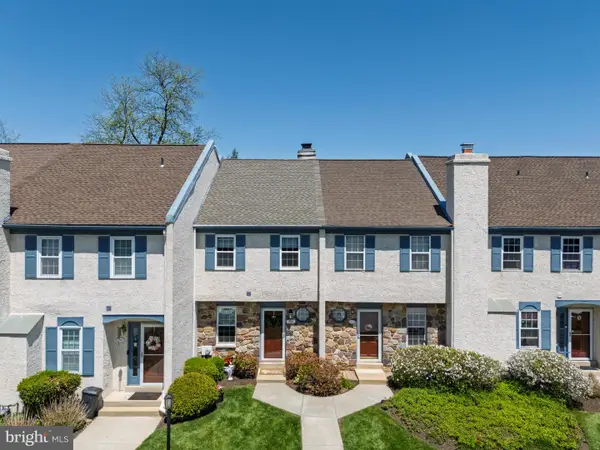 $385,000Pending3 beds 2 baths1,709 sq. ft.
304 Hampstead Pl #304c, WEST CHESTER, PA 19382
MLS# PACT2128130Listed by: KW GREATER WEST CHESTER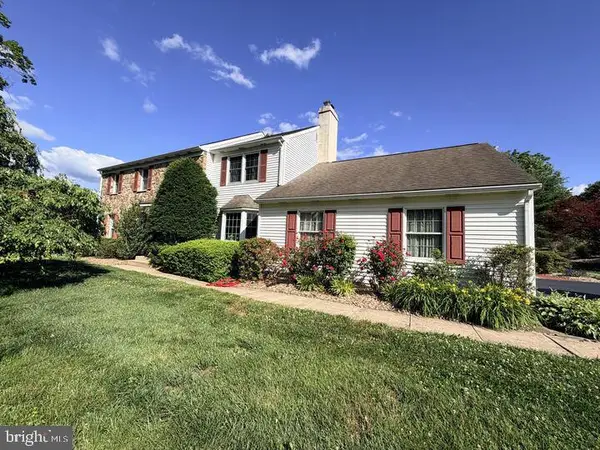 $950,000Pending4 beds 3 baths3,290 sq. ft.
1002 Farm Ln, WEST CHESTER, PA 19382
MLS# PACT2128418Listed by: RE/MAX MAIN LINE-WEST CHESTER $8,950,000Active5 beds 10 baths23,956 sq. ft.
1245 S Creek Rd, WEST CHESTER, PA 19382
MLS# PACT2118020Listed by: EXP REALTY, LLC $425,000Pending3 beds 3 baths2,408 sq. ft.
2204 Winterbridge Ln #2204, WEST CHESTER, PA 19382
MLS# PACT2128540Listed by: KELLER WILLIAMS REAL ESTATE - MEDIA $500,000Pending4 beds 3 baths2,016 sq. ft.
762 Shropshire Dr, WEST CHESTER, PA 19382
MLS# PACT2128614Listed by: COMPASS PENNSYLVANIA, LLC $314,900Active3 beds 1 baths1,148 sq. ft.
521 E Barnard St, WEST CHESTER, PA 19382
MLS# PACT2128416Listed by: RE/MAX ACE REALTY $860,000Pending4 beds 3 baths2,266 sq. ft.
604 Gages Ln, WEST CHESTER, PA 19382
MLS# PACT2127430Listed by: BHHS FOX & ROACH-CHADDS FORD $895,000Pending4 beds 3 baths3,862 sq. ft.
1059 Kerwood Rd, WEST CHESTER, PA 19382
MLS# PACT2125416Listed by: EXP REALTY, LLC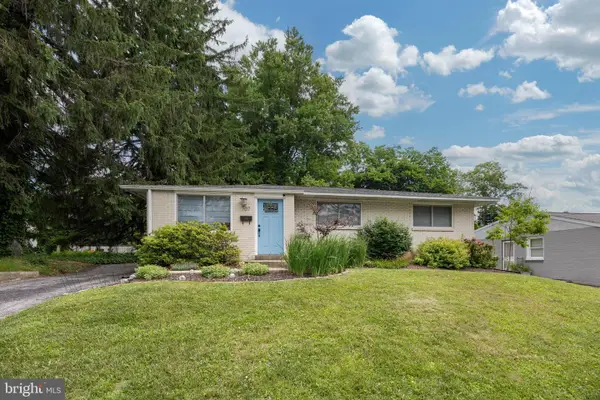 $425,000Pending3 beds 1 baths888 sq. ft.
707 S Bradford Ave, WEST CHESTER, PA 19382
MLS# PACT2128254Listed by: RE/MAX PREFERRED - NEWTOWN SQUARE $285,000Pending1 beds 1 baths828 sq. ft.
700 Bradford Ter, WEST CHESTER, PA 19382
MLS# PACT2128180Listed by: KELLER WILLIAMS REAL ESTATE - WEST CHESTER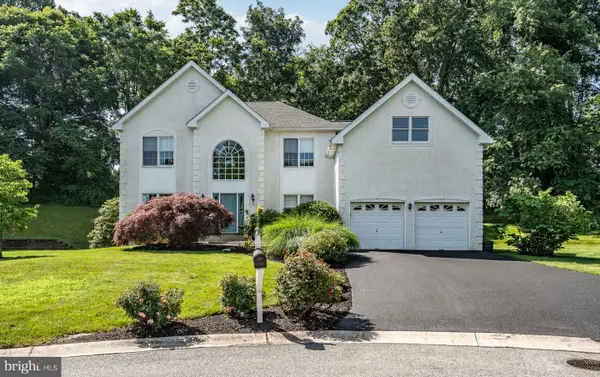 $889,900Active4 beds 3 baths3,458 sq. ft.
1361 Wooded Knls, WEST CHESTER, PA 19382
MLS# PACT2128308Listed by: LPT REALTY, LLC- Open Fri, 11am to 2pm
 $694,900Active3 beds 2 baths1,598 sq. ft.
800 Falcon Ln, WEST CHESTER, PA 19382
MLS# PACT2128354Listed by: HOMEZU BY SIMPLE CHOICE  $749,900Pending4 beds 3 baths2,771 sq. ft.
1368 Brinton Run Rd, WEST CHESTER, PA 19382
MLS# PACT2128280Listed by: REALTY MARK ASSOCIATES - KOP $670,000Pending4 beds 3 baths2,247 sq. ft.
314 Baywood Rd, WEST CHESTER, PA 19382
MLS# PACT2128286Listed by: KELLER WILLIAMS REAL ESTATE -EXTON $739,000Pending3 beds 3 baths2,514 sq. ft.
309 Star Tavern Ln, WEST CHESTER, PA 19382
MLS# PACT2128112Listed by: KW GREATER WEST CHESTER $245,000Pending2 beds 1 baths1,500 sq. ft.
246 Summit House #246, WEST CHESTER, PA 19382
MLS# PACT2128168Listed by: KW GREATER WEST CHESTER $240,000Active2 beds 1 baths1,100 sq. ft.
364 Summit House #364, WEST CHESTER, PA 19382
MLS# PACT2128226Listed by: COLDWELL BANKER REALTY $1,760,000Active4 beds 4 baths5,100 sq. ft.
The Warren Millstone Cir, WEST CHESTER, PA 19380
MLS# PACT2128088Listed by: BHHS FOX & ROACH MALVERN-PAOLI- Open Sat, 2 to 3pm
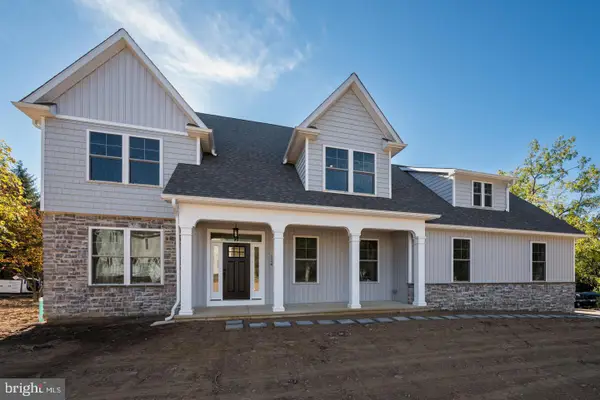
 $1,200,000Active4 beds 3 baths4,073 sq. ft.
195 William Penn Blvd, WEST CHESTER, PA 19382
MLS# PACT2128054Listed by: EXP REALTY, LLC  $1,250,000Active4 beds 5 baths4,553 sq. ft.
1048 Preserve Ln, WEST CHESTER, PA 19382
MLS# PACT2127996Listed by: KW GREATER WEST CHESTER $1,690,000Pending4 beds 4 baths4,283 sq. ft.
7 Bolingbroke Rd, WEST CHESTER, PA 19382
MLS# PADE2110246Listed by: RE/MAX TOWN & COUNTRY $535,000Active3 beds 3 baths1,866 sq. ft.
822 Brettingham Ct #909, WEST CHESTER, PA 19382
MLS# PACT2127178Listed by: KELLER WILLIAMS REAL ESTATE -EXTON $425,000Pending3 beds 3 baths1,720 sq. ft.
2504 Winterbridge Ln #2504, WEST CHESTER, PA 19382
MLS# PACT2127788Listed by: WEICHERT, REALTORS - CORNERSTONE $1,399,000Active5 beds 5 baths5,432 sq. ft.
592 W Creek Rd, WEST CHESTER, PA 19382
MLS# PACT2127976Listed by: COMPASS PENNSYLVANIA, LLC $799,900Pending4 beds 3 baths3,880 sq. ft.
916 Bridle Ln, WEST CHESTER, PA 19382
MLS# PACT2127932Listed by: BHHS FOX & ROACH-WEST CHESTER $795,000Pending5 beds 4 baths2,506 sq. ft.
1413 Lenape Rd, WEST CHESTER, PA 19382
MLS# PACT2127400Listed by: KW GREATER WEST CHESTER $300,000Pending1.03 Acres
511 Walnut Hill Rd, WEST CHESTER, PA 19382
MLS# PACT2115796Listed by: BEILER-CAMPBELL REALTORS-KENNETT SQUARE $250,000Pending2 beds 1 baths945 sq. ft.
3017 Valley Dr #3017, WEST CHESTER, PA 19382
MLS# PACT2127470Listed by: KELLER WILLIAMS REAL ESTATE -EXTON $795,000Pending3 beds 4 baths3,717 sq. ft.
304 Greenbriar Dr, WEST CHESTER, PA 19382
MLS# PACT2127026Listed by: BHHS FOX & ROACH-WEST CHESTER $595,000Pending3 beds 3 baths2,443 sq. ft.
912 Springwood Dr, WEST CHESTER, PA 19382
MLS# PACT2127408Listed by: KW GREATER WEST CHESTER $695,000Pending4 beds 3 baths2,621 sq. ft.
1115 Woodstock Ln, WEST CHESTER, PA 19382
MLS# PACT2127300Listed by: KW GREATER WEST CHESTER $1,250,000Pending5 beds 5 baths4,552 sq. ft.
103 Hidden Pond Way, WEST CHESTER, PA 19382
MLS# PACT2127484Listed by: COLDWELL BANKER REALTY $785,000Pending4 beds 3 baths3,277 sq. ft.
1109 Edward Ln, WEST CHESTER, PA 19382
MLS# PACT2127190Listed by: KELLER WILLIAMS REAL ESTATE -EXTON $1,525,000Pending6 beds 7 baths7,560 sq. ft.
14 Maentel Dr, WEST CHESTER, PA 19382
MLS# PACT2127478Listed by: RE/MAX EDGE $799,000Pending4 beds 3 baths3,136 sq. ft.
609 E Pleasant Grove Rd, WEST CHESTER, PA 19382
MLS# PACT2126138Listed by: CG REALTY, LLC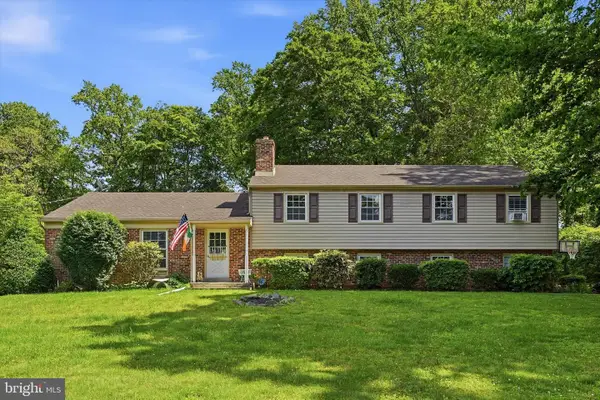 $565,000Pending4 beds 3 baths2,104 sq. ft.
802 Little Shiloh Rd, WEST CHESTER, PA 19382
MLS# PACT2127424Listed by: RE/MAX PREFERRED - NEWTOWN SQUARE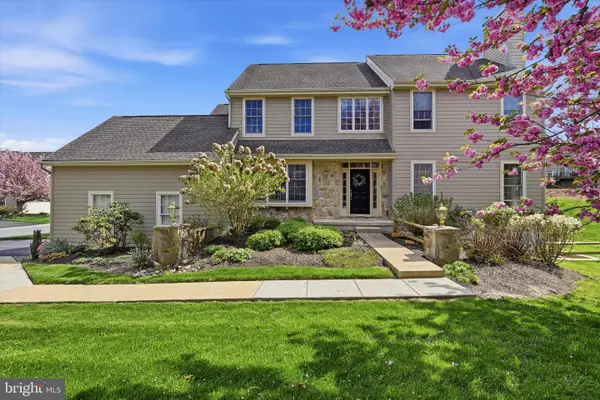 $635,000Pending3 beds 4 baths3,194 sq. ft.
349 Lea Dr, WEST CHESTER, PA 19382
MLS# PACT2122988Listed by: RE/MAX ACTION ASSOCIATES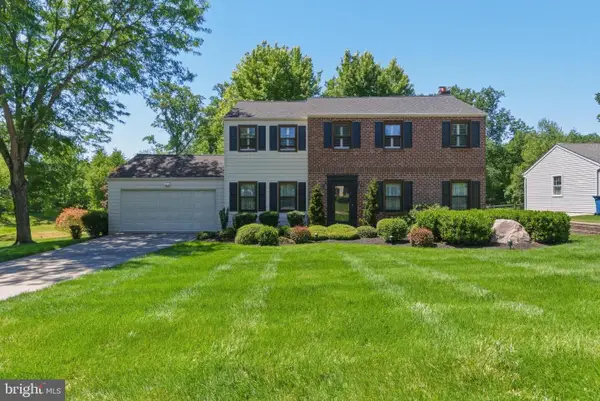 $724,000Pending4 beds 3 baths2,002 sq. ft.
716 Wilson Cir, WEST CHESTER, PA 19382
MLS# PACT2127030Listed by: CHESCO REALTY GROUP, LLC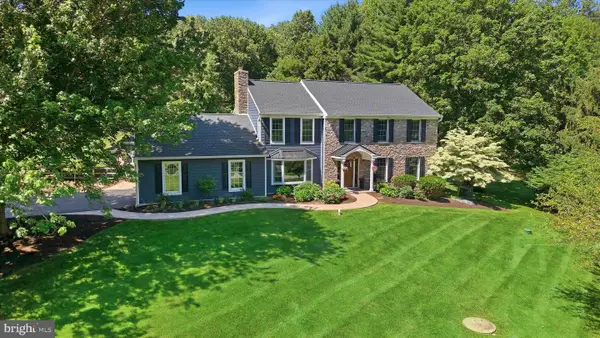 $949,900Pending4 beds 4 baths3,792 sq. ft.
763 Beversrede Trl, WEST CHESTER, PA 19382
MLS# PACT2127082Listed by: BHHS FOX & ROACH-WEST CHESTER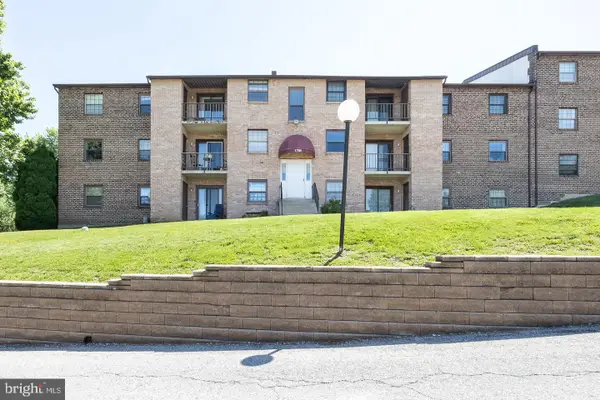 $209,900Pending2 beds 1 baths900 sq. ft.
1709 Valley Dr #1709, WEST CHESTER, PA 19382
MLS# PACT2127522Listed by: KELLER WILLIAMS REAL ESTATE -EXTON $649,900Pending4 beds 3 baths2,166 sq. ft.
1043 Carolyn Dr, WEST CHESTER, PA 19382
MLS# PACT2126686Listed by: RE/MAX MAIN LINE-WEST CHESTER $3,195,000Active8 beds -- baths8,416 sq. ft.
227 S High St, WEST CHESTER, PA 19382
MLS# PACT2127410Listed by: MAC REAL ESTATE SERVICES LLC $1,095,000Pending5 beds 3 baths2,880 sq. ft.
804 General Sterling Dr, WEST CHESTER, PA 19382
MLS# PACT2124728Listed by: SPRINGER REALTY GROUP $559,000Pending3 beds 3 baths2,128 sq. ft.
121 Forelock Ct, WEST CHESTER, PA 19382
MLS# PACT2127110Listed by: COMPASS PENNSYLVANIA, LLC $495,000Pending1 beds 1 baths1,116 sq. ft.
1110 W Street Rd, WEST CHESTER, PA 19382
MLS# PACT2126528Listed by: BHHS FOX & ROACH-MEDIA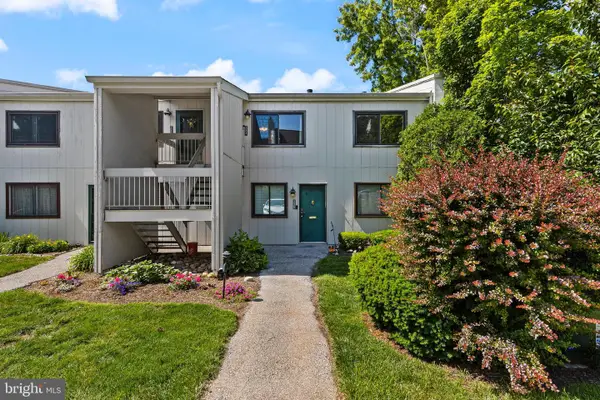 $259,000Pending2 beds 1 baths1,100 sq. ft.
231 Summit House #231, WEST CHESTER, PA 19382
MLS# PACT2127112Listed by: EXP REALTY, LLC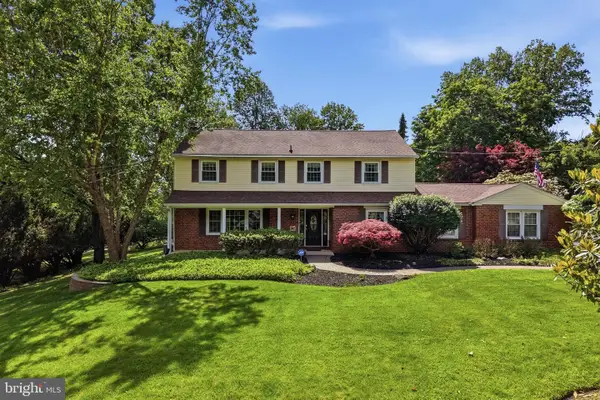 $799,900Pending4 beds 3 baths2,470 sq. ft.
1078 Kerwood Rd, WEST CHESTER, PA 19382
MLS# PACT2126130Listed by: CG REALTY, LLC $289,900Active2 beds 2 baths1,088 sq. ft.
2003 Valley Dr #2003, WEST CHESTER, PA 19382
MLS# PACT2127032Listed by: WEICHERT REALTORS-TURNERSVILLE $599,900Pending3 beds 2 baths2,020 sq. ft.
820 Spruce Ave, WEST CHESTER, PA 19382
MLS# PACT2127106Listed by: KW GREATER WEST CHESTER- Open Tue, 4 to 7pm
 $499,900Active4 beds 2 baths1,826 sq. ft.
904 S Chester Rd, WEST CHESTER, PA 19382
MLS# PACT2127064Listed by: KELLER WILLIAMS ELITE  $599,900Active5 beds 2 baths2,314 sq. ft.
531 S Walnut St, WEST CHESTER, PA 19382
MLS# PACT2127010Listed by: COMPASS $685,000Pending3 beds 3 baths2,400 sq. ft.
92 Spruce Aly, WEST CHESTER, PA 19382
MLS# PACT2126896Listed by: KW GREATER WEST CHESTER $575,000Pending3 beds 3 baths2,118 sq. ft.
923 Shiloh Rd, WEST CHESTER, PA 19382
MLS# PACT2126032Listed by: KW GREATER WEST CHESTER $795,000Pending4 beds 3 baths2,780 sq. ft.
914 Sage Rd, WEST CHESTER, PA 19382
MLS# PACT2126948Listed by: KELLER WILLIAMS REAL ESTATE - WEST CHESTER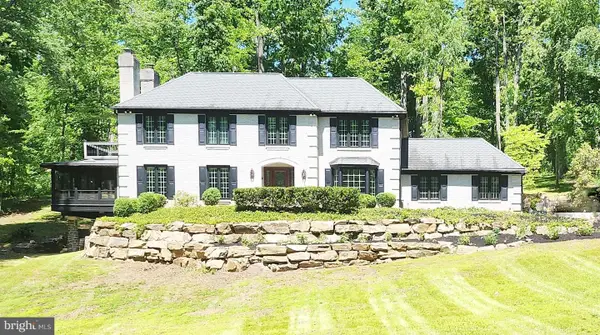 $830,000Pending4 beds 3 baths2,922 sq. ft.
827 Nathan Hale Dr, WEST CHESTER, PA 19382
MLS# PACT2126868Listed by: BHHS FOX & ROACH-KENNETT SQ $850,000Pending4 beds 3 baths2,922 sq. ft.
309 Addison Pl, WEST CHESTER, PA 19382
MLS# PACT2126590Listed by: RE/MAX ACTION ASSOCIATES $629,000Pending4 beds 3 baths1,824 sq. ft.
789 Ware Cir, WEST CHESTER, PA 19382
MLS# PACT2126886Listed by: VRA REALTY $399,000Pending2 beds 3 baths1,944 sq. ft.
115 Spring Ln, WEST CHESTER, PA 19382
MLS# PACT2126576Listed by: LPT REALTY, LLC $1,185,000Pending3 beds 4 baths3,522 sq. ft.
410 S Church St, WEST CHESTER, PA 19382
MLS# PACT2126664Listed by: KW GREATER WEST CHESTER $299,900Pending2 beds 2 baths1,066 sq. ft.
202 Valley Dr #202, WEST CHESTER, PA 19382
MLS# PACT2126718Listed by: BETTER HOMES AND GARDENS REAL ESTATE PHOENIXVILLE $975,000Active4 beds 4 baths5,004 sq. ft.
870 Silverwood Dr, WEST CHESTER, PA 19382
MLS# PACT2126006Listed by: EXP REALTY, LLC $550,000Active3 beds 3 baths2,234 sq. ft.
230 Yorkminster Rd #1403, WEST CHESTER, PA 19382
MLS# PACT2126010Listed by: EXP REALTY, LLC $799,000Pending4 beds 3 baths2,609 sq. ft.
721 Westcroft Pl, WEST CHESTER, PA 19382
MLS# PACT2126608Listed by: RE/MAX TOWN & COUNTRY $875,000Pending4 beds 3 baths2,398 sq. ft.
1191 Shady Grove Way, WEST CHESTER, PA 19382
MLS# PACT2126418Listed by: BHHS FOX & ROACH WAYNE-DEVON $445,000Active3 beds 3 baths1,580 sq. ft.
1616 S Coventry Ln, WEST CHESTER, PA 19382
MLS# PACT2126446Listed by: BHHS FOX & ROACH-CHADDS FORD $675,000Pending3 beds 4 baths3,168 sq. ft.
36 New Countryside Dr, WEST CHESTER, PA 19382
MLS# PACT2125618Listed by: BHHS FOX & ROACH-WEST CHESTER $700,000Pending3 beds 3 baths2,215 sq. ft.
1200 Westtown Thornton Rd, WEST CHESTER, PA 19382
MLS# PACT2126478Listed by: COMPASS PENNSYLVANIA, LLC $635,000Pending3 beds 3 baths2,897 sq. ft.
1 Redtail Ct #102, WEST CHESTER, PA 19382
MLS# PACT2126226Listed by: HYATT REALTY $675,000Pending4 beds 3 baths1,772 sq. ft.
849 Parkside Ave, WEST CHESTER, PA 19382
MLS# PACT2126432Listed by: RE/MAX MAIN LINE-PAOLI- Open Sun, 1 to 3pm
 $399,900Active2 beds 2 baths992 sq. ft.
303 Worington Dr #303, WEST CHESTER, PA 19382
MLS# PACT2126324Listed by: REAL OF PENNSYLVANIA  $300,000Pending2 beds 3 baths1,551 sq. ft.
192 Summit House, WEST CHESTER, PA 19382
MLS# PACT2126100Listed by: KELLER WILLIAMS REAL ESTATE - MEDIA- Open Tue, 5 to 6pm
 $315,000Active3 beds 2 baths1,280 sq. ft.
1518 Manley Rd #b-26, WEST CHESTER, PA 19382
MLS# PACT2125696Listed by: EXP REALTY, LLC  $877,000Pending5 beds 4 baths3,190 sq. ft.
823 Nathan Hale Dr, WEST CHESTER, PA 19382
MLS# PACT2125606Listed by: REAL BROKER, LLC $1,499,000Active5 beds 6 baths6,215 sq. ft.
510 Day Spring Ln, WEST CHESTER, PA 19382
MLS# PACT2120216Listed by: REDFIN CORPORATION $900,000Pending4 beds 2 baths2,850 sq. ft.
25 Oak Tree Hollow Rd #r, WEST CHESTER, PA 19382
MLS# PADE2115012Listed by: COLDWELL BANKER REALTY $624,999Pending4 beds 2 baths1,749 sq. ft.
10 Yorktown Ave, WEST CHESTER, PA 19382
MLS# PACT2125950Listed by: TESLA REALTY GROUP, LLC $699,900Active3 beds 3 baths1,887 sq. ft.
1861 Lenape Rd, WEST CHESTER, PA 19382
MLS# PACT2124846Listed by: RE/MAX INTEGRITY $850,000Pending4 beds 3 baths3,200 sq. ft.
1353 Wooded Knls, WEST CHESTER, PA 19382
MLS# PACT2125996Listed by: EXP REALTY, LLC $895,000Pending4 beds 3 baths2,376 sq. ft.
681 Brintons Bridge Rd, WEST CHESTER, PA 19382
MLS# PACT2125240Listed by: RE/MAX TOWN & COUNTRY $600,000Pending3 beds 3 baths1,988 sq. ft.
1253 Surrey Rd, WEST CHESTER, PA 19382
MLS# PACT2125908Listed by: KELLER WILLIAMS REAL ESTATE -EXTON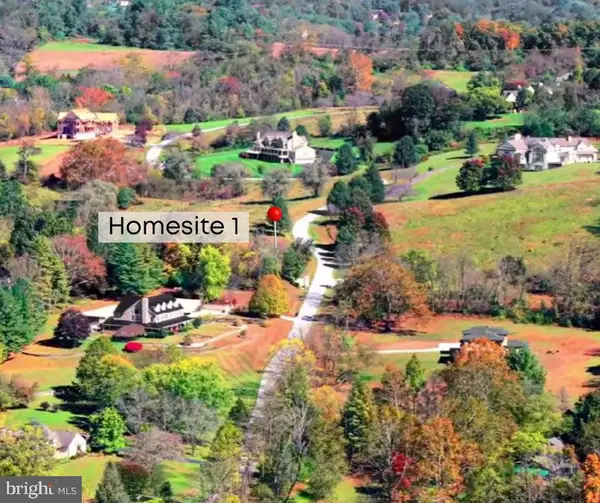 $650,000Active2.3 Acres
1345 Carolannes Way, WEST CHESTER, PA 19382
MLS# PACT2125948Listed by: LPT REALTY, LLC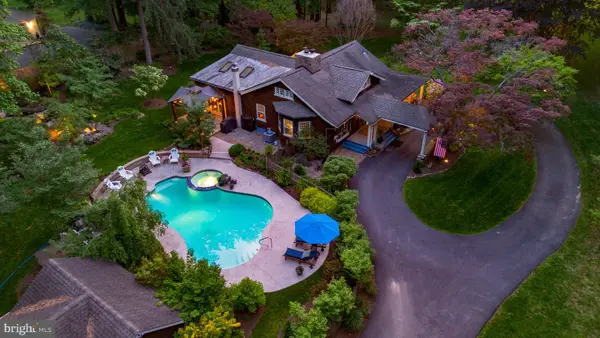 $995,000Active4 beds 2 baths2,720 sq. ft.
314 Oakbourne Rd, WEST CHESTER, PA 19382
MLS# PACT2125390Listed by: KELLER WILLIAMS MAIN LINE $999,000Pending4 beds 4 baths4,286 sq. ft.
28 Cherry Farm Ln, WEST CHESTER, PA 19382
MLS# PADE2113132Listed by: KELLER WILLIAMS REAL ESTATE -EXTON $549,000Pending4 beds 2 baths1,482 sq. ft.
1240 E Strasburg Rd, WEST CHESTER, PA 19380
MLS# PACT2125816Listed by: COLDWELL BANKER REALTY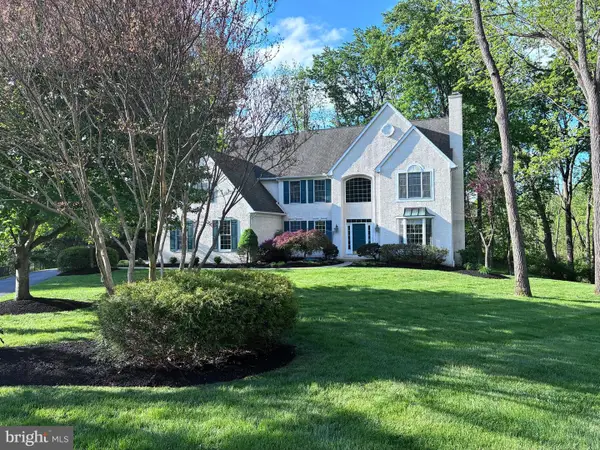 $1,185,000Active4 beds 4 baths3,980 sq. ft.
936 Kilduff Cir, WEST CHESTER, PA 19382
MLS# PACT2123812Listed by: RE/MAX MAIN LINE-WEST CHESTER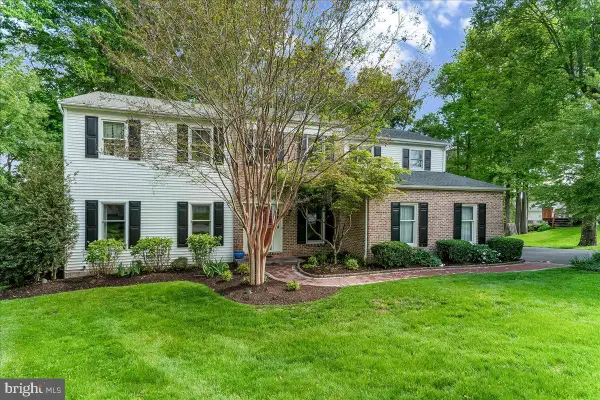 $698,000Active5 beds 3 baths3,978 sq. ft.
3 Ardrossan Ave, WEST CHESTER, PA 19382
MLS# PACT2125740Listed by: HEARTHSTONE HOMETOWN REALTY- Open Thu, 4 to 6pm
 $949,900Active4 beds 4 baths2,400 sq. ft.
734 S Matlack St, WEST CHESTER, PA 19382
MLS# PACT2124768Listed by: KELLER WILLIAMS REAL ESTATE - WEST CHESTER  $950,000Active4 beds 3 baths3,756 sq. ft.
1103 Clover Hill Dr, WEST CHESTER, PA 19382
MLS# PACT2125268Listed by: PRECISION REAL ESTATE INC $485,000Pending2 beds 2 baths1,632 sq. ft.
136 Gilpin Dr #a-307, WEST CHESTER, PA 19382
MLS# PACT2125414Listed by: KELLER WILLIAMS REAL ESTATE - WEST CHESTER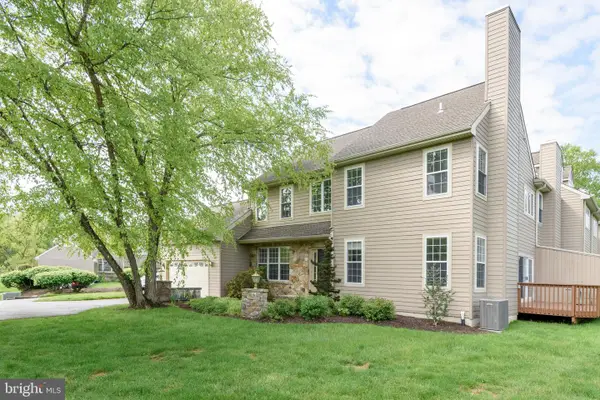 $689,000Pending3 beds 3 baths2,544 sq. ft.
309 Lea Dr, WEST CHESTER, PA 19382
MLS# PACT2121742Listed by: KELLER WILLIAMS REAL ESTATE - WEST CHESTER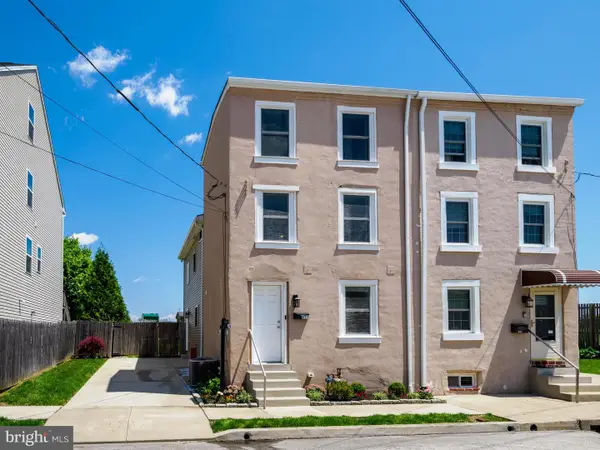 $595,000Active3 beds 3 baths1,728 sq. ft.
335 S Adams St, WEST CHESTER, PA 19382
MLS# PACT2124686Listed by: KW GREATER WEST CHESTER $1,375,000Active7 beds 7 baths6,725 sq. ft.
129 Berwick Dr, WEST CHESTER, PA 19382
MLS# PACT2125144Listed by: KELLER WILLIAMS REAL ESTATE -EXTON $995,000Pending4 beds -- baths3,348 sq. ft.
335 W Miner St, WEST CHESTER, PA 19382
MLS# PACT2125034Listed by: EXP REALTY, LLC $1,264,500Active5 beds 4 baths4,063 sq. ft.
925 Marina Ct, WEST CHESTER, PA 19382
MLS# PACT2124776Listed by: BHHS FOX & ROACH-WEST CHESTER $625,000Pending3 beds 3 baths2,182 sq. ft.
312 Penn Ln, WEST CHESTER, PA 19382
MLS# PACT2118244Listed by: RE/MAX MAIN LINE-WEST CHESTER $775,000Pending4 beds 3 baths2,978 sq. ft.
829 Nathan Hale Dr, WEST CHESTER, PA 19382
MLS# PACT2125006Listed by: BHHS FOX & ROACH WAYNE-DEVON $1,199,900Pending6 beds 5 baths3,020 sq. ft.
340 W Miner St, WEST CHESTER, PA 19382
MLS# PACT2124612Listed by: KW GREATER WEST CHESTER $859,900Active3 beds 3 baths2,172 sq. ft.
623 Mechanics Aly, WEST CHESTER, PA 19382
MLS# PACT2124758Listed by: KELLER WILLIAMS REAL ESTATE - WEST CHESTER $1,750,000Active6 beds 3 baths6,139 sq. ft.
2 Bittersweet Dr, WEST CHESTER, PA 19382
MLS# PACT2124520Listed by: BHHS FOX & ROACH-HAVERFORD $824,900Active4 beds 3 baths2,639 sq. ft.
370 Highland Rd, WEST CHESTER, PA 19382
MLS# PACT2124798Listed by: REAL OF PENNSYLVANIA $2,200,000Active5 beds 5 baths5,200 sq. ft.
1346 Carolannes Way, WEST CHESTER, PA 19382
MLS# PACT2124310Listed by: LPT REALTY, LLC $697,000Pending4 beds 2 baths3,060 sq. ft.
205 Oak Ln, WEST CHESTER, PA 19382
MLS# PACT2124702Listed by: EXP REALTY, LLC $675,000Active4 beds 4 baths2,324 sq. ft.
893 Westtown Rd, WEST CHESTER, PA 19382
MLS# PACT2124746Listed by: ENGEL & VOLKERS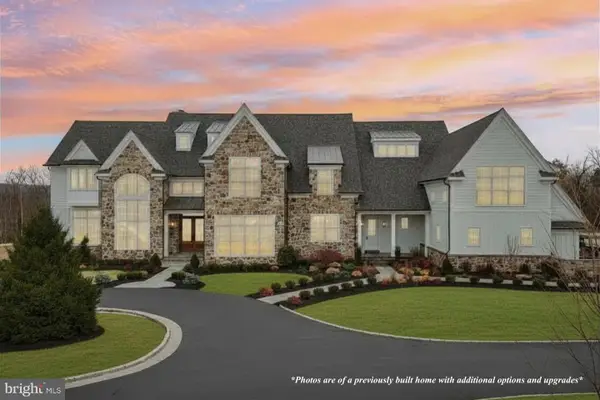 $2,350,000Active5 beds 6 baths5,200 sq. ft.
1345 Carolannes Way, WEST CHESTER, PA 19382
MLS# PACT2124308Listed by: LPT REALTY, LLC $699,000Active4 beds 2 baths2,126 sq. ft.
1325 S New St, WEST CHESTER, PA 19382
MLS# PACT2124154Listed by: LIVE OAKS REALTY, INC. $2,489,000Pending5 beds 5 baths4,986 sq. ft.
414 Birmingham Rd, WEST CHESTER, PA 19382
MLS# PACT2123508Listed by: BHHS FOX & ROACH-WEST CHESTER $500,000Active4 beds 4 baths2,020 sq. ft.
769 Bradford Ter, WEST CHESTER, PA 19382
MLS# PACT2122716Listed by: RE/MAX MAIN LINE-WEST CHESTER $1,200,000Active2 beds 3 baths2,676 sq. ft.
501 Webb Rd, CHADDS FORD, PA 19317
MLS# PACT2123708Listed by: KELLER WILLIAMS REAL ESTATE - MEDIA $529,900Active3 beds 3 baths2,550 sq. ft.
402 Sumner Way, WEST CHESTER, PA 19382
MLS# PACT2123894Listed by: WEICHERT, REALTORS - CORNERSTONE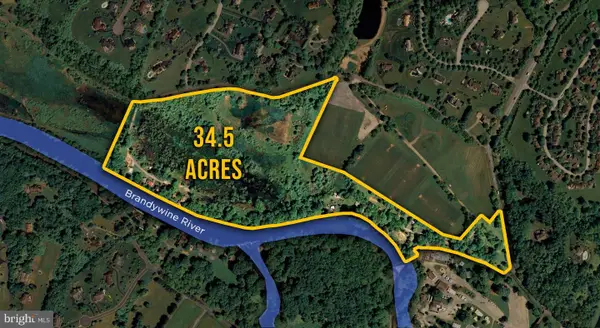 $300,000Active34.5 Acres
500 S Creek Rd, WEST CHESTER, PA 19382
MLS# PACT2123938Listed by: PILLAR REAL ESTATE ADVISORS $1,325,000Pending5 beds 6 baths6,500 sq. ft.
1653 Waterglen Dr, WEST CHESTER, PA 19382
MLS# PACT2123748Listed by: PATTERSON-SCHWARTZ - GREENVILLE $2,500,000Active4 beds 4 baths3,694 sq. ft.
975 Brintons Bridge Rd, WEST CHESTER, PA 19382
MLS# PACT2123756Listed by: PATTERSON-SCHWARTZ - GREENVILLE $869,900Active4 beds 4 baths3,800 sq. ft.
1345 Wooded Knls, WEST CHESTER, PA 19382
MLS# PACT2123624Listed by: KELLER WILLIAMS REAL ESTATE - MEDIA $675,000Pending3 beds 3 baths2,128 sq. ft.
932 Tyson Dr, WEST CHESTER, PA 19382
MLS# PACT2120404Listed by: LPT REALTY, LLC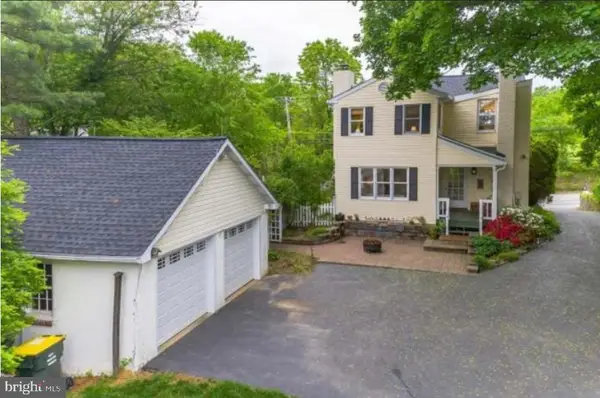 $624,500Pending3 beds 3 baths1,926 sq. ft.
1426 W Strasburg Rd, WEST CHESTER, PA 19382
MLS# PACT2122676Listed by: EXP REALTY, LLC $685,000Pending3 beds 4 baths2,948 sq. ft.
43 Midsummer Dr, WEST CHESTER, PA 19382
MLS# PACT2123394Listed by: BHHS FOX & ROACH-ROSEMONT $430,000Active4 beds 1 baths1,183 sq. ft.
145 E Miner St, WEST CHESTER, PA 19382
MLS# PACT2123158Listed by: KELLER WILLIAMS REAL ESTATE -EXTON $895,000Active6 beds 4 baths4,057 sq. ft.
702 Lenape Rd, WEST CHESTER, PA 19382
MLS# PACT2122990Listed by: KELLER WILLIAMS REAL ESTATE -EXTON $605,000Pending3 beds 2 baths1,910 sq. ft.
1140 Mews Ln #41, WEST CHESTER, PA 19382
MLS# PACT2122380Listed by: BHHS FOX & ROACH-WEST CHESTER $565,000Pending5 beds 2 baths1,976 sq. ft.
138 Magnolia St, WEST CHESTER, PA 19382
MLS# PACT2121902Listed by: KW GREATER WEST CHESTER $1,025,000Pending4 beds 4 baths3,509 sq. ft.
291 Dressage Ct, WEST CHESTER, PA 19382
MLS# PACT2122302Listed by: RE/MAX TOWN & COUNTRY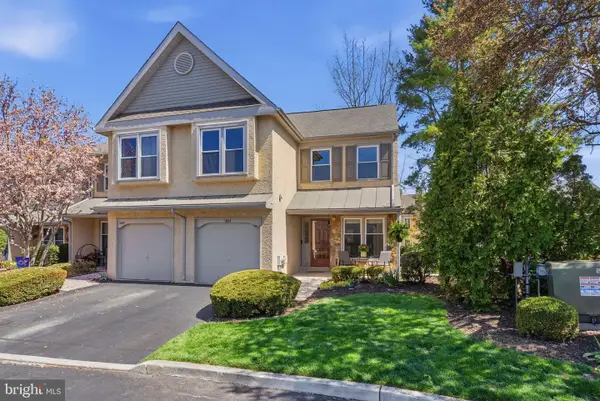 $499,900Pending3 beds 3 baths2,485 sq. ft.
1604 Cotswald Ct #1604, WEST CHESTER, PA 19382
MLS# PACT2122118Listed by: LONG & FOSTER REAL ESTATE, INC. $549,900Pending4 beds 2 baths1,750 sq. ft.
1206 W Chester Pike, WEST CHESTER, PA 19382
MLS# PACT2121838Listed by: COLDWELL BANKER REALTY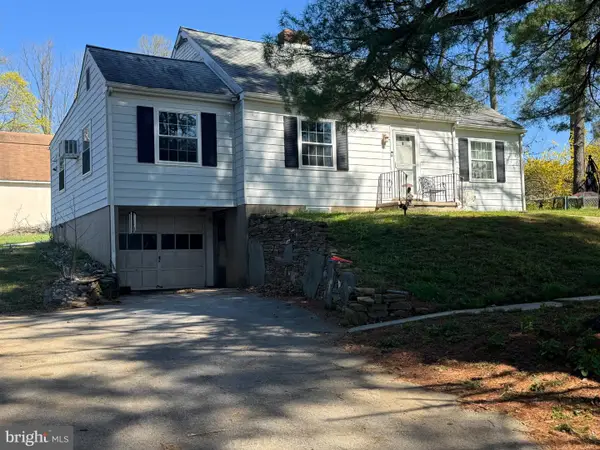 $524,900Pending3 beds 2 baths1,973 sq. ft.
819 W Miner St, WEST CHESTER, PA 19382
MLS# PACT2122010Listed by: VRA REALTY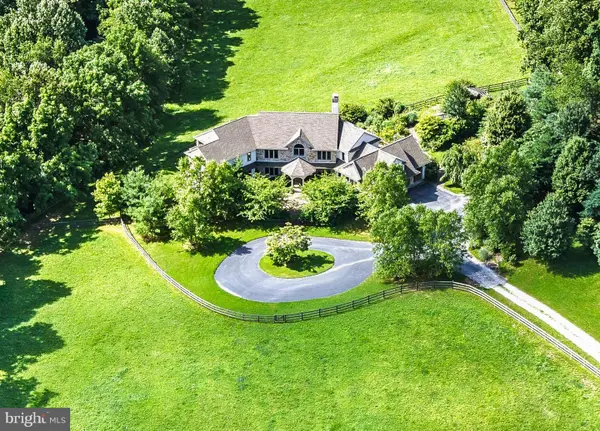 $2,290,000Active5 beds 6 baths7,120 sq. ft.
438 Ground Hog College Rd, WEST CHESTER, PA 19382
MLS# PACT2121918Listed by: BHHS FOX & ROACH-WEST CHESTER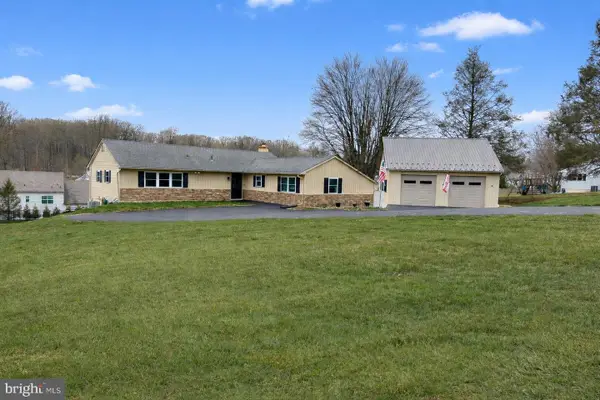 $695,000Pending3 beds 3 baths3,427 sq. ft.
5 Jacqueline Dr, WEST CHESTER, PA 19382
MLS# PACT2121788Listed by: BHHS FOX & ROACH-WEST CHESTER $1,325,000Pending5 beds 4 baths4,899 sq. ft.
2 Limner Ct, WEST CHESTER, PA 19382
MLS# PACT2121482Listed by: COLDWELL BANKER REALTY $3,750,000Active5 beds 5 baths6,692 sq. ft.
1740 Lenape Rd, WEST CHESTER, PA 19382
MLS# PACT2115226Listed by: MONUMENT SOTHEBY'S INTERNATIONAL REALTY $1,012,135Active4 beds 3 baths4,016 sq. ft.
500 Ferguson Preserve Ln #devonshire, GLENMOORE, PA 19343
MLS# PACT2121316Listed by: PATRIOT REALTY, LLC $949,900Pending4 beds 3 baths4,054 sq. ft.
1109 Forsythe Ln, WEST CHESTER, PA 19382
MLS# PACT2121288Listed by: HOWARD HANNA REAL ESTATE SERVICES $2,975,000Active5 beds 5 baths7,248 sq. ft.
7 Bittersweet Dr, WEST CHESTER, PA 19382
MLS# PACT2121270Listed by: BHHS FOX & ROACH-WEST CHESTER $945,000Pending4 beds 3 baths4,605 sq. ft.
204 Four In Hand Ct, WEST CHESTER, PA 19382
MLS# PACT2121060Listed by: WORTHINGTON REAL ESTATE $470,900Active4 beds 2 baths1,258 sq. ft.
1526 Telegraph Rd, WEST CHESTER, PA 19380
MLS# PACT2120992Listed by: EXP REALTY, LLC $1,350,000Pending5 beds 4 baths4,327 sq. ft.
19 Memel Dr, THORNTON, PA 19373
MLS# PADE2110224Listed by: KELLER WILLIAMS REAL ESTATE - WEST CHESTER $1,650,000Pending34.06 Acres
5 Trimbles Ford Lane Ln, WEST CHESTER, PA 19382
MLS# PACT2115914Listed by: REALTY ONE GROUP RESTORE $545,000Active3 beds 3 baths1,934 sq. ft.
1110 Mews Ln, WEST CHESTER, PA 19382
MLS# PACT2118184Listed by: BHHS FOX & ROACH-WEST CHESTER
 $799,990Pending9 beds 11 baths7,371 sq. ft.
301 Westtown Way, WEST CHESTER, PA 19382
MLS# PACT2117884Listed by: CENTURY 21 PREFERRED $300,000Active4 beds 2 baths2,832 sq. ft.
118 Summit House #118, WEST CHESTER, PA 19382
MLS# PACT2117580Listed by: ELFANT WISSAHICKON-MT AIRY $400,000Active1.3 Acres
1438 Williamsburg Dr, WEST CHESTER, PA 19382
MLS# PACT2116178Listed by: RE/MAX MAIN LINE-WEST CHESTER $1,259,990Active4 beds 4 baths4,669 sq. ft.
812 Bunny Ln, WEST CHESTER, PA 19382
MLS# PACT2117198Listed by: PATRIOT REALTY, LLC $425,000Pending4.1 Acres
619 Broad Run Rd, WEST CHESTER, PA 19382
MLS# PACT2115428Listed by: RE/MAX MAIN LINE-WEST CHESTER $550,000Pending1 beds -- baths1,404 sq. ft.
621 Sugars Bridge Rd, WEST CHESTER, PA 19380
MLS# PACT2114742Listed by: KW GREATER WEST CHESTER- Coming Soon
 $2,150,000Coming Soon4 beds 6 baths
Lot #30 Penn Dr, WEST CHESTER, PA 19382
MLS# PACT2114378Listed by: KW GREATER WEST CHESTER  $765,000Pending4 beds 3 baths2,639 sq. ft.
370 Highland Rd, WEST CHESTER, PA 19382
MLS# PACT2113552Listed by: REAL OF PENNSYLVANIA $599,000Active4 beds 3 baths2,248 sq. ft.
852 Cedar Ave, WEST CHESTER, PA 19382
MLS# PACT2113000Listed by: CONTINENTAL REAL ESTATE GROUP $185,000Active1 beds 1 baths974 sq. ft.
573 Summit House, WEST CHESTER, PA 19382
MLS# PACT2111784Listed by: BHHS FOX & ROACH-GREENVILLE $1,950,000Pending5 beds 6 baths9,002 sq. ft.
1342 Carolannes Way, WEST CHESTER, PA 19382
MLS# PACT2103812Listed by: JAMES S. TUPITZA REALTY $3,276,000Active6 beds 8 baths8,785 sq. ft.
1202 Turks Head Ln, WEST CHESTER, PA 19382
MLS# PACT2103516Listed by: PRIME HOME REAL ESTATE, LLC $3,214,200Pending5 beds 6 baths7,297 sq. ft.
34 Oakland Rd #c2, WEST CHESTER, PA 19382
MLS# PADE2088036Listed by: KW GREATER WEST CHESTER $1,842,000Pending5 beds 5 baths4,605 sq. ft.
186 Dilworthtown Rd, WEST CHESTER, PA 19382
MLS# PADE2086054Listed by: WEICHERT, REALTORS - CORNERSTONE $300,000Pending3 beds 1 baths1,016 sq. ft.
305 S Matlack St, WEST CHESTER, PA 19382
MLS# PACT2086690Listed by: KELLER WILLIAMS REAL ESTATE -EXTON $559,000Pending4 beds 3 baths2,248 sq. ft.
852 Cedar Ave, WEST CHESTER, PA 19382
MLS# PACT2075066Listed by: CONTINENTAL REAL ESTATE GROUP $724,000Pending3 beds 3 baths2,692 sq. ft.
41 Midsummer Dr, WEST CHESTER, PA 19382
MLS# PACT2118514Listed by: BHHS FOX & ROACH-CHADDS FORD $1,052,166Active4 beds 3 baths3,646 sq. ft.
700 Shagbark Dr #hawthorne, WEST CHESTER, PA 19382
MLS# PACT2070388Listed by: PATRIOT REALTY, LLC $2,195,000Pending5 beds 2 baths2,520 sq. ft.
1123 S New Street, WEST CHESTER, PA 19382
MLS# PACT2094822Listed by: KURFISS SOTHEBY'S INTERNATIONAL REALTY $1,995,000Pending35.08 Acres
1121 S New Street, WEST CHESTER, PA 19382
MLS# PACT2094820Listed by: KURFISS SOTHEBY'S INTERNATIONAL REALTY $2,700,000Pending4 beds 5 baths3,658 sq. ft.
501 W Street Rd, WEST CHESTER, PA 19382
MLS# PACT2094826Listed by: KURFISS SOTHEBY'S INTERNATIONAL REALTY $550,000Active3.25 Acres
765 Folly Hill Rd, WEST CHESTER, PA 19382
MLS# PACT2047238Listed by: SPRINGER REALTY GROUP $279,000Pending2 Acres
675-lot 2 Brintons Bridge Rd, WEST CHESTER, PA 19382
MLS# PACT2014272Listed by: LEXINGTON REAL ESTATE PARTNERS, LLC
Local realty services provided by:CENTURY 21 The Real Estate Store
Popular searches near 19382
Popular neighborhoods near 19382
- 9th Ward, Wilmington homes for sale
- Brandywine Hills, Wilmington homes for sale
- Brandywine Village, Wilmington homes for sale
- Creekside Village, Marcus Hook homes for sale
- Delaware Avenue, Wilmington homes for sale
- Harlan Park, Wilmington homes for sale
- Little Italy, Wilmington homes for sale
- North Brandywine, Wilmington homes for sale
- Northwest Wilmington, Wilmington homes for sale
- Tattershall, West Chester homes for sale
- The Flats, Wilmington homes for sale
- The Highlands, Wilmington homes for sale
- Tilton Park, Wilmington homes for sale
- Triangle, Wilmington homes for sale
- Trinity Vicinity, Wilmington homes for sale
- Union Park Gardens, Wilmington homes for sale
- Washington Heights, Wilmington homes for sale
- Wawaset, Wilmington homes for sale
- West 28th & 29th Streets, Wilmington homes for sale
- Westside, Wilmington homes for sale
Counties near West Chester, 19382
- Atlantic County homes for sale
- Berks County homes for sale
- Bucks County homes for sale
- Burlington County homes for sale
- Camden County homes for sale
- Cecil County homes for sale
- Chester County homes for sale
- Cumberland County homes for sale
- Delaware County homes for sale
- Gloucester County homes for sale
- Harford County homes for sale
- Kent County homes for sale
- Lancaster County homes for sale
- Lebanon County homes for sale
- Lehigh County homes for sale
- Mercer County homes for sale
- Montgomery County homes for sale
- New Castle County homes for sale
- Philadelphia County homes for sale
- Salem County homes for sale
Protect your home and budget from life's surprises with an Assurant Home Warranty, backed by a partner that supports you through every step of homeownership. Explore Plans.
©2026 Century 21 Real Estate LLC. All rights reserved. CENTURY 21®, the CENTURY 21 Logo and C21® are service marks owned by Century 21 Real Estate LLC. Century 21 Real Estate LLC fully supports the principles of the Fair Housing Act and the Equal Opportunity Act. Each office is independently owned and operated. Listing information is deemed reliable but not guaranteed accurate.