- Anderson homes for sale
- Anderson-Bedias homes for sale
- Beaver Creek homes for sale
- Bryan homes for sale
- Bryan-College Station homes for sale
- College Station homes for sale
- Gay Hill-Independence homes for sale
- Iola homes for sale
- Kurten homes for sale
- Lake Bryan homes for sale
- Lyons homes for sale
- Navasota homes for sale
- Northeast Brazos homes for sale
- Old River homes for sale
- Snook homes for sale
- Somerville homes for sale
- South Brazos homes for sale
- Washington homes for sale
- West Brazos homes for sale
- Wixon Valley homes for sale
77845, TX - homes for sale
300 of 988 results displayed
- New
 $895,000Active4 beds 5 baths3,306 sq. ft.
5491 Millstone Drive, College Station, TX 77845
MLS# 26006891Listed by: RE/MAX 2020 - New
 $592,500Active4 beds 3 baths2,504 sq. ft.
1935 Cottonwood Terrace Court, College Station, TX 77845
MLS# 38933199Listed by: EXECUTIVE TEXAS REALTY - New
 $315,000Active4 beds 3 baths1,665 sq. ft.
15236 Faircrest Drive, College Station, TX 77845
MLS# 45505369Listed by: CENTURY 21 INTEGRA - New
 $299,000Active3 beds 2 baths1,466 sq. ft.
3107 Pleasant Grove Drive, College Station, TX 77845
MLS# 26006970Listed by: KELLER WILLIAMS REALTY BRAZOS VALLEY OFFICE - New
 $724,900Active4 beds 3 baths2,792 sq. ft.
4608 Coral River Road, College Station, TX 77845
MLS# 26006938Listed by: INHABIT REAL ESTATE GROUP - New
 $325,000Active4 beds 5 baths1,808 sq. ft.
1198 Jones Bulter Road #203, College Station, TX 77840
MLS# 32298206Listed by: WENDY CLINE PROPERTIES GROUP - New
 $1,395,000Active4 beds 5 baths5,152 sq. ft.
4558 Hicks Lane, College Station, TX 77845
MLS# 26006963Listed by: RE/MAX 2020 - New
 $398,000Active3 beds 3 baths2,279 sq. ft.
8615 Rosewood Drive, College Station, TX 77845
MLS# 26006937Listed by: CENTRAL POINT REALTY, LLC - New
 $283,770Active3 beds 2 baths1,575 sq. ft.
10613 Knox Landing Drive, Bryan, TX 77845
MLS# 11725307Listed by: DR HORTON, AMERICA'S BUILDER - New
 $305,000Active3 beds 2 baths1,637 sq. ft.
1105 Toledo Bend Drive, College Station, TX 77845
MLS# 26006925Listed by: SIMPLICITY REALTY, INC. - New$269,000Active2 beds 2 baths1,178 sq. ft.
3310 General Parkway, College Station, TX 77845
MLS# 16192233Listed by: REAL BROKER, LLC - Open Sat, 1 to 3pmNew
 $375,000Active4 beds 3 baths2,317 sq. ft.
809 Emerald Dove Avenue, College Station, TX 77845
MLS# 60383571Listed by: WALSH & MANGAN PREMIER RE GROUP - New
 $476,900Active4 beds 4 baths2,693 sq. ft.
4110 Snapdragon Lane, Bryan, TX 77845
MLS# 26006930Listed by: STYLECRAFT BROKERAGE, LLC - New
 $403,900Active4 beds 3 baths2,103 sq. ft.
5006 Acadia Loop, Bryan, TX 77845
MLS# 26006931Listed by: STYLECRAFT BROKERAGE, LLC - New
 $396,900Active3 beds 2 baths1,895 sq. ft.
4105 Snapdragon Lane, Bryan, TX 77845
MLS# 26006934Listed by: STYLECRAFT BROKERAGE, LLC - New
 $499,999Active5 beds 4 baths2,672 sq. ft.
1203 Beacon Court, College Station, TX 77845
MLS# 69821839Listed by: KNOX REALTY ADVISORS - New
 $405,000Active4 beds 2 baths2,051 sq. ft.
2504 Kinnersley Lane, College Station, TX 77845
MLS# 26006926Listed by: KELLER WILLIAMS REALTY BRAZOS VALLEY OFFICE - New
 $299,330Active4 beds 2 baths1,797 sq. ft.
10628 Knox Landing Drive, Bryan, TX 77845
MLS# 88240161Listed by: DR HORTON, AMERICA'S BUILDER - New
 $384,900Active4 beds 3 baths2,092 sq. ft.
4803 Underbrush Crossing, Bryan, TX 77845
MLS# 26006903Listed by: STYLECRAFT BROKERAGE, LLC - New
 $294,830Active4 beds 2 baths1,665 sq. ft.
10634 Knox Landing Drive, Bryan, TX 77845
MLS# 26006907Listed by: D.R. HORTON, AMERICA'S BUILDER - New
 $304,900Active4 beds 2 baths1,721 sq. ft.
15111 Faircrest Drive, College Station, TX 77845
MLS# 26006882Listed by: PINNACLE REALTY ADVISORS - New
 $622,900Active4 beds 4 baths2,571 sq. ft.
4620 Coral River Road, College Station, TX 77845
MLS# 26006893Listed by: LLANO RIVER REALTY LLC - New
 $350,000Active3 beds 3 baths1,882 sq. ft.
4307 Spring Hill Drive, College Station, TX 77845
MLS# 26006899Listed by: TEXAS PRIME REAL ESTATE - New
 $322,800Active3 beds 2 baths1,908 sq. ft.
1051 Toledo Bend Drive, College Station, TX 77845
MLS# 51542436Listed by: LONGITUDE REAL ESTATE - New
 $307,068Active3 beds 3 baths1,700 sq. ft.
1165 Toledo Bend Drive, College Station, TX 77845
MLS# 22932274Listed by: DR HORTON, AMERICA'S BUILDER - New
 $1,620,000Active4 beds 4 baths
417, 419, 421 & 3009 Hayes, Papa Bear, College Station, TX 77845
MLS# 35514742Listed by: THE ARENA GROUP  $995,000Pending4 beds 3 baths3,631 sq. ft.
17599 Indian Lakes Drive, College Station, TX 77845
MLS# 47362701Listed by: THE HUDSON TEAM- New
 $325,000Active3 beds 3 baths
1451 Buena Vista, College Station, TX 77845
MLS# 55182178Listed by: MOXIE TEXAS REAL ESTATE - New
 $474,900Active4 beds 3 baths2,465 sq. ft.
4410 Spring Meadows Drive, College Station, TX 77845
MLS# 59709952Listed by: RE/MAX 20/20 - New
 $899,999Active4 beds 5 baths
4902 Pearl River Court, College Station, TX 77845
MLS# 63225408Listed by: LONGITUDE REAL ESTATE - New
 $205,000Active3 beds 3 baths1,590 sq. ft.
2400 Longmire Drive #105, College Station, TX 77845
MLS# 6345023Listed by: THE HUDSON TEAM - New
 $849,900Active3 beds 3 baths2,329 sq. ft.
5559 Blue Ridge Drive, College Station, TX 77845
MLS# 70506562Listed by: SHERLOCK-REALTORS  $244,900Pending1.09 Acres
5347 Legend Oaks Court, College Station, TX 77845
MLS# 76441567Listed by: REAL BROKER, LLC $335,000Pending3 beds 2 baths1,704 sq. ft.
3801 Snowdance Court, College Station, TX 77845
MLS# 82746123Listed by: REAL BROKER, LLC- New
 $289,000Active4 beds 2 baths1,703 sq. ft.
15104 Meredith Lane, College Station, TX 77845
MLS# 87320818Listed by: NICHE PROPERTIES - New
 $319,900Active3 beds 2 baths1,589 sq. ft.
4161 Shallow Creek Loop, College Station, TX 77845
MLS# 26006328Listed by: NEXTHOME REALTY SOLUTIONS BCS - New
 $272,000Active3 beds 2 baths1,496 sq. ft.
2809 Rayado Court N, College Station, TX 77845
MLS# 26006748Listed by: LONGITUDE REAL ESTATE - New
 $975,000Active4 beds 4 baths3,742 sq. ft.
4425 Williams Lake Drive, College Station, TX 77845
MLS# 26006768Listed by: LONGITUDE REAL ESTATE - Open Sun, 11am to 1pmNew
 $320,000Active4 beds 4 baths1,618 sq. ft.
3337 Lieutenant Avenue, College Station, TX 77845
MLS# 26006863Listed by: JLA REALTY - New
 $725,000Active4 beds 4 baths2,710 sq. ft.
4743 Coral River Road, College Station, TX 77845
MLS# 10148504Listed by: SOUTHERN DISTRICT SOTHEBY'S INTERNATIONAL REALTY - New
 $175,000Active1.59 Acres
10716 Cook Crossing, College Station, TX 77845
MLS# 11599928Listed by: SOUTHERN DISTRICT SOTHEBY'S INTERNATIONAL REALTY - New
 $908,100Active4 beds 4 baths3,027 sq. ft.
5403 Woodland Park Drive, College Station, TX 77845
MLS# 14840086Listed by: BERKSHIRE HATHAWAY HOME SERVICES CALIBER REALTY - New
 $165,000Active1.23 Acres
10708 Cook Crossing, College Station, TX 77845
MLS# 27461139Listed by: SOUTHERN DISTRICT SOTHEBY'S INTERNATIONAL REALTY - New
 $289,900Active3 beds 2 baths1,508 sq. ft.
4451 Wisenbaker Way, Bryan, TX 77801
MLS# 30223585Listed by: CENTURY COMMUNITIES - New
 $335,900Active4 beds 3 baths2,003 sq. ft.
10706 Aston Court, Bryan, TX 77801
MLS# 34229222Listed by: CENTURY COMMUNITIES - New
 $269,500Active3 beds 2 baths1,379 sq. ft.
3907 Bridgeberry Court, College Station, TX 77845
MLS# 46780357Listed by: STANDLEY REAL ESTATE COMPANY, LLC  $310,498Pending3 beds 3 baths1,700 sq. ft.
1156 Toledo Bend Drive, College Station, TX 77845
MLS# 51775373Listed by: DR HORTON, AMERICA'S BUILDER- New
 $330,900Active4 beds 3 baths2,012 sq. ft.
4468 Wisenbaker Way, Bryan, TX 77801
MLS# 52139489Listed by: CENTURY COMMUNITIES - New
 $335,900Active4 beds 3 baths2,120 sq. ft.
4471 Wisenbaker Way, Bryan, TX 77801
MLS# 56535380Listed by: CENTURY COMMUNITIES - New
 $155,000Active1.08 Acres
10700 Cook Crossing, College Station, TX 77845
MLS# 57943066Listed by: SOUTHERN DISTRICT SOTHEBY'S INTERNATIONAL REALTY - New
 $155,000Active1.18 Acres
10705 Cook Crossing, College Station, TX 77845
MLS# 75652160Listed by: SOUTHERN DISTRICT SOTHEBY'S INTERNATIONAL REALTY - New
 $285,000Active4 beds 2 baths1,527 sq. ft.
15474 Baker Meadow Loop, College Station, TX 77845
MLS# 76158859Listed by: REAL BROKER, LLC - New
 $307,000Active4 beds 4 baths1,782 sq. ft.
4124 Mcfarland Drive, College Station, TX 77845
MLS# 77179524Listed by: ZWEIACKER & ASSOCIATES - New
 $174,900Active2 beds 2 baths1,106 sq. ft.
1406 Summit Street #D, College Station, TX 77845
MLS# 78476702Listed by: REAL BROKER, LLC - New
 $920,000Active4 beds 4 baths2,990 sq. ft.
5439 Woodland Park Drive, College Station, TX 77845
MLS# 87637857Listed by: BERKSHIRE HATHAWAY HOME SERVICES CALIBER REALTY - New
 $165,000Active1.11 Acres
10704 Cook Crossing, College Station, TX 77845
MLS# 92615742Listed by: SOUTHERN DISTRICT SOTHEBY'S INTERNATIONAL REALTY - New
 $2,500,000Active5 beds 7 baths5,006 sq. ft.
6740 Koppe Bridge Road, College Station, TX 77845
MLS# 92887959Listed by: CB&A, REALTORS - New
 $3,299,000Active6 beds 7 baths6,498 sq. ft.
1851 Deer Park Drive, College Station, TX 77845
MLS# 10035875Listed by: LEGEND TEXAS PROPERTIES - New
 $725,000Active3 beds 3 baths2,691 sq. ft.
5680 Pratt Road, College Station, TX 77845
MLS# 2301543Listed by: COLDWELL BANKER APEX, REALTORS LLC - New
 $711,525Active4 beds 4 baths2,688 sq. ft.
4508 Legendary Drive, College Station, TX 77845
MLS# 47375068Listed by: REALTY ONE GROUP AMPLIFIED - New
 $279,900Active3 beds 3 baths1,408 sq. ft.
702 Granger Lane, College Station, TX 77845
MLS# 65119417Listed by: RIVERBEND REALTY GROUP, LLC - New
 $419,990Active4 beds 4 baths2,858 sq. ft.
6211 Eldora Drive, College Station, TX 77845
MLS# 67273411Listed by: BRIGHTLAND HOMES BROKERAGE - New
 $657,000Active4 beds 4 baths2,710 sq. ft.
810 Plum Hollow Drive, College Station, TX 77845
MLS# 67669011Listed by: 5TH STREAM REALTY - New
 $383,990Active4 beds 3 baths2,473 sq. ft.
6228 Greenville Drive, College Station, TX 77845
MLS# 69393493Listed by: BRIGHTLAND HOMES BROKERAGE - New
 $295,000Active3 beds 2 baths1,353 sq. ft.
7716 Appomattox Drive, College Station, TX 77845
MLS# 76166467Listed by: DOUGLAS ELLIMAN REAL ESTATE - New
 $249,900Active2 beds 3 baths1,289 sq. ft.
3929 Yukon Lane, College Station, TX 77845
MLS# 81597331Listed by: NEXTHOME REALTY SOLUTIONS BCS - New
 $369,900Active4 beds 3 baths1,956 sq. ft.
4203 Cedar Creek Court, College Station, TX 77845
MLS# 85115841Listed by: LALLI PROPERTIES - New
 $449,900Active3 beds 2 baths1,839 sq. ft.
10462 Woodview Drive, Bryan, TX 77845
MLS# 10757099Listed by: AGGIELAND PROPERTIES - New
 $675,000Active4 beds 4 baths2,582 sq. ft.
4809 White Ash Court, College Station, TX 77845
MLS# 10808019Listed by: THE HUDSON TEAM - New
 $805,000Active3 beds 4 baths2,804 sq. ft.
10701 Harvey Ranch Road, College Station, TX 77845
MLS# 40805959Listed by: WALSH & MANGAN PREMIER RE GROUP - New
 $615,900Active4 beds 3 baths2,630 sq. ft.
1748 Kerr Valley Lane, College Station, TX 77845
MLS# 42755608Listed by: LONGITUDE REAL ESTATE - New
 $675,000Active3 beds 4 baths3,429 sq. ft.
2307 Scotney Court, College Station, TX 77845
MLS# 44875934Listed by: WALSH & MANGAN PREMIER RE GROUP - New
 $324,000Active3 beds 2 baths1,654 sq. ft.
3865 Still Creek Loop, College Station, TX 77845
MLS# 67907828Listed by: NEXTHOME REALTY SOLUTIONS BCS - New
 $325,000Active3 beds 2 baths1,551 sq. ft.
6357 Darlington Avenue, College Station, TX 77845
MLS# 98868755Listed by: HOMETOWN REAL ESTATE GROUP - New
 $254,900Active3 beds 2 baths1,334 sq. ft.
3013 Adrienne Drive, College Station, TX 77845
MLS# 26006837Listed by: NEXTHOME REALTY SOLUTIONS BCS - New
 $269,900Active3 beds 3 baths1,463 sq. ft.
3903 W.s. Phillips Parkway, College Station, TX 77845
MLS# 26006734Listed by: BHHS CALIBER REALTY - New
 $499,900Active4 beds 3 baths1,904 sq. ft.
2009 Quail Run, College Station, TX 77845
MLS# 26006851Listed by: CENTURY 21 INTEGRA - New
 $450,000Active4 beds 3 baths1,833 sq. ft.
5943 Eldora Drive, College Station, TX 77845
MLS# 26006646Listed by: LONGITUDE REAL ESTATE - New
 $949,900Active5 beds 5 baths3,828 sq. ft.
1704 Kerr Valley Lane, College Station, TX 77845
MLS# 26006795Listed by: REAL BROKER, LLC - New
 $455,000Active4 beds 3 baths2,324 sq. ft.
2401 Newark Circle, College Station, TX 77845
MLS# 26006815Listed by: NEXTHOME REALTY SOLUTIONS BCS - New
 $300,000Active3 beds 2 baths1,314 sq. ft.
4011 Windswept Drive, College Station, TX 77845
MLS# 26006825Listed by: KELLER WILLIAMS REALTY BRAZOS VALLEY OFFICE - New
 $362,900Active4 beds 4 baths1,981 sq. ft.
4313 Commando Trail, College Station, TX 77845
MLS# 26006799Listed by: THE ARENA GROUP - New
 $1,050,000Active4 beds 5 baths3,512 sq. ft.
4617 Sawgrass Drive, College Station, TX 77845
MLS# 26006769Listed by: REAL BROKER, LLC - New
 $349,900Active4 beds 2 baths2,033 sq. ft.
1208 Portsmouth Court, College Station, TX 77845
MLS# 26006804Listed by: NEXTHOME REALTY SOLUTIONS BCS - New
 $1,620,000Active-- beds -- baths1,858 sq. ft.
417, 419, 421 & 3009 Hayes & Papa Bear, College Station, TX 77845
MLS# 26006818Listed by: THE ARENA GROUP - New
 $409,900Active3 beds 2 baths1,787 sq. ft.
4001 Noirmont Court, College Station, TX 77845
MLS# 26006643Listed by: ENGEL & VOELKERS B/CS - New
 $424,999Active4 beds 3 baths2,136 sq. ft.
4022 Brownway Drive, College Station, TX 77845
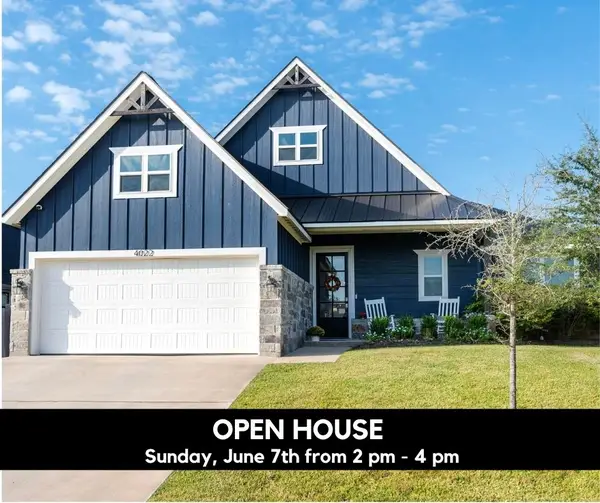
MLS# 26006721Listed by: AGGIELAND - Open Sun, 2 to 4pmNew
 $1,150,000Active4 beds 4 baths3,600 sq. ft.
2324 Storyteller Court, College Station, TX 77845
MLS# 26006801Listed by: REALTY ONE GROUP AMPLIFIED - New
 $307,068Active3 beds 2 baths1,700 sq. ft.
1165 Toledo Bend Drive, College Station, TX 77845
MLS# 26006802Listed by: D.R. HORTON, AMERICA'S BUILDER - New
 $317,500Active3 beds 3 baths1,339 sq. ft.
3801 Harvey Road, College Station, TX 77845
MLS# 26006776Listed by: COLDWELL BANKER APEX, REALTORS - New
 $425,000Active4 beds 2 baths2,005 sq. ft.
15603 Long Creek Lane, College Station, TX 77845
MLS# 26006420Listed by: ENGEL & VOELKERS B/CS - New
 $205,000Active3 beds 3 baths1,590 sq. ft.
2400 Longmire Drive #105, College Station, TX 77845
MLS# 26006689Listed by: HUDSON TEAM, THE - New
 $360,000Active4 beds 2 baths1,885 sq. ft.
3925 Hawk Owl Cove, College Station, TX 77845
MLS# 26006728Listed by: KELLER WILLIAMS REALTY - New
 $269,500Active3 beds 2 baths1,379 sq. ft.
3907 Bridgeberry Court, College Station, TX 77845
MLS# 26006781Listed by: STANDLEY REAL ESTATE COMPANY, LLC - New
 $341,900Active4 beds 3 baths2,012 sq. ft.
4460 Wisenbaker Way, Bryan, TX 77801
MLS# 26006081Listed by: CENTURY COMMUNITIES - New
 $425,000Active2 beds 2 baths1,945 sq. ft.
5014 Spearman Drive, College Station, TX 77845
MLS# 26006573Listed by: MILES OF GRACE REALTY LLC - New
 $335,900Active3 beds 3 baths2,003 sq. ft.
10706 Aston Court, Bryan, TX 77801
MLS# 26006774Listed by: CENTURY COMMUNITIES - New
 $725,000Active4 beds 4 baths2,710 sq. ft.
4743 Coral River Road, College Station, TX 77845
MLS# 26006039Listed by: SOUTHERN DISTRICT SIR - CS - New
 $399,999Active2.39 Acres
13155 S Dowling Road, College Station, TX 77845
MLS# 26006632Listed by: RE/MAX 2020 - New
 $498,000Active3 beds 2 baths1,601 sq. ft.
1811 Harris Drive, College Station, TX 77845
MLS# 26006749Listed by: ADAM DEVELOPMENT PROPERTIES - New
 $570,000Active4 beds 3 baths2,745 sq. ft.
708 Putter Court, College Station, TX 77845
MLS# 26006713Listed by: LONGITUDE REAL ESTATE - New
 $669,000Active3 beds 2 baths2,212 sq. ft.
4936 Dandelion Court, College Station, TX 77845
MLS# 26006735Listed by: OLDHAM GOODWIN GROUP, LLC - New
 $369,000Active3 beds 3 baths2,010 sq. ft.
1722 Creekside, College Station, TX 77845-4088
MLS# 26006744Listed by: WALSH &MANGAN PREMIER RE GROUP - New
 $2,500,000Active5 beds 7 baths5,006 sq. ft.
6740 Koppe Bridge Road, College Station, TX 77845
MLS# 26006715Listed by: CB&A, REALTORS  $310,498Pending3 beds 3 baths1,700 sq. ft.
1156 Toledo Bend Drive, College Station, TX 77845
MLS# 26006724Listed by: D.R. HORTON, AMERICA'S BUILDER- New
 $775,000Active5 beds 5 baths3,274 sq. ft.
4277 Padova Circle, College Station, TX 77845
MLS# 26006494Listed by: WALSH &MANGAN PREMIER RE GROUP - New
 $289,900Active3 beds 2 baths1,508 sq. ft.
4451 Wisenbaker Way, Bryan, TX 77801
MLS# 26006691Listed by: CENTURY COMMUNITIES - New
 $330,900Active4 beds 3 baths2,012 sq. ft.
4468 Wisenbaker Way, Bryan, TX 77801
MLS# 26006692Listed by: CENTURY COMMUNITIES - New
 $295,000Active3 beds 2 baths1,353 sq. ft.
7716 Appomattox Drive, College Station, TX 77845
MLS# 26006698Listed by: DOUGLAS ELLIMAN REAL ESTATE - New
 $750,000Active4 beds 3 baths3,198 sq. ft.
4018 Arboleda Drive, College Station, TX 77845
MLS# 26006702Listed by: RISING R DREAM PROPERTIES, LLC - New
 $277,000Active3 beds 2 baths1,298 sq. ft.
15416 Baker Meadow Loop, College Station, TX 77845
MLS# 26006684Listed by: CENTURY 21 INTEGRA - New
 $365,000Active3 beds 2 baths1,995 sq. ft.
2504 Raintree Drive, College Station, TX 77845
MLS# 26006639Listed by: COLDWELL BANKER APEX, REALTORS - New
 $1,585,000Active4.4 Acres
11203 State Highway 30, College Station, TX 77845
MLS# 26006670Listed by: LONGITUDE REAL ESTATE - New
 $324,900Active3 beds 2 baths1,613 sq. ft.
1221 Verona Drive, College Station, TX 77845
MLS# 26006674Listed by: STYLECRAFT BROKERAGE, LLC  $450,000Pending2 beds 2 baths2,043 sq. ft.
4728 Stonebriar Circle, College Station, TX 77845
MLS# 26006598Listed by: COLDWELL BANKER APEX, REALTORS- New
 $250,000Active2 beds 3 baths1,296 sq. ft.
1610 Ethic Lane, College Station, TX 77845
MLS# 26006642Listed by: NEXTHOME REALTY SOLUTIONS BCS - New
 $155,000Active1.18 Acres
10705 Cook Crossing, College Station, TX 77845
MLS# 26006411Listed by: SOUTHERN DISTRICT SIR - CS - New
 $175,000Active1.59 Acres
10716 Cook Crossing, College Station, TX 77845
MLS# 26006451Listed by: SOUTHERN DISTRICT SIR - CS - New
 $165,000Active1.23 Acres
10708 Cook Crossing, College Station, TX 77845
MLS# 26006454Listed by: SOUTHERN DISTRICT SIR - CS - New
 $165,000Active1.11 Acres
10704 Cook Crossing, College Station, TX 77845
MLS# 26006456Listed by: SOUTHERN DISTRICT SIR - CS - New
 $155,000Active1.08 Acres
10700 Cook Crossing, College Station, TX 77845
MLS# 26006459Listed by: SOUTHERN DISTRICT SIR - CS - New
 $378,000Active3 beds 2 baths1,951 sq. ft.
205 Meir Lane, College Station, TX 77845
MLS# 26006622Listed by: AGGIELAND APARTMENT FINDERS - New
 $824,900Active4 beds 5 baths4,220 sq. ft.
4401 Odell Lane, College Station, TX 77845
MLS# 26006599Listed by: BHHS CALIBER REALTY - New
 $639,750Active2 beds 2 baths2,150 sq. ft.
4060 Lakeside Club Drive, College Station, TX 77845
MLS# 26006603Listed by: KEPT PROPERTY GROUP, LLC - New
 $599,500Active2 beds 2 baths1,878 sq. ft.
4052 Lakeside Club Drive, College Station, TX 77845
MLS# 26006600Listed by: KEPT PROPERTY GROUP, LLC - New
 $749,950Active3 beds 3 baths2,612 sq. ft.
4064 Lakeside Club Drive, College Station, TX 77845
MLS# 26006601Listed by: KEPT PROPERTY GROUP, LLC - New
 $629,750Active3 beds 3 baths2,138 sq. ft.
4056 Lakeside Club Drive, College Station, TX 77845
MLS# 26006602Listed by: KEPT PROPERTY GROUP, LLC - New
 $310,000Active3 beds 2 baths1,599 sq. ft.
1710 Lonetree Drive, College Station, TX 77845
MLS# 26004784Listed by: TOWN & COUNTRY REALTY - Open Sun, 12 to 2pmNew
 $1,250,000Active5 beds 5 baths3,761 sq. ft.
2118 Joe Will Drive, College Station, TX 77845
MLS# 26006589Listed by: CENTURY 21 INTEGRA - New
 $169,000Active2 beds 2 baths1,088 sq. ft.
1400 Summit Street #C, College Station, TX 77845
MLS# 26006580Listed by: RE/MAX 2020 - New
 $307,000Active4 beds 4 baths1,782 sq. ft.
4124 Mcfarland Dr, College Station, TX 77845
MLS# 6799411Listed by: ZWEIACKER & ASSOCIATES - New
 $459,000Active3 beds 3 baths2,308 sq. ft.
4420 Edinburgh Place, College Station, TX 77845
MLS# 26006546Listed by: COMPASS RE TEXAS, LLC. - New
 $599,900Active4 beds 3 baths2,048 sq. ft.
5012 Hickory Lane, College Station, TX 77845
MLS# 26006566Listed by: TREEHOUSE REAL ESTATE - New
 $395,000Active4 beds 3 baths2,269 sq. ft.
3715 Bridle Court, College Station, TX 77845
MLS# 26006544Listed by: NEXTHOME REALTY SOLUTIONS BCS - New
 $649,900Active4 beds 3 baths2,260 sq. ft.
17295 Saddle Creek Drive, College Station, TX 77845
MLS# 26006462Listed by: RE/MAX 2020 - New
 $889,900Active5 beds 4 baths3,375 sq. ft.
5529 Woodland Park Drive, College Station, TX 77845
MLS# 26006542Listed by: BROOKHAVEN REALTY - New
 $869,900Active5 beds 4 baths3,411 sq. ft.
13291 Hopes Creek Road, College Station, TX 77845
MLS# 26006543Listed by: BROOKHAVEN REALTY - New
 $299,500Active4 beds 3 baths1,462 sq. ft.
2441 Pintail Loop, College Station, TX 77845
MLS# 26006468Listed by: KNOX REALTY ADVISORS, LLC - New
 $197,000Active2 beds 2 baths1,088 sq. ft.
1403 Airline Drive #A, College Station, TX 77845
MLS# 26006473Listed by: BELL PROPERTIES - New
 $369,900Active4 beds 3 baths1,956 sq. ft.
4203 Cedar Creek Court, College Station, TX 77845
MLS# 26006533Listed by: LALLI PROPERTIES - New
 $495,900Active4 beds 3 baths2,350 sq. ft.
2314 Agarita Court, College Station, TX 77845
MLS# 26005580Listed by: ENGEL & VOELKERS B/CS - New
 $475,000Active3 beds 2 baths2,085 sq. ft.
3719 Panola Park Drive, College Station, TX 77845
MLS# 26005581Listed by: ENGEL & VOELKERS B/CS - New
 $473,000Active4 beds 3 baths1,973 sq. ft.
3709 Lamar Hollow Court, College Station, TX 77845
MLS# 26005582Listed by: ENGEL & VOELKERS B/CS - New
 $329,900Active4 beds 4 baths1,748 sq. ft.
405 Momma Bear Dr, College Station, TX 77845
MLS# 6719837Listed by: STEPSTONE REALTY LLC - New
 $925,000Active4 beds 4 baths2,994 sq. ft.
4616 Sawgrass Drive, College Station, TX 77845
MLS# 26006482Listed by: WALSH &MANGAN PREMIER RE GROUP - New
 $589,000Active4 beds 3 baths2,846 sq. ft.
1207 Windrift Cove, College Station, TX 77845
MLS# 26006504Listed by: ALL CITY REAL ESTATE LTD. CO  $355,000Active3 beds 2 baths1,962 sq. ft.
955 Toledo Bend Drive, College Station, TX 77845
MLS# 26005144Listed by: CENTURY 21 INTEGRA $288,000Active3 beds 3 baths1,271 sq. ft.
3312 Lieutenant Avenue, College Station, TX 77845
MLS# 26006517Listed by: KELLER WILLIAMS REALTY BRAZOS VALLEY OFFICE $321,000Active4 beds 3 baths1,797 sq. ft.
4102 Whispering Creek Drive, College Station, TX 77845
MLS# 26006298Listed by: INHABIT REAL ESTATE GROUP $665,000Active4 beds 3 baths2,504 sq. ft.
4712 Coral River Road, College Station, TX 77845
MLS# 26006506Listed by: BHHS CALIBER REALTY $325,000Active3 beds 3 baths1,646 sq. ft.
1451 Buena Vista, College Station, TX 77845
MLS# 26006386Listed by: MOXIE TEXAS REAL ESTATE $900,000Active4 beds 4 baths3,348 sq. ft.
4755 Johnson Creek Loop, College Station, TX 77845
MLS# 26006370Listed by: HUDSON TEAM, THE $684,484Pending4 beds 4 baths3,490 sq. ft.
2917 Camille Drive, College Station, TX 77845
MLS# 26006403Listed by: WALSH &MANGAN PREMIER RE GROUP $779,900Pending4 beds 4 baths4,101 sq. ft.
1200 Royal Adelade Drive, College Station, TX 77845
MLS# 26005881Listed by: BRICK + PARCEL REAL ESTATE GROUP $460,000Active4 beds 3 baths2,226 sq. ft.
4025 Crestmont Drive, College Station, TX 77845-2073
MLS# 26006479Listed by: FLY THE COOP REALTY GROUP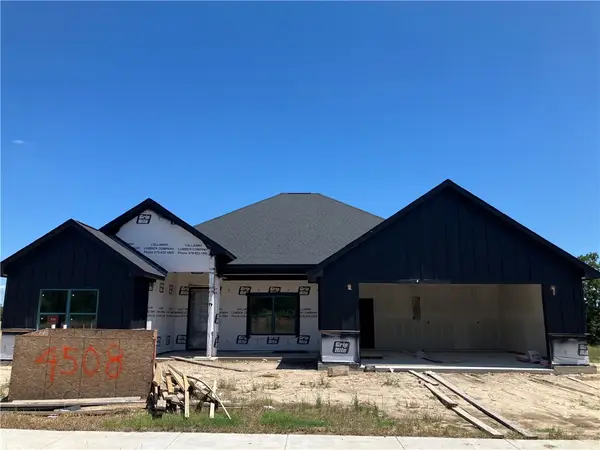 $711,525Active4 beds 4 baths2,688 sq. ft.
4508 Legendary Drive, College Station, TX 77845
MLS# 26006475Listed by: REALTY ONE GROUP AMPLIFIED $360,000Active4 beds 4 baths1,760 sq. ft.
3370 Keefer Loop, College Station, TX 77845
MLS# 26006466Listed by: JOHN PARKER, BROKER $360,000Active4 beds 4 baths1,762 sq. ft.
3372 Keefer Loop, College Station, TX 77845
MLS# 26006467Listed by: JOHN PARKER, BROKER $339,000Active3 beds 2 baths1,777 sq. ft.
712 Aster Drive, College Station, TX 77845
MLS# 26006418Listed by: COLDWELL BANKER APEX, REALTORS $360,000Active4 beds 4 baths1,779 sq. ft.
3362 Keefer Loop, College Station, TX 77845
MLS# 26006452Listed by: JOHN PARKER, BROKER $360,000Active4 beds 4 baths1,782 sq. ft.
3364 Keefer Loop, College Station, TX 77845
MLS# 26006455Listed by: JOHN PARKER, BROKER $199,000Active1 Acres
5320 Straub Road, College Station, TX 77845
MLS# 26006399Listed by: MASON SCHIEFFER, BROKER $250,000Active1.04 Acres
5320 Straub Road, College Station, TX 77845
MLS# 26006400Listed by: MASON SCHIEFFER, BROKER $319,900Pending3 beds 2 baths1,544 sq. ft.
2305 Kendal Green Circle, College Station, TX 77845
MLS# 26006407Listed by: KELLER WILLIAMS REALTY BRAZOS VALLEY OFFICE $360,000Active4 beds 4 baths1,760 sq. ft.
3351 Keefer Loop, College Station, TX 77845
MLS# 26006432Listed by: JOHN PARKER, BROKER $360,000Active4 beds 4 baths1,740 sq. ft.
3360 Keefer Loop, College Station, TX 77845
MLS# 26006435Listed by: JOHN PARKER, BROKER $328,000Active4 beds 4 baths1,778 sq. ft.
3342 Lieutenant Avenue, College Station, TX 77845
MLS# 26006266Listed by: ALLIED LAND & RANCH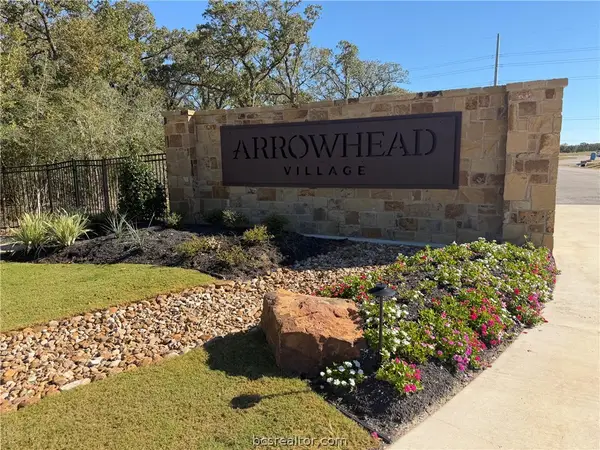 $1,500,000Active4 beds 5 baths3,967 sq. ft.
1322 Arrowhead Village Trail, College Station, TX 77845
MLS# 26006348Listed by: KELLER WILLIAMS REALTY BRAZOS VALLEY OFFICE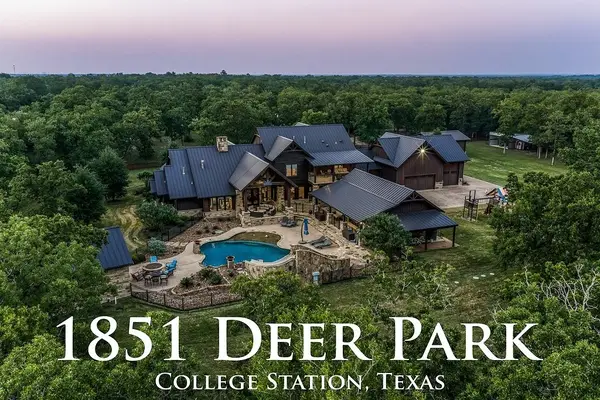 $3,299,000Active6 beds 7 baths6,498 sq. ft.
1851 Deer Park Drive, College Station, TX 77845
MLS# 26006375Listed by: LEGEND TEXAS PROPERTIES $200,000Active2 beds 1 baths950 sq. ft.
601 San Saba Court, College Station, TX 77845
MLS# 26005179Listed by: LONGITUDE REAL ESTATE $766,900Pending4 beds 4 baths3,032 sq. ft.
1836 Register Court, College Station, TX 77845
MLS# 26006342Listed by: LLANO RIVER REALTY LLC $249,900Active3 beds 2 baths1,278 sq. ft.
300 Fraternity, College Station, TX 77845
MLS# 26006315Listed by: HUDSON TEAM, THE $614,900Active4 beds 3 baths2,300 sq. ft.
1825 Register Court, College Station, TX 77845
MLS# 26006222Listed by: INHABIT REAL ESTATE GROUP $399,900Active3 beds 2 baths1,904 sq. ft.
2524 Warkworth Lane, College Station, TX 77845
MLS# 26006306Listed by: NEXTHOME REALTY SOLUTIONS BCS $339,900Active4 beds 4 baths1,853 sq. ft.
128 Kimber Lane, College Station, TX 77845-7438
MLS# 26006291Listed by: BROOKHAVEN REALTY $350,000Active3 beds 2 baths1,690 sq. ft.
4047 Dunlap, College Station, TX 77845-2053
MLS# 26006284Listed by: BHHS CALIBER REALTY $284,990Active3 beds 2 baths1,359 sq. ft.
7804 Appomattox Drive, College Station, TX 77845
MLS# 26006168Listed by: KELLER WILLIAMS REALTY BRAZOS VALLEY OFFICE $249,500Pending2 beds 2 baths1,243 sq. ft.
4335 Dawn Lynn Drive, College Station, TX 77845
MLS# 26006261Listed by: GREENPRINT REAL ESTATE GROUP $364,900Active4 beds 4 baths1,853 sq. ft.
3011 Marvel Court, College Station, TX 77845
MLS# 26006212Listed by: AGGIELAND PROPERTIES $1,185,000Pending4 beds 5 baths3,232 sq. ft.
17325 Halona Court, College Station, TX 77845
MLS# 26006226Listed by: COLDWELL BANKER APEX, REALTORS $279,900Active3 beds 2 baths1,587 sq. ft.
817 Mineral Wells Lane, College Station, TX 77845
MLS# 26006260Listed by: CENTURY 21 INTEGRA $725,000Active3 beds 3 baths2,691 sq. ft.
5680 Pratt Road, College Station, TX 77845
MLS# 26006061Listed by: COLDWELL BANKER APEX, REALTORS $849,900Active3 beds 3 baths2,329 sq. ft.
5559 Blue Ridge Drive, College Station, TX 77845
MLS# 26006062Listed by: SHERLOCK - REALTORS $1,850,000Pending4 beds 5 baths5,399 sq. ft.
3500 Sagamore Dr, College Station, TX 77845
MLS# 7530717Listed by: BEYCOME BROKERAGE REALTY LLC $375,000Active3 beds 3 baths1,927 sq. ft.
4251 Rocky Rhodes Drive, College Station, TX 77845
MLS# 26006223Listed by: NEXTHOME REALTY SOLUTIONS BCS $324,900Pending3 beds 2 baths1,838 sq. ft.
8442 Lauren Drive, College Station, TX 77845
MLS# 26006215Listed by: RE/MAX 2020 $443,000Active4 beds 3 baths2,881 sq. ft.
6317 Eldora Drive, College Station, TX 77845
MLS# 26006235Listed by: SRA STRATEGIC REALTY ADVISORS $279,900Pending3 beds 2 baths1,364 sq. ft.
2519 Leyla Lane, College Station, TX 77845
MLS# 26006210Listed by: SRA STRATEGIC REALTY ADVISORS $289,000Active4 beds 2 baths1,703 sq. ft.
15104 Meredith Lane, College Station, TX 77845
MLS# 26006211Listed by: NICHE PROPERTIES $299,900Active3 beds 2 baths1,405 sq. ft.
610 Plano Drive, College Station, TX 77845
MLS# 26006224Listed by: COLDWELL BANKER APEX, REALTORS $449,900Active3 beds 2 baths1,839 sq. ft.
10462 Woodview Drive, College Station, TX 77845
MLS# 26006225Listed by: AGGIELAND PROPERTIES $289,000Active3 beds 2 baths1,662 sq. ft.
1816 Brothers Blvd #10, College Station, TX 77845
MLS# 26006179Listed by: LISTING RESULTS, LLC $249,000Active2 beds 3 baths1,130 sq. ft.
1451 Associates Avenue #707, College Station, TX 77845-1517
MLS# 26006153Listed by: WALSH &MANGAN PREMIER RE GROUP $780,000Active4 beds 4 baths2,850 sq. ft.
4422 Jack Court, College Station, TX 77845
MLS# 26006162Listed by: KELLER WILLIAMS REALTY THE WOODLANDS $995,000Pending4 beds 3 baths3,631 sq. ft.
17599 Indian Lakes Drive, College Station, TX 77845
MLS# 26006057Listed by: HUDSON TEAM, THE $390,000Pending4 beds 5 baths1,845 sq. ft.
1450 Ailin Drive, College Station, TX 77845
MLS# 26006186Listed by: KELLER WILLIAMS REALTY BRAZOS VALLEY OFFICE $640,000Active4 beds 4 baths2,881 sq. ft.
3509 Parmer Creek Court, College Station, TX 77845
MLS# 26005486Listed by: COLDWELL BANKER APEX, REALTORS $425,000Pending4 beds 3 baths2,201 sq. ft.
318 Cecilia Loop, College Station, TX 77845
MLS# 26006172Listed by: NEXTHOME REALTY SOLUTIONS BCS $319,000Active4 beds 2 baths1,791 sq. ft.
1521 Strasburg Cir, College Station, TX 77845
MLS# 8575218Listed by: A COMPLETE REALTY $475,000Active4 beds 3 baths2,211 sq. ft.
4009 Crooked Creek Path, College Station, TX 77845
MLS# 26005751Listed by: TOWERPOINT REALTY $439,900Pending4 beds 3 baths2,334 sq. ft.
4320 Rock Bend Drive, College Station, TX 77845
MLS# 26005907Listed by: RE/MAX 2020 $649,900Active4 beds 3 baths3,393 sq. ft.
5118 Congressional Drive, College Station, TX 77845
MLS# 26006008Listed by: CENTURY 21 INTEGRA $799,900Active6 beds 5 baths3,002 sq. ft.
5531 Cole Lane, College Station, TX 77845
MLS# 26006032Listed by: TEXAS HERITAGE REALTY $2,160,000Active-- beds -- baths10,583 sq. ft.
3360 Keefer Loop, College Station, TX 77845
MLS# 26006145Listed by: JOHN PARKER, BROKER $324,000Active3 beds 2 baths1,654 sq. ft.
3865 Still Creek Loop, College Station, TX 77845
MLS# 26006150Listed by: NEXTHOME REALTY SOLUTIONS BCS $315,000Active3 beds 2 baths1,511 sq. ft.
10639 Natural Pond Road, Bryan, TX 77845
MLS# 26005851Listed by: JLA REALTY $569,900Active4 beds 4 baths3,018 sq. ft.
9413 Whitney Lane, College Station, TX 77845
MLS# 90518925Listed by: REAL BROKER, LLC $295,000Active3 beds 3 baths1,261 sq. ft.
130 Armored Avenue, College Station, TX 77845
MLS# 48741797Listed by: COLDWELL BANKER APEX, REALTORS LLC $410,000Pending3 beds 3 baths1,899 sq. ft.
15654 Long Creek Lane, College Station, TX 77845
MLS# 26006108Listed by: NATIVE REAL ESTATE $775,000Active4 beds 4 baths3,543 sq. ft.
5308 Quaker Ridge Court, College Station, TX 77845
MLS# 2208054Listed by: COLDWELL BANKER APEX, REALTORS LLC $285,000Active4 beds 2 baths1,527 sq. ft.
15474 Baker Meadow Loop, College Station, TX 77845
MLS# 26006053Listed by: REAL BROKER, LLC $325,000Active3 beds 2 baths1,672 sq. ft.
8908 Driftwood Drive, College Station, TX 77845
MLS# 26006095Listed by: SRA STRATEGIC REALTY ADVISORS $434,900Pending-- beds -- baths2,600 sq. ft.
4453/4455 Reveille Road, College Station, TX 77845
MLS# 26006089Listed by: KELLER WILLIAMS REALTY BRAZOS VALLEY OFFICE $349,900Active3 beds 3 baths2,165 sq. ft.
4473 Wisenbaker Way, Bryan, TX 77801
MLS# 39290127Listed by: CENTURY COMMUNITIES $346,000Active4 beds 2 baths2,113 sq. ft.
1164 Kennesaw Drive, College Station, TX 77845
MLS# 47549011Listed by: RE/MAX GO $341,900Active4 beds 3 baths2,013 sq. ft.
4460 Wisenbaker Way, Bryan, TX 77801
MLS# 54947511Listed by: CENTURY COMMUNITIES $322,990Active4 beds 3 baths1,785 sq. ft.
4469 Wisenbaker Way, Bryan, TX 77801
MLS# 96164250Listed by: CENTURY COMMUNITIES $249,900Active2 beds 3 baths1,289 sq. ft.
3929 Yukon Lane, College Station, TX 77845
MLS# 26006004Listed by: NEXTHOME REALTY SOLUTIONS BCS $314,900Active3 beds 3 baths1,959 sq. ft.
15203 Faircrest Drive, College Station, TX 77845
MLS# 26006074Listed by: SHERLOCK - REALTORS $319,900Active3 beds 2 baths1,510 sq. ft.
1233 Patriot Drive, College Station, TX 77845
MLS# 26006060Listed by: STYLECRAFT BROKERAGE, LLC $695,900Pending4 beds 3 baths2,549 sq. ft.
1800 Register Court, College Station, TX 77845
MLS# 26005973Listed by: LLANO RIVER REALTY LLC $380,000Active2.75 Acres
6177 Koppe Bridge Road, College Station, TX 77845
MLS# 26006041Listed by: KELLER WILLIAMS REALTY BRAZOS VALLEY OFFICE $760,000Active5 beds 5 baths4,197 sq. ft.
2605 Belliser Court, College Station, TX 77845
MLS# 38096117Listed by: ZWEIACKER & ASSOCIATES $570,000Active4 beds 3 baths2,506 sq. ft.
4202 Lismore Lane, College Station, TX 77845
MLS# 26006042Listed by: BHHS CALIBER REALTY $495,000Active4 beds 3 baths2,188 sq. ft.
9203 Shadowcrest Drive, College Station, TX 77845
MLS# 26004604Listed by: ENGEL & VOELKERS B/CS $775,000Active4 beds 4 baths3,542 sq. ft.
5308 Quaker Ridge Court, College Station, TX 77845
MLS# 26004920Listed by: COLDWELL BANKER APEX, REALTORS $595,000Active3 beds 2 baths2,115 sq. ft.
1409 Stonebridge Court, College Station, TX 77845
MLS# 26005818Listed by: HUDSON TEAM, THE $174,900Active2 beds 2 baths1,106 sq. ft.
1406 Summit Street #D, College Station, TX 77845
MLS# 26005856Listed by: REAL BROKER, LLC $345,000Active4 beds 2 baths1,922 sq. ft.
1453 Fincastle Loop, College Station, TX 77845
MLS# 26005896Listed by: CENTURY 21 INTEGRA $292,900Active3 beds 4 baths1,650 sq. ft.
1440 Crescent Ridge Drive, College Station, TX 77845-4368
MLS# 26005967Listed by: THE HUDSON TEAM $300,000Active3 beds 2 baths1,699 sq. ft.
206 Bernburg Court, College Station, TX 77845
MLS# 26005969Listed by: OLDHAM GOODWIN GROUP, LLC $349,900Active3 beds 2 baths1,848 sq. ft.
6313 Eldora Drive, College Station, TX 77845
MLS# 26005970Listed by: KELLER WILLIAMS REALTY BRAZOS VALLEY OFFICE $345,000Pending-- beds -- baths1,512 sq. ft.
3345 Lodgepole Circle, College Station, TX 77845-5902
MLS# 26005993Listed by: JLA REALTY $344,000Active3 beds 4 baths1,753 sq. ft.
3521 Summerway, College Station, TX 77845
MLS# 26006000Listed by: AGGIELAND PROPERTIES $475,000Active4 beds 4 baths2,700 sq. ft.
4134 Shallow Creek Loop, College Station, TX 77845
MLS# 26006026Listed by: CENTURY 21 INTEGRA $565,500Active3 beds 3 baths2,876 sq. ft.
4992 Whispering Oaks Drive, College Station, TX 77845
MLS# 39944079Listed by: RE/MAX GRAND $809,900Active4 beds 4 baths3,690 sq. ft.
1106 Royal Adelade Drive, College Station, TX 77845
MLS# 52565909Listed by: NEXTHOME REALTY SOLUTIONS BCS $350,000Pending3 beds 2 baths2,412 sq. ft.
1440 Fincastle Loop, College Station, TX 77845
MLS# 54005427Listed by: ZWEIACKER & ASSOCIATES $389,900Pending3 beds 2 baths1,887 sq. ft.
4203 Muncaster Lane, College Station, TX 77845
MLS# 26005780Listed by: COLDWELL BANKER APEX, REALTORS $1,125,000Active5 beds 4 baths4,762 sq. ft.
9201 Lake Forest Court N, College Station, TX 77845
MLS# 71464178Listed by: THE HUDSON TEAM $283,500Pending3 beds 2 baths1,500 sq. ft.
937 Crested Point Drive, College Station, TX 77845
MLS# 26005924Listed by: TREEHOUSE REAL ESTATE $635,000Active4 beds 3 baths2,594 sq. ft.
2507 Faulkner Drive, College Station, TX 77845
MLS# 91566330Listed by: THE HUDSON TEAM $295,000Active3 beds 3 baths1,790 sq. ft.
3509 Myth Lane, College Station, TX 77845
MLS# 26005928Listed by: WALSH &MANGAN PREMIER RE GROUP $679,000Pending6 beds 4 baths3,236 sq. ft.
704 Canterbury Drive, College Station, TX 77845
MLS# 26005915Listed by: OLDHAM GOODWIN GROUP, LLC $347,900Active3 beds 2 baths1,855 sq. ft.
6203 Eldora Drive, College Station, TX 77845
MLS# 26005918Listed by: STYLECRAFT BROKERAGE, LLC $369,900Active3 beds 2 baths1,815 sq. ft.
4224 Little Rock Court, College Station, TX 77845
MLS# 26005853Listed by: EXP REALTY LLC $325,000Pending3 beds 2 baths1,768 sq. ft.
2900 Normand Drive, College Station, TX 77845
MLS# 26005860Listed by: KELLER WILLIAMS REALTY BRAZOS VALLEY OFFICE $297,990Active4 beds 2 baths1,748 sq. ft.
6096 Gunn Ridge Drive, College Station, TX 77845
MLS# 46537866Listed by: LENNAR HOMES VILLAGE BUILDERS, LLC $675,000Pending5 beds 3 baths3,017 sq. ft.
9669 Woodview Drive, College Station, TX 77845
MLS# 65471397Listed by: COLDWELL BANKER APEX, REALTORS LLC $441,500Active5 beds 3 baths2,998 sq. ft.
1209 Patriot Drive, College Station, TX 77845
MLS# 26005666Listed by: CENTURY 21 INTEGRA $545,000Active4 beds 4 baths3,128 sq. ft.
9310 Amberwood Court, College Station, TX 77845
MLS# 26005810Listed by: NEXTHOME REALTY SOLUTIONS BCS $299,900Pending3 beds 2 baths1,568 sq. ft.
1205 Haley Place, College Station, TX 77845
MLS# 26005901Listed by: TOWERPOINT REALTY $255,000Active4 beds 2 baths1,843 sq. ft.
1201 Hawk Tree Drive, College Station, TX 77845
MLS# 26005822Listed by: LESTER GROUP, THE $440,000Pending4 beds 3 baths2,461 sq. ft.
2491 Newark Circle, College Station, TX 77845
MLS# 93192723Listed by: ZWEIACKER & ASSOCIATES $450,000Active3 beds 2 baths2,131 sq. ft.
15656 Long Creek Lane, College Station, TX 77845
MLS# 26004923Listed by: KELLER WILLIAMS REALTY BRAZOS VALLEY OFFICE $469,900Active4 beds 3 baths1,994 sq. ft.
1613 Briscoe Manor Court, College Station, TX 77845
MLS# 26005802Listed by: REAL BROKER, LLC $358,000Pending4 beds 4 baths1,773 sq. ft.
504 Deacon Drive W, College Station, TX 77845
MLS# 26005858Listed by: THE ARENA GROUP $908,100Active4 beds 4 baths3,027 sq. ft.
5403 Woodland Park Drive, College Station, TX 77845
MLS# 26005786Listed by: BHHS CALIBER REALTY $1,299,000Active5 beds 4 baths5,651 sq. ft.
13863 Fm 2154 Road, College Station, TX 77845
MLS# 26005832Listed by: CENTURY 21 INTEGRA $378,990Active4 beds 3 baths2,228 sq. ft.
6226 Greenville Drive, College Station, TX 77845
MLS# 52292842Listed by: BRIGHTLAND HOMES BROKERAGE $310,000Pending3 beds 2 baths1,540 sq. ft.
110 Meir Lane, College Station, TX 77845
MLS# 26005794Listed by: JLA REALTY $314,900Active3 beds 2 baths1,578 sq. ft.
4202 Shallow Creek Court, College Station, TX 77845
MLS# 26005808Listed by: EXP REALTY, LLC $389,900Active4 beds 4 baths1,874 sq. ft.
3603 Haverford Road, College Station, TX 77845
MLS# 26005812Listed by: MATTHEWS REALTY $389,900Active4 beds 4 baths1,874 sq. ft.
3607 Haverford Road, College Station, TX 77845
MLS# 26005815Listed by: KEVIN MATTHEWS, BROKER $288,800Active3 beds 3 baths1,275 sq. ft.
500 Deacon Drive W, College Station, TX 77845
MLS# 26005816Listed by: KELLER WILLIAMS REALTY BRAZOS VALLEY OFFICE $259,900Active4 beds 2 baths1,629 sq. ft.
1302 Austin Avenue, College Station, TX 77845
MLS# 26005773Listed by: AGGIELAND PROPERTIES $454,990Pending4 beds 4 baths1,904 sq. ft.
4218 Dahlia Court, College Station, TX 77845
MLS# 26005762Listed by: THE ARENA GROUP $424,990Pending4 beds 4 baths3,082 sq. ft.
6227 Greenville Drive, College Station, TX 77845
MLS# 26005767Listed by: BRIGHTLAND HOMES BROKERAGE $345,000Active4 beds 2 baths1,938 sq. ft.
1207 Martinsville Lane, College Station, TX 77845
MLS# 26005665Listed by: BHHS CALIBER REALTY $340,000Pending3 beds 2 baths1,801 sq. ft.
8706 Greenleaf Drive, College Station, TX 77845
MLS# 93203401Listed by: WALSH & MANGAN PREMIER RE GROUP $350,000Active3 beds 2 baths1,808 sq. ft.
803 Emerald Dove Avenue, College Station, TX 77845
MLS# 26005685Listed by: AGGIELAND PROPERTIES $315,000Pending4 beds 2 baths1,802 sq. ft.
1412 Richland Court S, College Station, TX 77845
MLS# 26005729Listed by: TREEHOUSE REAL ESTATE $535,000Active4 beds 3 baths2,480 sq. ft.
4218 Egremont Court, College Station, TX 77845
MLS# 53092204Listed by: BETTER HOMES AND GARDENS REAL ESTATE GARY GREENE - THE WOODLANDS $370,000Active4 beds 3 baths2,342 sq. ft.
6330 Eldora Drive, College Station, TX 77845
MLS# 26005403Listed by: CENTURY 21 INTEGRA $170,000Active2 beds 1 baths1,062 sq. ft.
2800 Longmire Drive #28, College Station, TX 77845
MLS# 26005702Listed by: KELLER WILLIAMS REALTY BRAZOS VALLEY OFFICE $499,000Pending4 beds 3 baths2,658 sq. ft.
8407 Whiterose Court, College Station, TX 77845
MLS# 26005358Listed by: HUDSON TEAM, THE $349,900Active3 beds 4 baths1,727 sq. ft.
550 Hayes Lane, College Station, TX 77845
MLS# 41552359Listed by: RE/MAX 20/20 $322,800Active3 beds 2 baths1,908 sq. ft.
1051 Toledo Bend, College Station, TX 77845
MLS# 26005590Listed by: LONGITUDE REAL ESTATE $974,900Active4 beds 4 baths3,241 sq. ft.
2043 Pebble Bend Drive, College Station, TX 77845
MLS# 26236162Listed by: MARIOTT REAL ESTATE $310,990Active4 beds 2 baths1,826 sq. ft.
6078 Gunn Ridge Drive, College Station, TX 77845
MLS# 42818320Listed by: LENNAR HOMES VILLAGE BUILDERS, LLC $435,000Active4 beds 3 baths2,568 sq. ft.
8711 Bent Tree Drive, College Station, TX 77845
MLS# 86026268Listed by: BEYOND REAL ESTATE $377,500Active4 beds 3 baths2,045 sq. ft.
305 Augsburg Lane, College Station, TX 77845
MLS# 89079944Listed by: KELLER WILLIAMS REALTY BRAZOS VALLEY OFFICE $3,400,000Active9 beds 9 baths1,280 sq. ft.
20650B Fm 2154, College Station, TX 77845
MLS# 40958467Listed by: LEGACY BROKER GROUP $924,900Active4 beds 4 baths2,890 sq. ft.
5028 Vintage Oaks Court, College Station, TX 77845
MLS# 26005578Listed by: TWELVE REALTY $1,125,000Pending3 beds 4 baths3,495 sq. ft.
3101 La Venta Way, College Station, TX 77845
MLS# 24483787Listed by: REAL BROKER, LLC $315,000Active4 beds 4 baths1,853 sq. ft.
116 Tang Cake Drive, College Station, TX 77845
MLS# 26005219Listed by: HUDSON TEAM, THE $819,500Pending4 beds 4 baths3,157 sq. ft.
5101 Piping Rock Court, College Station, TX 77845
MLS# 26005395Listed by: COLDWELL BANKER APEX, REALTORS $289,990Active3 beds 2 baths1,585 sq. ft.
6072 Gunn Ridge Drive, College Station, TX 77845
MLS# 45291472Listed by: LENNAR HOMES VILLAGE BUILDERS, LLC $809,900Active4 beds 4 baths3,690 sq. ft.
1106 Royal Adelade Drive, College Station, TX 77845
MLS# 26005436Listed by: NEXTHOME REALTY SOLUTIONS BCS $301,840Active3 beds 2 baths1,539 sq. ft.
810 Coffee Mill Lane, College Station, TX 77845
MLS# 17946918Listed by: DR HORTON, AMERICA'S BUILDER $302,185Pending3 beds 3 baths1,700 sq. ft.
1164 Toledo Bend Drive, College Station, TX 77845
MLS# 37604856Listed by: DR HORTON, AMERICA'S BUILDER $585,000Active3 beds 2 baths2,102 sq. ft.
4714 Pearl River Court, College Station, TX 77845
MLS# 26005488Listed by: INHABIT REAL ESTATE GROUP $349,900Pending4 beds 4 baths1,917 sq. ft.
2613 Mandi Court, College Station, TX 77845
MLS# 26005577Listed by: MAROON & WHITE PROPERTY MGMT $295,835Pending3 beds 2 baths1,489 sq. ft.
1149 Toledo Bend Drive, College Station, TX 77845
MLS# 37154929Listed by: DR HORTON, AMERICA'S BUILDER $380,990Active4 beds 3 baths2,157 sq. ft.
1212 Samantha Lane, College Station, TX 77845
MLS# 48581765Listed by: LENNAR HOMES VILLAGE BUILDERS, LLC $363,990Active4 beds 2 baths2,014 sq. ft.
1209 Samantha Lane, College Station, TX 77845
MLS# 62010898Listed by: LENNAR HOMES VILLAGE BUILDERS, LLC $285,067Active3 beds 2 baths1,390 sq. ft.
1147 Toledo Bend Drive, College Station, TX 77845
MLS# 62314823Listed by: DR HORTON, AMERICA'S BUILDER $284,528Active3 beds 2 baths1,390 sq. ft.
1135 Toledo Bend Drive, College Station, TX 77845
MLS# 67676639Listed by: DR HORTON, AMERICA'S BUILDER $423,990Active5 beds 4 baths3,147 sq. ft.
1216 Samantha Lane, College Station, TX 77845
MLS# 30525468Listed by: LENNAR HOMES VILLAGE BUILDERS, LLC $286,990Active3 beds 2 baths1,484 sq. ft.
6084 Gunn Ridge Drive, College Station, TX 77845
MLS# 43617523Listed by: LENNAR HOMES VILLAGE BUILDERS, LLC
Local realty services provided by:CENTURY 21 North East, CENTURY 21 Judge Fite Company
Copyright 2026, Houston Realtors Information Service, Inc. All information provided is deemed reliable but is not guaranteed and should be independently verified. IDX information is provided exclusively for consumers' personal, non-commercial use, it may not be used for any purpose other than to identify prospective properties consumers may be interested in purchasing, and the data is deemed reliable but is not guaranteed accurate by the MLS. HARMLS Member Broker: Ashley Conlon
Popular searches near 77845
Popular neighborhoods near 77845
- Alexandria, College Station homes for sale
- Amberlake, College Station homes for sale
- Castle Rock, College Station homes for sale
- Castlegate, College Station homes for sale
- Central College Station, College Station homes for sale
- Cypress Grove Intermediate School, College Station homes for sale
- Dove Crossing, College Station homes for sale
- Edelweiss, College Station homes for sale
- Edelweiss Gardens, College Station homes for sale
- Medical District, College Station homes for sale
- Sonoma, College Station homes for sale
- Southern Plantation, College Station homes for sale
- Southern Trace, College Station homes for sale
- Southwood Valley, College Station homes for sale
- Steeplechase, College Station homes for sale
- Sun Meadows, College Station homes for sale
- The Barracks, College Station homes for sale
- Westfield Village, College Station homes for sale
- William's Court, College Station homes for sale
- Williams Gate, College Station homes for sale
Counties near College Station, 77845
- Austin County homes for sale
- Bastrop County homes for sale
- Brazos County homes for sale
- Burleson County homes for sale
- Colorado County homes for sale
- Falls County homes for sale
- Fayette County homes for sale
- Grimes County homes for sale
- Houston County homes for sale
- Lee County homes for sale
- Leon County homes for sale
- Limestone County homes for sale
- Madison County homes for sale
- Milam County homes for sale
- Montgomery County homes for sale
- Robertson County homes for sale
- San Jacinto County homes for sale
- Walker County homes for sale
- Waller County homes for sale
- Washington County homes for sale
Protect your home and budget from life's surprises with an Assurant Home Warranty, backed by a partner that supports you through every step of homeownership. Explore Plans.
©2026 Century 21 Real Estate LLC. All rights reserved. CENTURY 21®, the CENTURY 21 Logo and C21® are service marks owned by Century 21 Real Estate LLC. Century 21 Real Estate LLC fully supports the principles of the Fair Housing Act and the Equal Opportunity Act. Each office is independently owned and operated. Listing information is deemed reliable but not guaranteed accurate.