- Andrews homes for sale
- Chester homes for sale
- Dallas homes for sale
- Huntington homes for sale
- Huntington Township homes for sale
- Jackson homes for sale
- Jefferson homes for sale
- Lafayette homes for sale
- Liberty homes for sale
- Markle homes for sale
- Roanoke homes for sale
- Rockcreek homes for sale
- Salamonie homes for sale
- Uniondale homes for sale
- Van Buren homes for sale
- Van Buren Township homes for sale
- Warren Township homes for sale
- Warren homes for sale
- Washington homes for sale
- Yoder homes for sale
Huntington County, IN - homes for sale
6 of 6 results displayed
- New
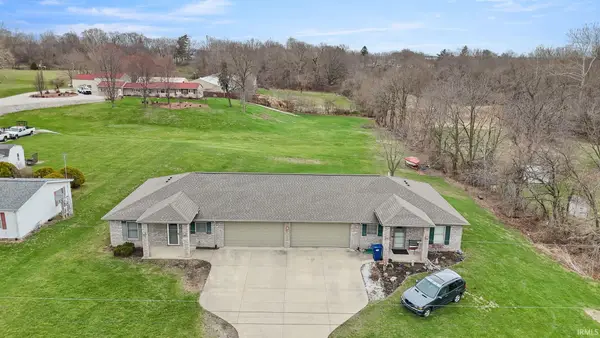
 $319,900Active4 beds 4 baths2,296 sq. ft.
1759 Stults Road, Huntington, IN 46750
MLS# 202610276Listed by: ESTATE ADVISORS LLC - New
 $319,900Active4 beds 4 baths2,296 sq. ft.
1757 Stults Road, Huntington, IN 46750
MLS# 202609735Listed by: ESTATE ADVISORS LLC 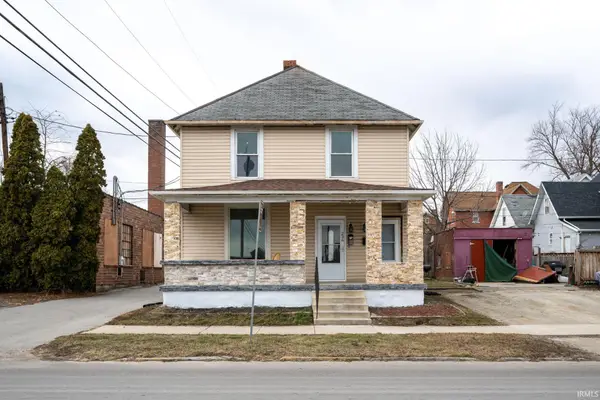 $125,000Pending3 beds 2 baths1,700 sq. ft.
236 E Park Drive, Huntington, IN 46750
MLS# 202606618Listed by: COLDWELL BANKER REAL ESTATE GR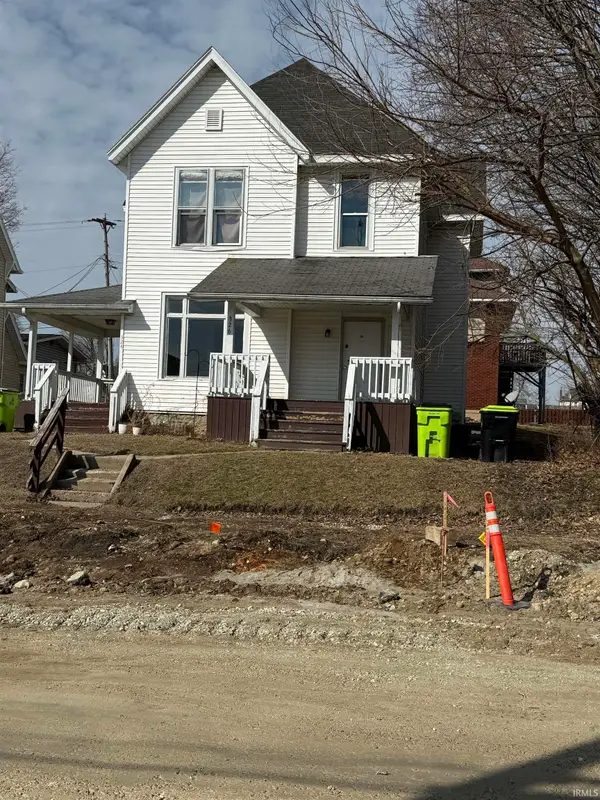 $164,000Active5 beds 2 baths2,400 sq. ft.
326 E Tipton Street, Huntington, IN 46750
MLS# 202604975Listed by: KELLER WILLIAMS REALTY GROUP $190,000Active7 beds 2 baths3,489 sq. ft.
4565 E Station Road Road, Roanoke, IN 46783
MLS# 202532119Listed by: MIKE THOMAS ASSOC., INC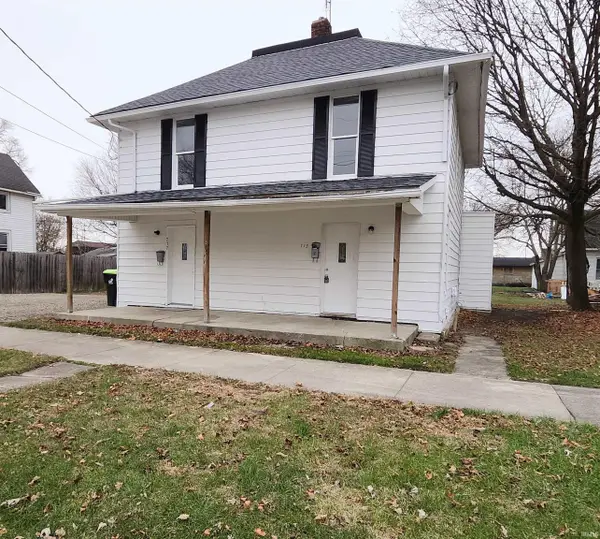
 $129,900Active4 beds 2 baths1,816 sq. ft.
713 E Franklin Street, Huntington, IN 46750
MLS# 202608554Listed by: CENTURY 21 BRADLEY REALTY, INC
Local realty services provided by:CENTURY 21 Bradley Realty, Inc.
IRMLS information is provided exclusively for consumers' personal, non-commercial use and may not be used for any purpose other than to identify prospective properties consumers may be interested in purchasing. IRMLS Data is deemed reliable but is not guaranteed accurate by the MLS. IRMLS information provided by the Indiana Regional MLS. Copyright 2026 Indiana Regional MLS LLC.
Popular searches near Huntington County, IN
Popular neighborhoods near Huntington County, IN
- Avalon Place, Fort Wayne homes for sale
- Bass, Fort Wayne homes for sale
- Broad River, Fort Wayne homes for sale
- Creighton Home, Fort Wayne homes for sale
- Fairfield, Fort Wayne homes for sale
- Fairmont, Fort Wayne homes for sale
- Hoagland Masterson, Fort Wayne homes for sale
- Lafayette Place, Fort Wayne homes for sale
- Mount Vernon Park, Fort Wayne homes for sale
- Nebraska, Fort Wayne homes for sale
- Oakdale, Fort Wayne homes for sale
- Old Trail, Fort Wayne homes for sale
- Poplar, Fort Wayne homes for sale
- Reckeweg Road, Fort Wayne homes for sale
- South Suburban, Fort Wayne homes for sale
- South Wayne, Fort Wayne homes for sale
- Southwest Waynedale, Fort Wayne homes for sale
- Sycamore Hills, Fort Wayne homes for sale
- Village Woods, Fort Wayne homes for sale
- Williams Park, Fort Wayne homes for sale
Zip codes near Huntington County, IN
- 46702 homes for sale
- 46714 homes for sale
- 46750 homes for sale
- 46770 homes for sale
- 46777 homes for sale
- 46781 homes for sale
- 46783 homes for sale
- 46787 homes for sale
- 46791 homes for sale
- 46792 homes for sale
- 46798 homes for sale
- 46804 homes for sale
- 46809 homes for sale
- 46814 homes for sale
- 46819 homes for sale
- 46940 homes for sale
- 46952 homes for sale
- 46962 homes for sale
- 46991 homes for sale
- 46992 homes for sale
Protect your home and budget from life's surprises with an Assurant Home Warranty, backed by a partner that supports you through every step of homeownership. Explore Plans.
©2026 Century 21 Real Estate LLC. All rights reserved. CENTURY 21®, the CENTURY 21 Logo and C21® are service marks owned by Century 21 Real Estate LLC. Century 21 Real Estate LLC fully supports the principles of the Fair Housing Act and the Equal Opportunity Act. Each office is independently owned and operated. Listing information is deemed reliable but not guaranteed accurate.