- Andover homes for sale
- Anoka homes for sale
- Arden Hills homes for sale
- Blaine homes for sale
- Brooklyn Center homes for sale
- Brooklyn Park homes for sale
- Champlin homes for sale
- Circle Pines homes for sale
- Columbia Heights homes for sale
- Coon Rapids homes for sale
- Fridley homes for sale
- Ham Lake homes for sale
- Lino Lakes homes for sale
- Mounds View homes for sale
- New Brighton homes for sale
- North Oaks homes for sale
- Osseo homes for sale
- St Anthony homes for sale
- Shoreview homes for sale
- Spring Lake Park homes for sale
55434, MN - homes for sale
85 of 85 results displayed
- New
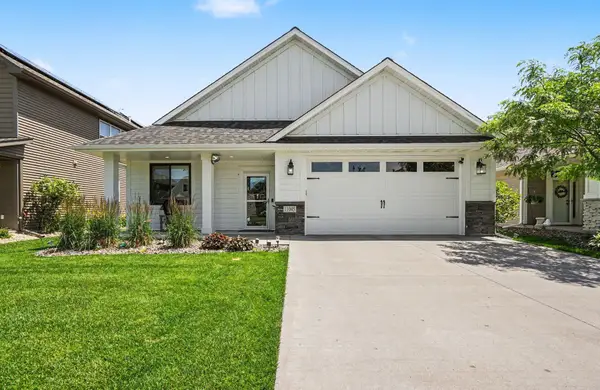
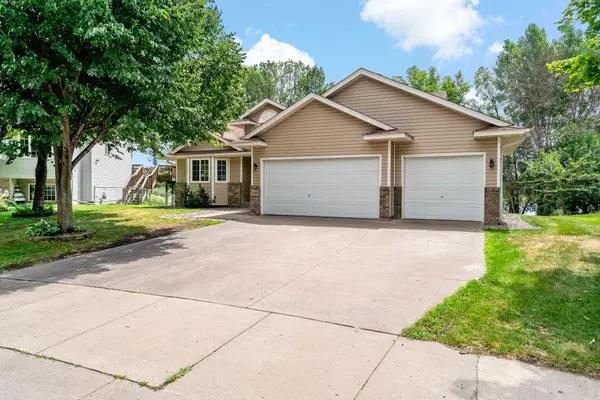 $430,000Active4 beds 3 baths2,192 sq. ft.
11009 Tyler Street Ne, Minneapolis, MN 55434
MLS# 7111856Listed by: HOME RUN REALTY LLC - New
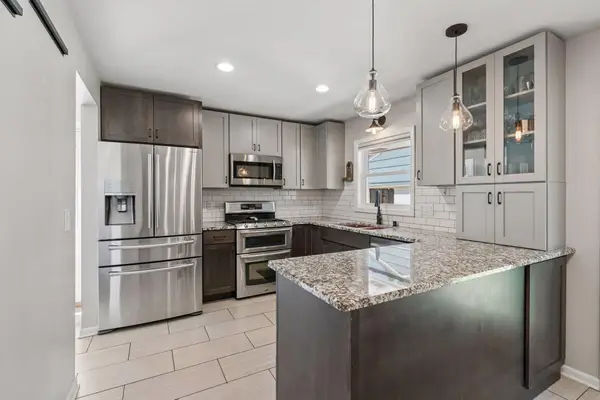
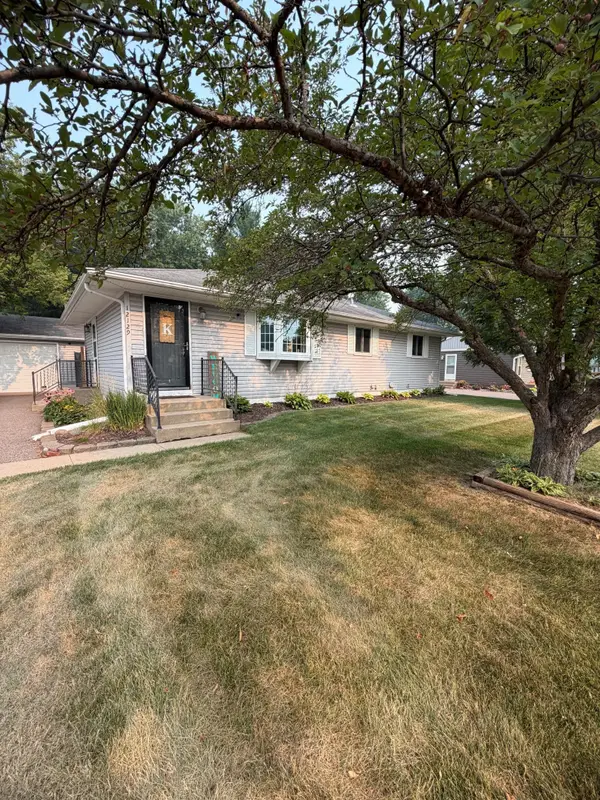 $359,000Active4 beds 2 baths2,112 sq. ft.
12129 Oak Park Boulevard Ne, Minneapolis, MN 55434
MLS# 7111312Listed by: RELIANCE REALTY ADVISERS, LLC - New
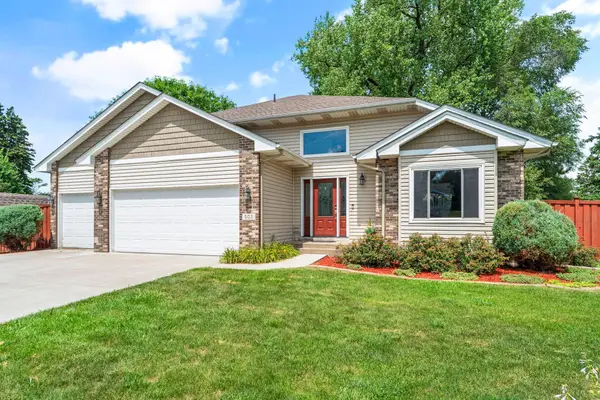 $435,000Active5 beds 2 baths2,105 sq. ft.
803 102nd Avenue Ne, Minneapolis, MN 55434
MLS# 7109411Listed by: EXP REALTY - New
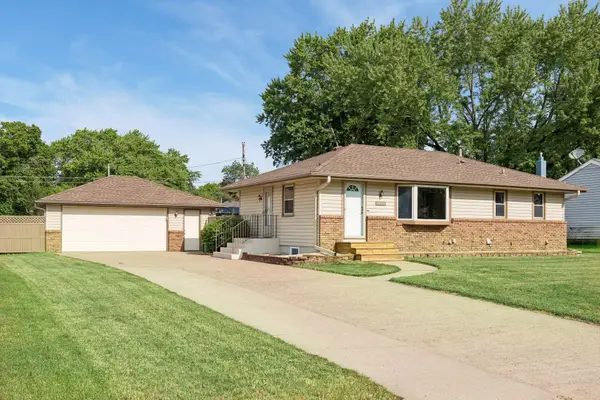
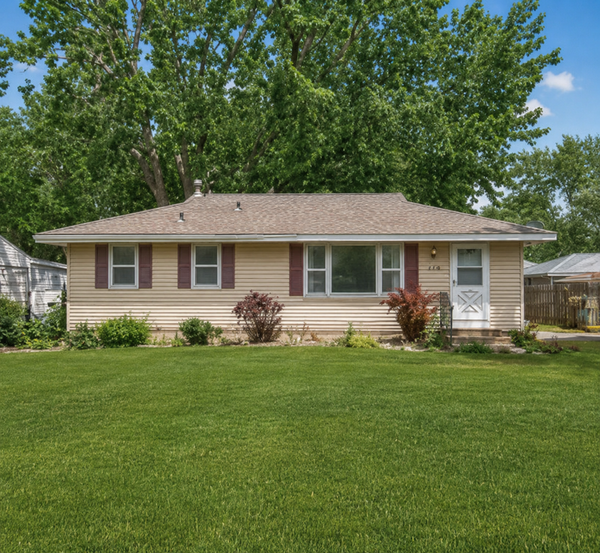 $275,000Active3 beds 2 baths1,590 sq. ft.
10475 6th Street Ne, Minneapolis, MN 55434
MLS# 7111331Listed by: KELLER WILLIAMS CLASSIC RLTY NW - New
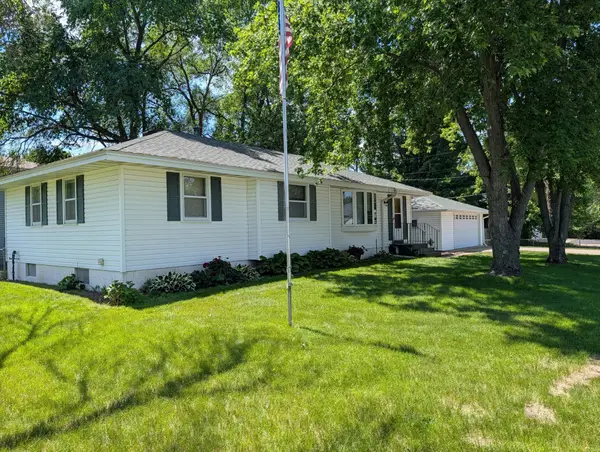
 $364,900Active3 beds 2 baths1,830 sq. ft.
936 97th Lane Ne, Blaine, MN 55434
MLS# 7109366Listed by: BRIDGE REALTY, LLC - New
 $279,900Active2 beds 1 baths748 sq. ft.
11007 4th Street Ne, Minneapolis, MN 55434
MLS# 7110772Listed by: MOLINA REALTORS 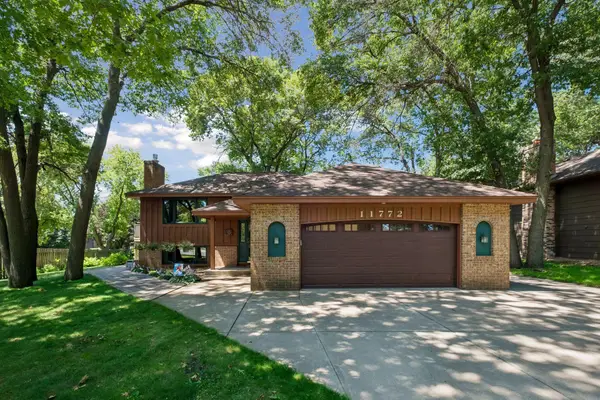 $375,000Pending4 beds 2 baths2,240 sq. ft.
11772 Able Street Ne, Blaine, MN 55434
MLS# 7077310Listed by: ENGEL & VOLKERS LAKE MINNETONKA- New
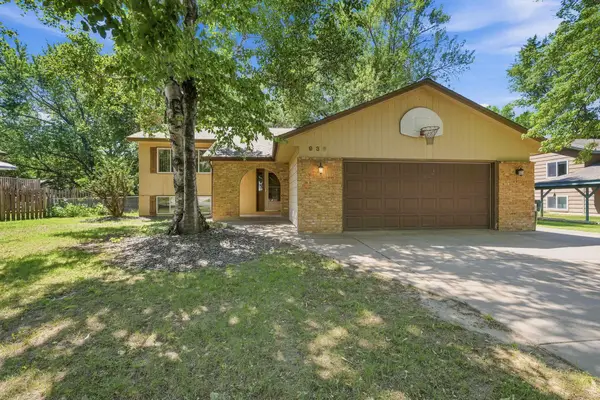
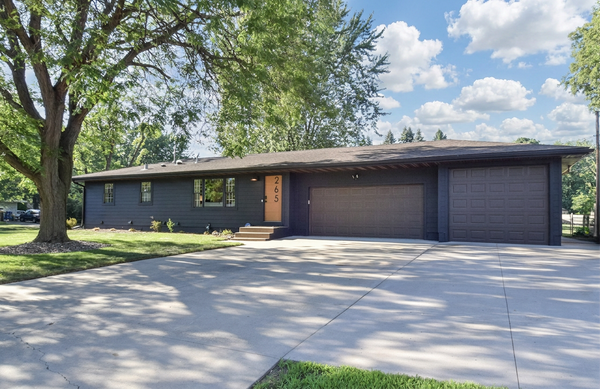 $400,000Active3 beds 2 baths2,134 sq. ft.
265 119th Avenue Ne, Minneapolis, MN 55434
MLS# 7109663Listed by: KELLER WILLIAMS CLASSIC REALTY - New
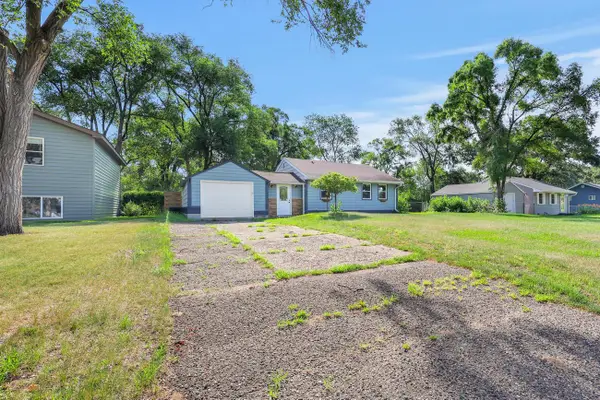
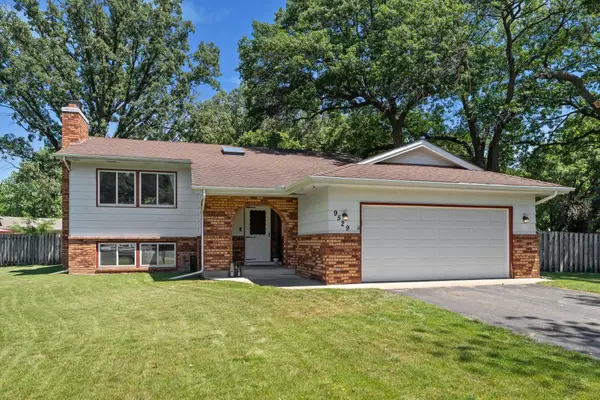 $350,000Active3 beds 2 baths2,000 sq. ft.
9529 Tyler Street Ne, Blaine, MN 55434
MLS# 7109352Listed by: COLDWELL BANKER REALTY - Coming Soon
 $317,900Coming Soon4 beds 2 baths
160 109th Avenue Ne, Blaine, MN 55434
MLS# 7107071Listed by: RE/MAX RESULTS - New
 $265,000Active2 beds 1 baths936 sq. ft.
8706 Lincoln Street Ne, Minneapolis, MN 55434
MLS# 7106860Listed by: BRIDGE REALTY, LLC - New
 $550,000Active3 beds 3 baths3,282 sq. ft.
607 100th Court Ne, Blaine, MN 55434
MLS# 7101901Listed by: EXP REALTY - New
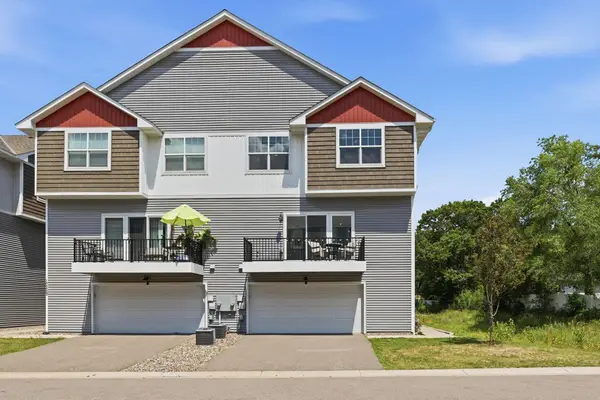 $354,900Active3 beds 3 baths1,620 sq. ft.
10259 3rd Street Ne #B, Minneapolis, MN 55434
MLS# 7104953Listed by: PEMBERTON RE - New
 $349,900Active4 beds 2 baths1,968 sq. ft.
10600 President Drive Ne, Blaine, MN 55434
MLS# 7106270Listed by: RE/MAX ADVANTAGE PLUS - New
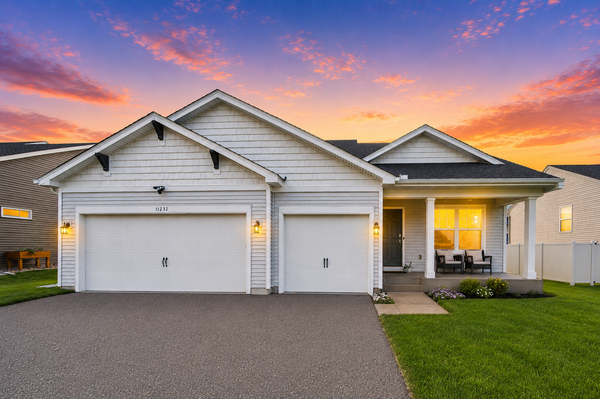 $525,000Active4 beds 4 baths2,330 sq. ft.
11232 Pierce Street Ne, Blaine, MN 55434
MLS# 7106311Listed by: JPW REALTY 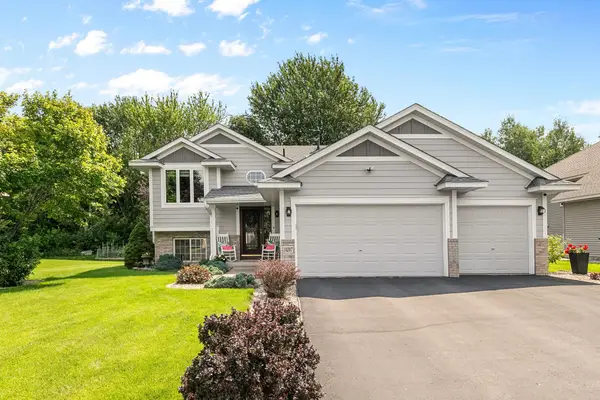 $424,900Pending4 beds 3 baths2,380 sq. ft.
10207 Madison Street Ne, Minneapolis, MN 55434
MLS# 7103625Listed by: METRO BUYERS BROKER INC- New
 $525,000Active3 beds 2 baths1,965 sq. ft.
11045 Polk Street Ne, Minneapolis, MN 55434
MLS# 7104764Listed by: KELLER WILLIAMS CLASSIC REALTY - New
 $369,900Active4 beds 3 baths1,919 sq. ft.
9804 5th Street Ne, Minneapolis, MN 55434
MLS# 7104785Listed by: LPT REALTY, LLC 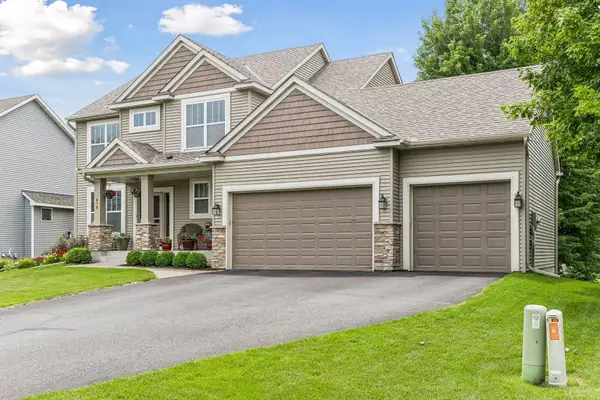 $525,000Active5 beds 4 baths2,903 sq. ft.
878 104th Lane Ne, Minneapolis, MN 55434
MLS# 7100289Listed by: EDINA REALTY, INC. $525,000Active5 beds 4 baths2,770 sq. ft.
878 104th Lane Ne, Blaine, MN 55434
MLS# 7100289Listed by: EDINA REALTY, INC.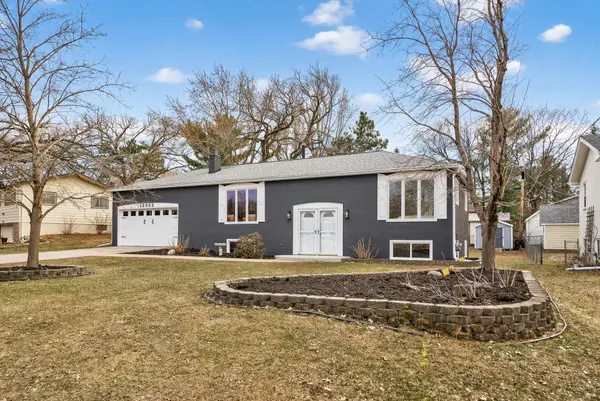 $359,000Pending4 beds 2 baths1,932 sq. ft.
12832 Lincoln Street Ne, Blaine, MN 55434
MLS# 7104913Listed by: 10K REALTY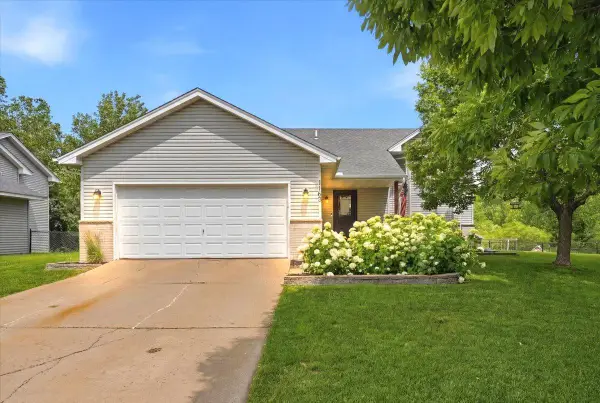 $399,000Pending4 beds 2 baths1,833 sq. ft.
1163 111th Avenue Ne, Blaine, MN 55434
MLS# 6819760Listed by: PROPERTY EXECUTIVES REALTY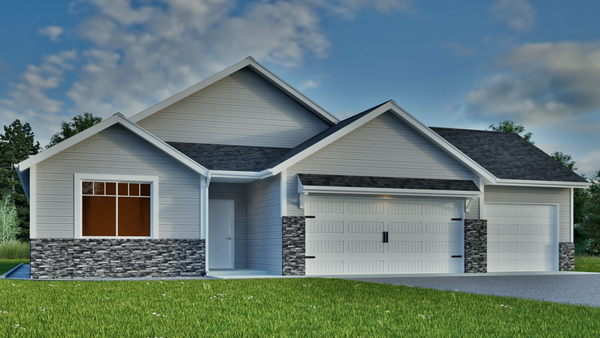 $449,900Active3 beds 2 baths1,517 sq. ft.
11670 Pierce Court Ne, Blaine, MN 55434
MLS# 7102950Listed by: EXP REALTY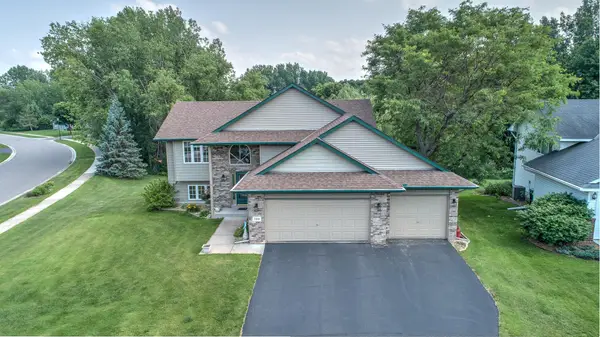
 $459,000Active3 beds 3 baths2,396 sq. ft.
300 101st Court Ne, Blaine, MN 55434
MLS# 7088965Listed by: CENTURY 21 MOLINE REALTY INC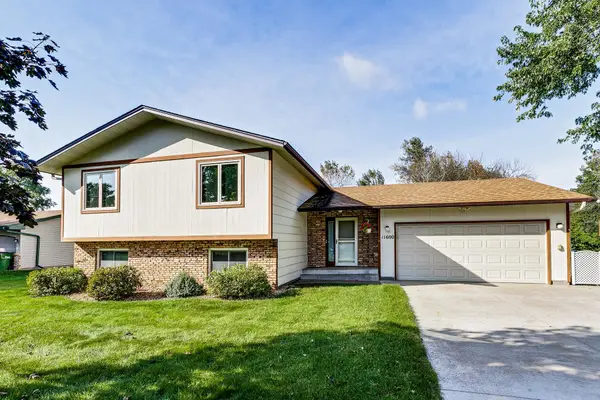 $350,000Pending3 beds 2 baths1,886 sq. ft.
11600 Monroe Street Ne, Blaine, MN 55434
MLS# 7100914Listed by: RE/MAX RESULTS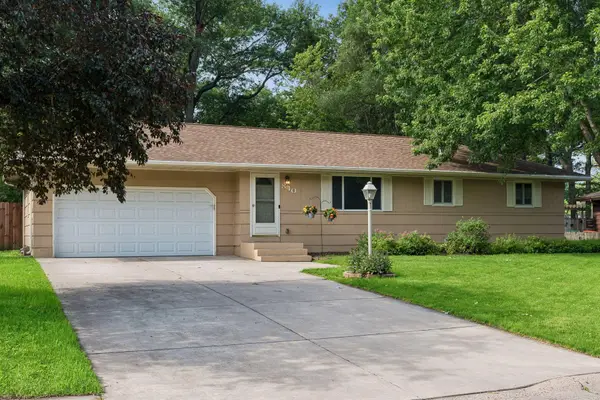 $338,000Active4 beds 2 baths2,112 sq. ft.
840 Oak Ridge Trail Ne, Blaine, MN 55434
MLS# 7081122Listed by: KELLER WILLIAMS INTEGRITY NW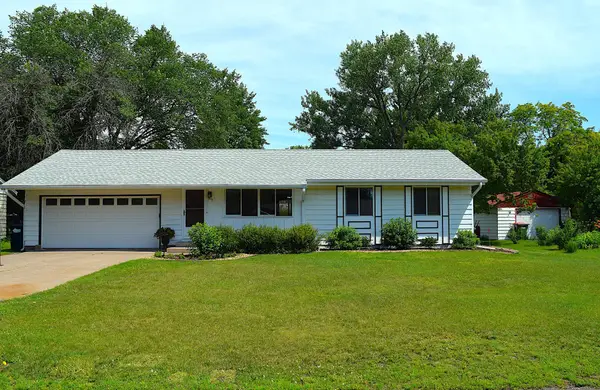 $324,900Pending4 beds 2 baths1,840 sq. ft.
673 109th Lane Ne, Blaine, MN 55434
MLS# 7100808Listed by: RE/MAX RESULTS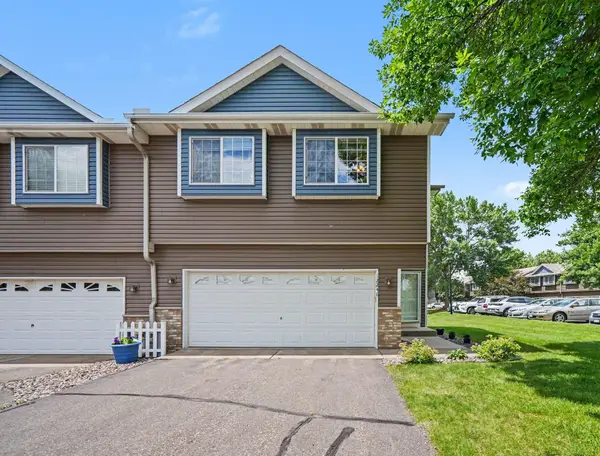 $310,000Active3 beds 2 baths1,948 sq. ft.
12246 Johnson Street Ne, Minneapolis, MN 55434
MLS# 7076567Listed by: KELLER WILLIAMS CLASSIC REALTY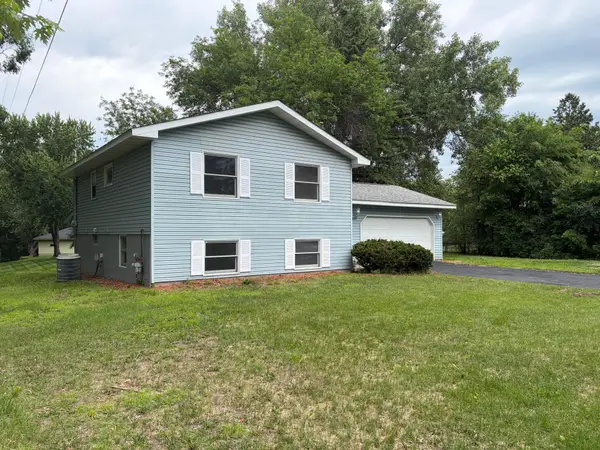 $299,500Pending4 beds 2 baths1,421 sq. ft.
41 117th Avenue Ne, Blaine, MN 55434
MLS# 7098366Listed by: CENTRAL MN REALTY LLC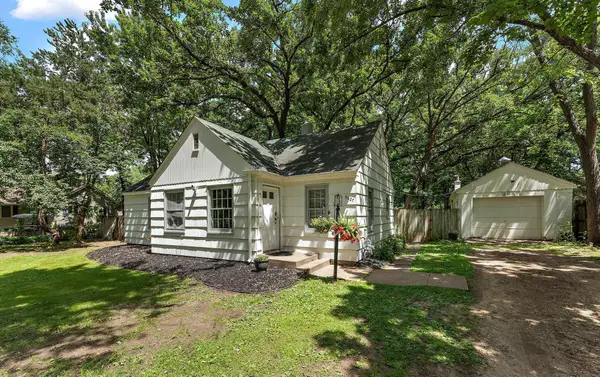 $345,000Pending4 beds 2 baths1,498 sq. ft.
8827 Lincoln Street Ne, Blaine, MN 55434
MLS# 7020567Listed by: KRIS LINDAHL REAL ESTATE $295,000Active2 beds 1 baths832 sq. ft.
11013 6th Street Ne, Blaine, MN 55434
MLS# 7096786Listed by: ACCENT RE & INV GROUP $295,000Active2 beds 1 baths832 sq. ft.
11013 6th Street Ne, Blaine, MN 55434
MLS# 7096786Listed by: ACCENT RE & INV GROUP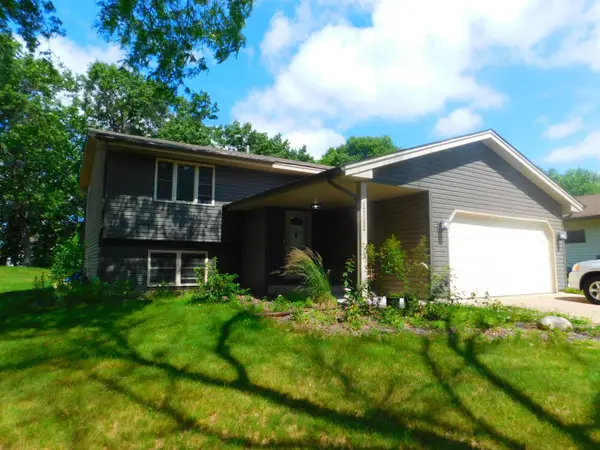 $349,900Active4 beds 2 baths1,942 sq. ft.
12132 Jefferson Street Ne, Minneapolis, MN 55434
MLS# 7099917Listed by: LPT REALTY, LLC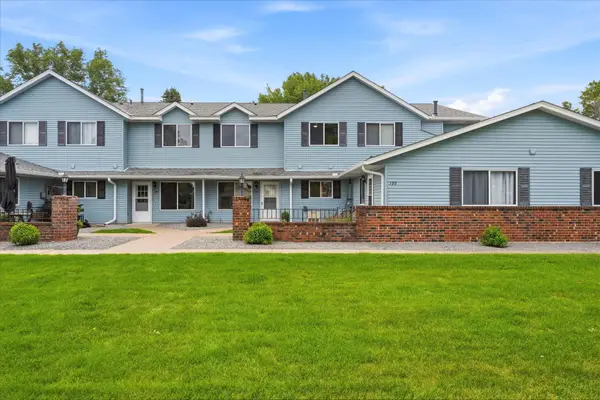 $205,000Active2 beds 2 baths1,098 sq. ft.
193 96th Lane Ne, Minneapolis, MN 55434
MLS# 7098548Listed by: PEMBERTON RE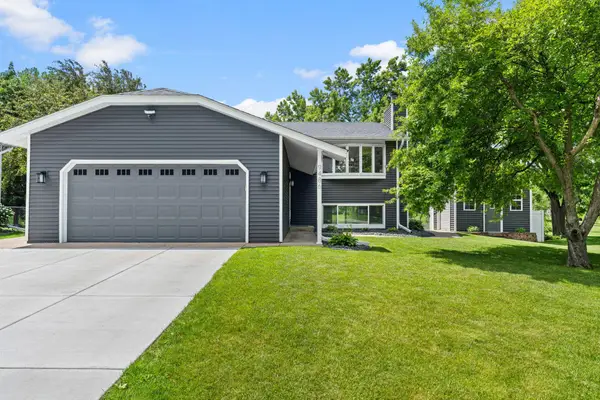 $420,000Pending4 beds 2 baths1,986 sq. ft.
9486 Van Buren Street Ne, Blaine, MN 55434
MLS# 7099434Listed by: RE/MAX RESULTS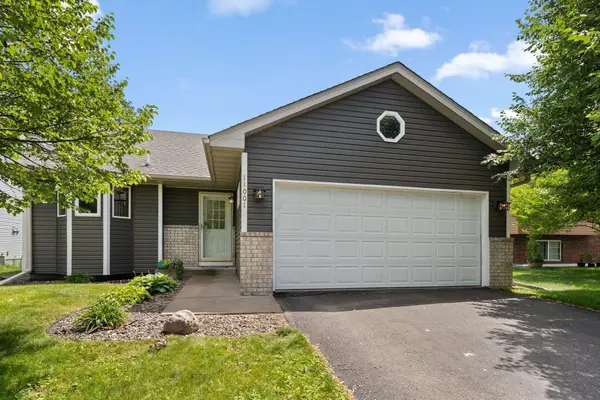 $389,900Pending4 beds 2 baths1,847 sq. ft.
11001 Tyler Street Ne, Blaine, MN 55434
MLS# 7098256Listed by: RE/MAX RELIANCE, INC.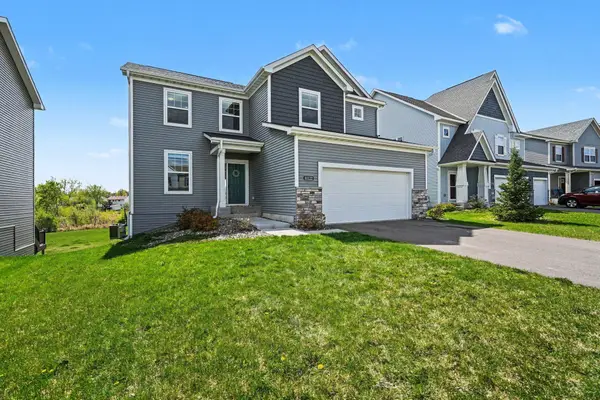 $529,900Active5 beds 4 baths3,088 sq. ft.
11122 Polk Street Ne, Blaine, MN 55434
MLS# 7099114Listed by: VIEW REALTY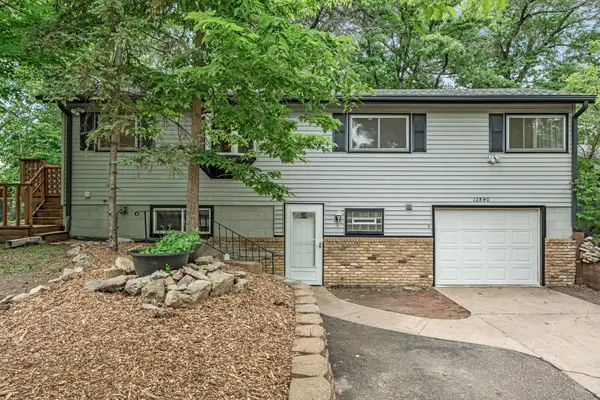 $300,000Pending4 beds 2 baths1,209 sq. ft.
12840 Taylor Street Ne, Blaine, MN 55434
MLS# 7087762Listed by: EXP REALTY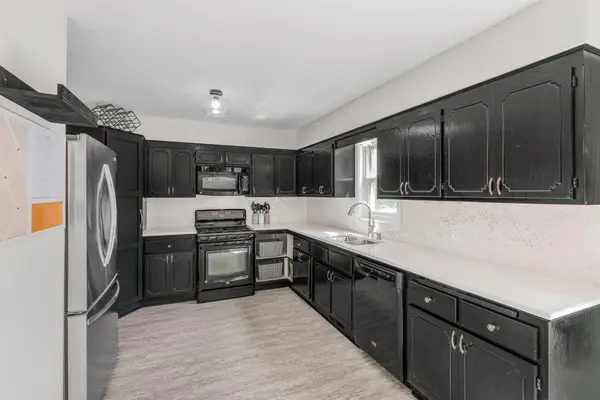 $365,000Active3 beds 2 baths2,032 sq. ft.
1065 89th Avenue Ne, Minneapolis, MN 55434
MLS# 7083032Listed by: KELLER WILLIAMS CLASSIC RLTY NW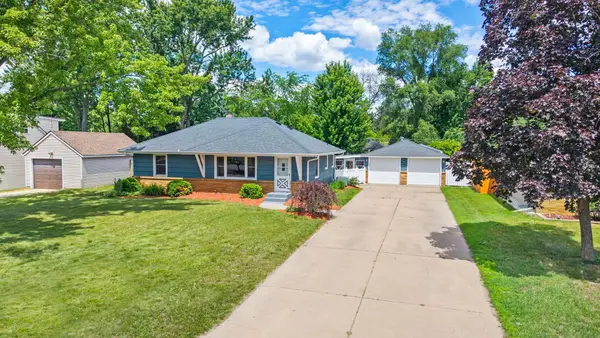 $367,000Pending4 beds 2 baths1,978 sq. ft.
181 91st Lane Ne, Blaine, MN 55434
MLS# 7096722Listed by: COLDWELL BANKER REALTY - SOUTHWEST REGIONAL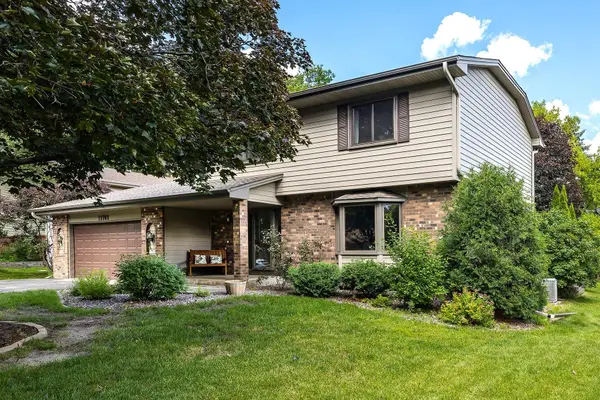 $399,900Pending4 beds 4 baths2,781 sq. ft.
11761 Van Buren Street Ne, Blaine, MN 55434
MLS# 7097844Listed by: EDINA REALTY, INC. $365,000Pending3 beds 2 baths2,009 sq. ft.
9585 Able Street Ne, Blaine, MN 55434
MLS# 7091066Listed by: KELLER WILLIAMS CLASSIC REALTY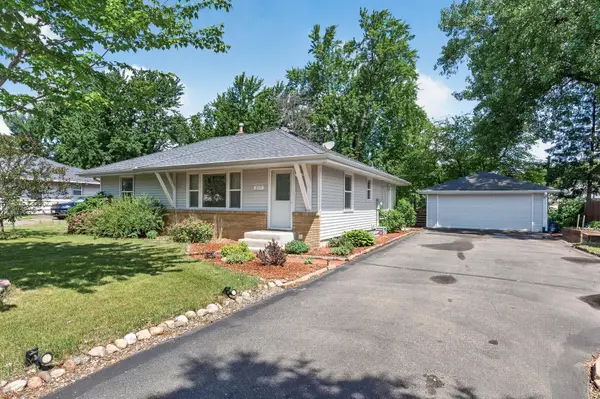 $369,900Active3 beds 2 baths2,030 sq. ft.
211 92nd Avenue Ne, Blaine, MN 55434
MLS# 7093567Listed by: WILLIAM YANG REAL ESTATE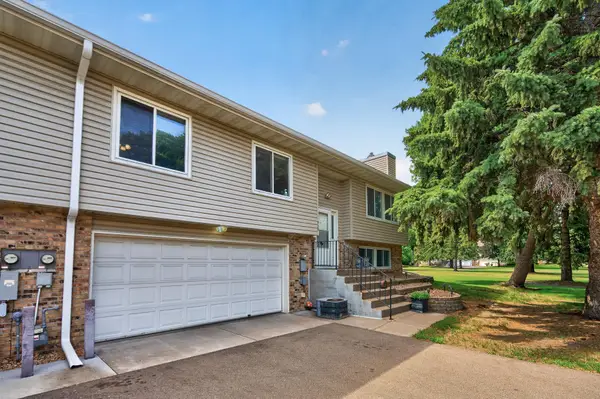 $269,900Active3 beds 2 baths1,564 sq. ft.
929 94th Avenue Ne, Minneapolis, MN 55434
MLS# 7094575Listed by: COMPASS $415,000Pending3 beds 2 baths1,856 sq. ft.
11517 Polk Street Ne, Blaine, MN 55434
MLS# 7019377Listed by: KELLER WILLIAMS CLASSIC RLTY NW $464,900Pending4 beds 3 baths2,166 sq. ft.
840 111th Lane Ne, Blaine, MN 55434
MLS# 7090646Listed by: COLDWELL BANKER REALTY - LAKES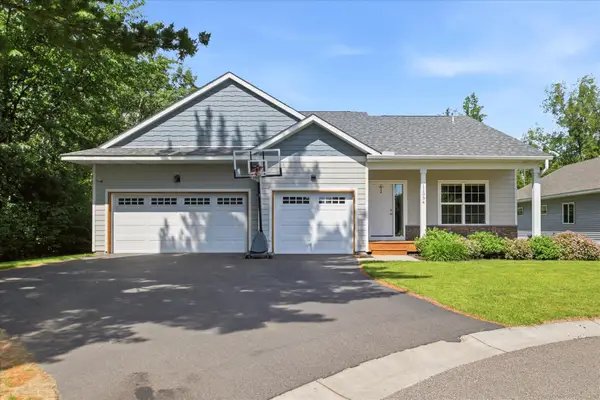 $489,900Pending3 beds 3 baths2,361 sq. ft.
11054 Ulysses Street Ne, Blaine, MN 55434
MLS# 7088541Listed by: JERNELL REALTY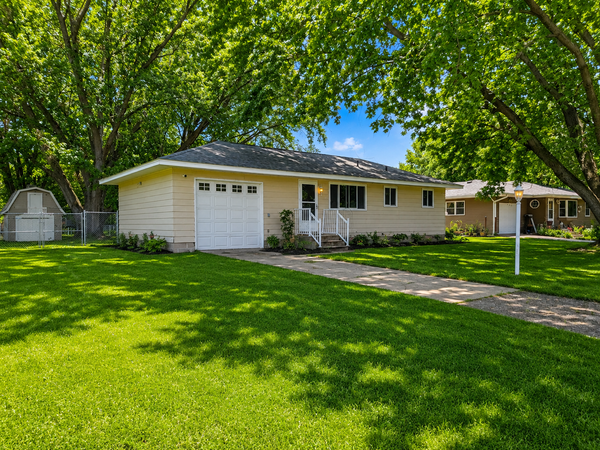 $279,900Pending3 beds 1 baths1,096 sq. ft.
11311 Terrace Road Ne, Blaine, MN 55434
MLS# 7023550Listed by: RE/MAX ADVANTAGE PLUS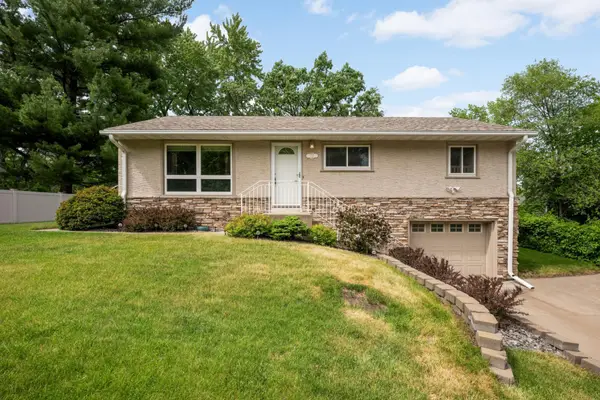 $315,000Pending3 beds 1 baths1,298 sq. ft.
117 91st Lane Ne, Blaine, MN 55434
MLS# 7085913Listed by: EDINA REALTY, INC.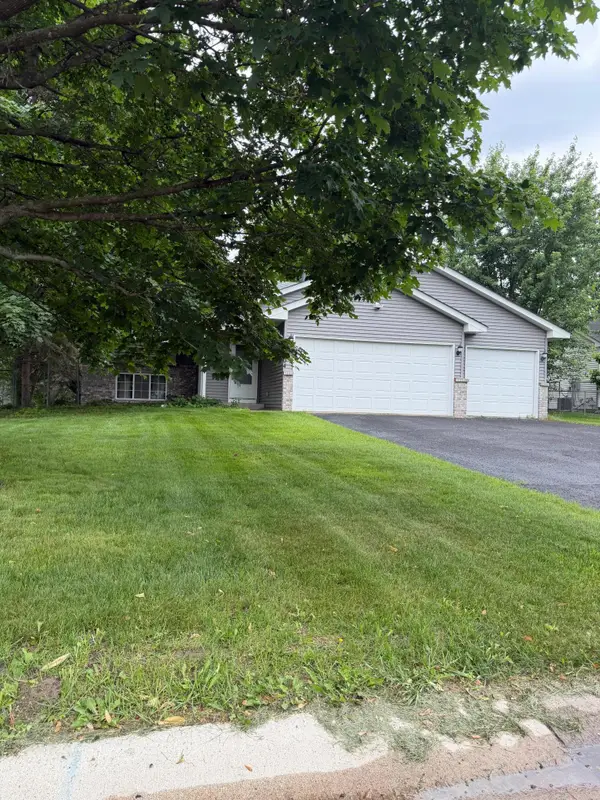 $349,900Pending3 beds 2 baths1,674 sq. ft.
1204 123rd Avenue Ne, Blaine, MN 55434
MLS# 7092577Listed by: GENERATIONS REAL ESTATE GROUP $315,000Active4 beds 2 baths1,674 sq. ft.
8820 Monroe Street Ne, Blaine, MN 55434
MLS# 7092001Listed by: NATIONAL REALTY GUILD $324,900Pending3 beds 2 baths1,875 sq. ft.
821 Clover Leaf Parkway Ne, Blaine, MN 55434
MLS# 7092025Listed by: FISH MLS REALTY $334,900Active4 beds 2 baths1,728 sq. ft.
10439 University Circle Ne, Minneapolis, MN 55434
MLS# 7082716Listed by: LONGHOUSE REALTY $255,000Active2 beds 2 baths1,277 sq. ft.
10104 Fillmore Street Ne #A, Blaine, MN 55434
MLS# 7091725Listed by: RE/MAX RESULTS $325,000Pending3 beds 1 baths1,560 sq. ft.
8924 Tyler Street Ne, Blaine, MN 55434
MLS# 7089813Listed by: EDINA REALTY, INC. $524,750Pending5 beds 4 baths2,900 sq. ft.
1221 118th Lane Ne, Blaine, MN 55434
MLS# 7083078Listed by: RE/MAX SYNERGY $385,900Pending3 beds 3 baths1,881 sq. ft.
12757 Able Street Ne, Blaine, MN 55434
MLS# 7078494Listed by: KELLER WILLIAMS CLASSIC RLTY NW $349,900Pending3 beds 2 baths1,890 sq. ft.
625 119th Avenue Ne, Blaine, MN 55434
MLS# 7088372Listed by: FREEMAN REAL ESTATE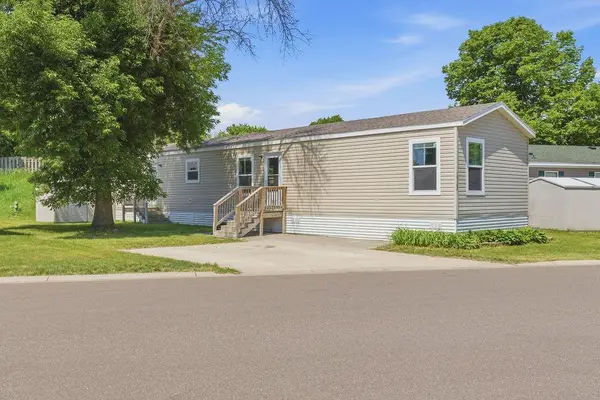 $95,000Active3 beds 2 baths1,216 sq. ft.
10162 Pierce Place Ne, Minneapolis, MN 55434
MLS# 7085222Listed by: RE/MAX RESULTS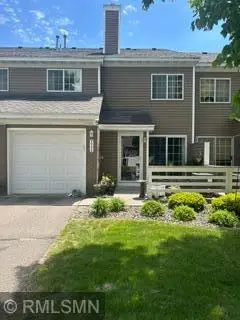 $209,777Active2 beds 1 baths1,080 sq. ft.
9992 NE Fillmore Street Ne, Minneapolis, MN 55434
MLS# 7085109Listed by: TRIUMPH REALTY, INC. $339,900Pending3 beds 2 baths1,647 sq. ft.
620 109th Lane Ne, Blaine, MN 55434
MLS# 7073339Listed by: KELLER WILLIAMS PREMIER REALTY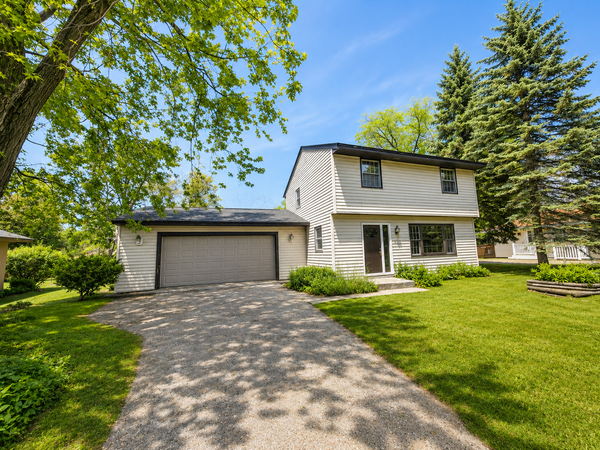 $349,000Active4 beds 2 baths1,620 sq. ft.
337 104th Lane Ne, Blaine, MN 55434
MLS# 7061603Listed by: GOLD DOOR REALTY LLC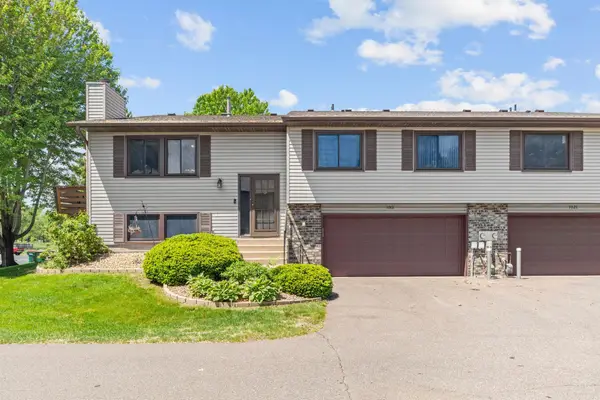 $174,400Active2 beds 1 baths1,516 sq. ft.
1013 122nd Avenue Ne, Blaine, MN 55434
MLS# 7066338Listed by: JPW REALTY $359,900Pending4 beds 2 baths1,854 sq. ft.
320 113th Avenue Ne, Blaine, MN 55434
MLS# 7081915Listed by: RE/MAX RESULTS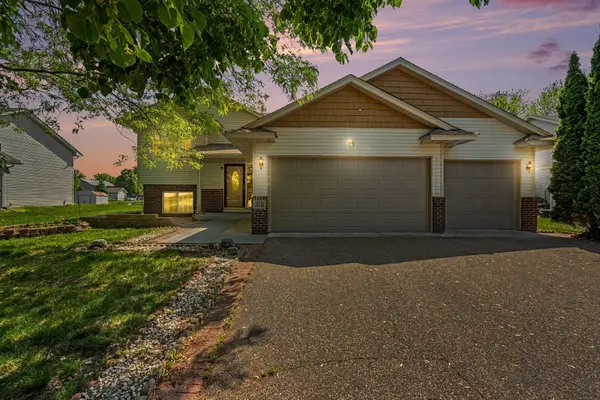 $415,000Pending6 beds 3 baths2,270 sq. ft.
10241 Madison Street Ne, Blaine, MN 55434
MLS# 7072573Listed by: EDINA REALTY, INC.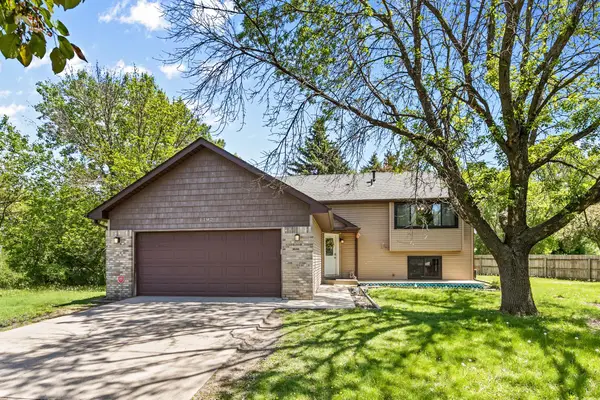 $399,900Pending5 beds 2 baths1,767 sq. ft.
1192 97th Lane Ne, Blaine, MN 55434
MLS# 7082772Listed by: RIVER TOWN REALTY OF MN, INC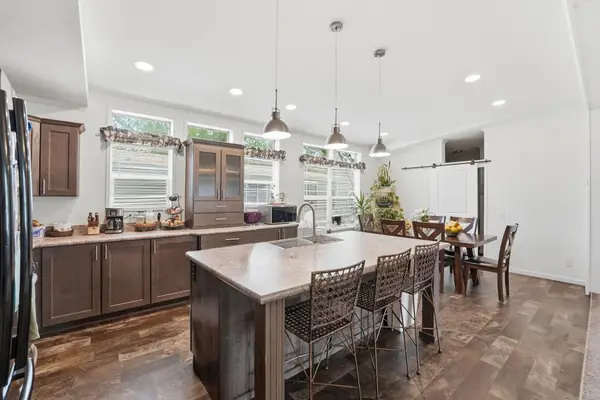 $140,000Active3 beds 2 baths1,277 sq. ft.
10488 Pierce Street Ne, Minneapolis, MN 55434
MLS# 7067898Listed by: PEMBERTON RE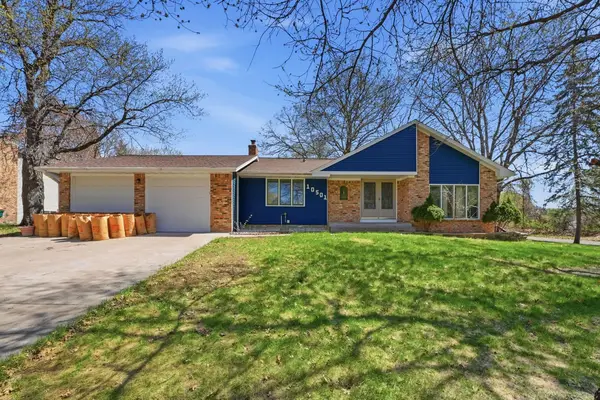 $399,000Active4 beds 3 baths2,626 sq. ft.
10501 Fillmore Street Ne, Blaine, MN 55434
MLS# 7077059Listed by: DIRECT ACCESS REALTY LLC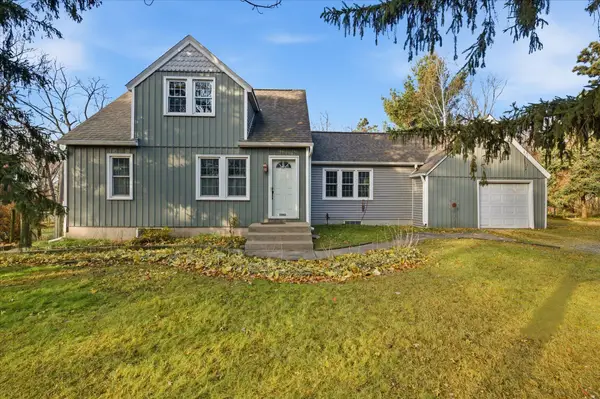 $385,000Pending3 beds 2 baths1,600 sq. ft.
11180 Buchanan Road Ne, Blaine, MN 55434
MLS# 7056801Listed by: EDINA REALTY, INC. $475,000Pending4 beds 3 baths2,514 sq. ft.
12308 3rd Street Ne, Blaine, MN 55434
MLS# 7061091Listed by: COLDWELL BANKER REALTY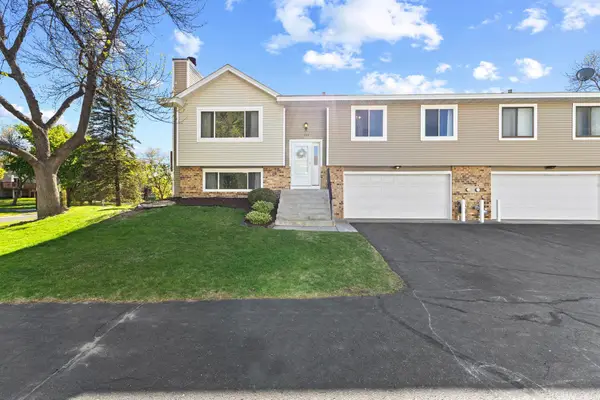 $249,900Pending3 beds 2 baths1,694 sq. ft.
486 97th Lane Ne, Minneapolis, MN 55434
MLS# 7072861Listed by: PRO FLAT FEE REALTY LLC $299,900Active3 beds 2 baths1,576 sq. ft.
373 105th Avenue Ne, Minneapolis, MN 55434
MLS# 7068072Listed by: HOMESTEAD ROAD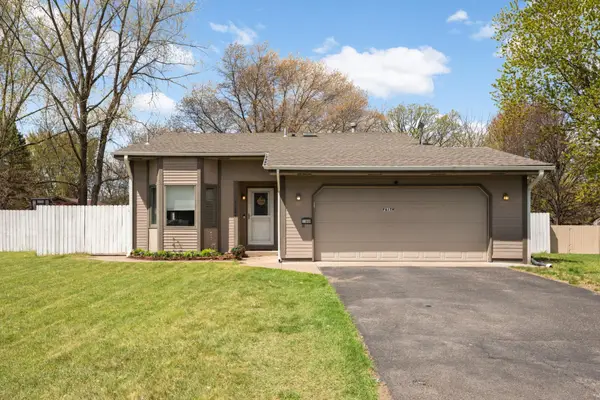 $359,900Pending3 beds 2 baths1,550 sq. ft.
11644 Oak Park Drive Ne, Blaine, MN 55434
MLS# 7069040Listed by: UNIVERSAL REALTY LLC $285,000Pending3 beds 2 baths1,540 sq. ft.
10011 Pleasure Creek Circle Ne, Minneapolis, MN 55434
MLS# 7065880Listed by: RE/MAX RESULTS $325,000Pending4 beds 2 baths1,426 sq. ft.
313 107th Avenue Ne, Blaine, MN 55434
MLS# 7060809Listed by: JL ELITE REALTY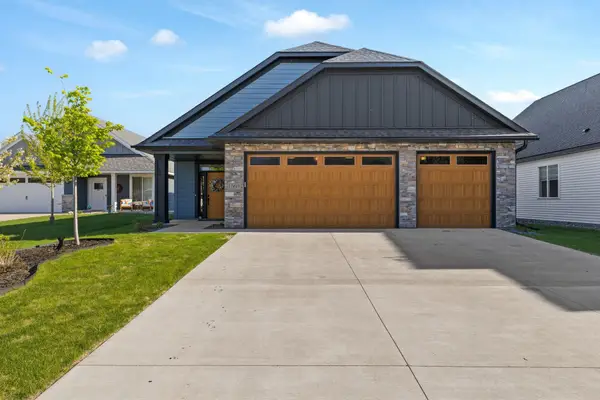 $530,000Active3 beds 2 baths1,945 sq. ft.
1060 109th Court Ne, Minneapolis, MN 55434
MLS# 7057237Listed by: PRO FLAT FEE REALTY LLC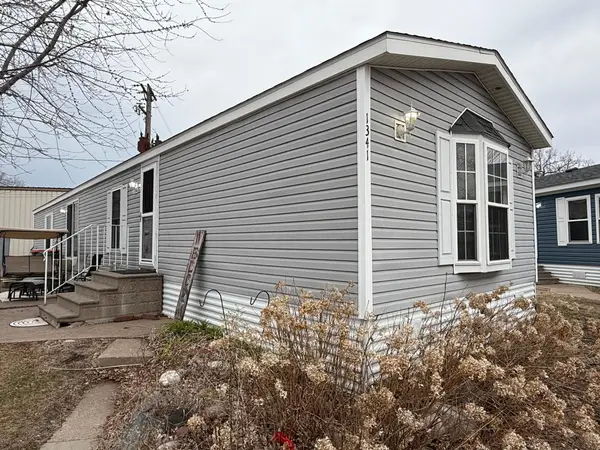 $55,000Active2 beds 2 baths1,088 sq. ft.
1341 104th Lane Ne, Minneapolis, MN 55434
MLS# 7051088Listed by: EXP REALTY $326,000Active3 beds 3 baths2,398 sq. ft.
10240 3rd Street Ne #A, Blaine, MN 55434
MLS# 7036329Listed by: RE/MAX RESULTS $194,900Pending2 beds 1 baths832 sq. ft.
151 96th Lane Ne, Minneapolis, MN 55434
MLS# 7034897Listed by: KELLER WILLIAMS CLASSIC REALTY $415,000Pending5 beds 2 baths2,918 sq. ft.
806 103rd Avenue Ne, Blaine, MN 55434
MLS# 7033962Listed by: LPT REALTY, LLC $234,000Pending3 beds 1 baths1,104 sq. ft.
9242 5th Street Ne, Blaine, MN 55434
MLS# 7029268Listed by: EPIC REALTY, INC $329,000Pending3 beds 2 baths2,132 sq. ft.
11208 Jefferson Street Ne, Blaine, MN 55434
MLS# 6804658Listed by: LABELLE REAL ESTATE GROUP INC $375,000Active3 beds 3 baths1,846 sq. ft.
10260 3rd Street Ne #D, Blaine, MN 55434
MLS# 6781418Listed by: KELLER WILLIAMS CLASSIC RLTY NW $499,900Pending5 beds 4 baths3,343 sq. ft.
100 124th Avenue Ne, Blaine, MN 55434
MLS# 6414366Listed by: COLDWELL BANKER REALTY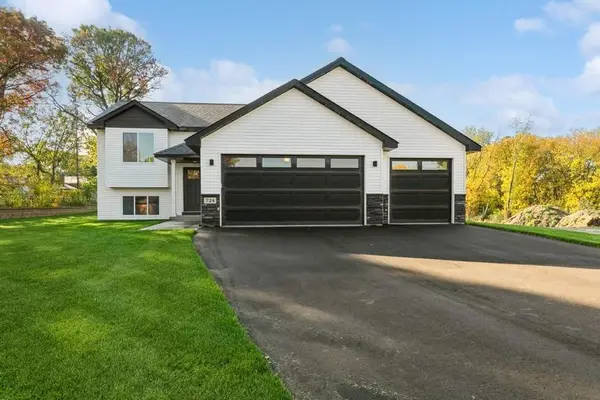 $439,900Pending3 beds 2 baths1,420 sq. ft.
724 114th Court, Blaine, MN 55434
MLS# 6451237Listed by: RELIABLE REALTY GROUP
Local realty services provided by:CENTURY 21 FM Realty, CENTURY 21 Brainerd Realty, Inc.
Popular searches near 55434
Popular neighborhoods near 55434
- Clover Leaf Farm, Blaine homes for sale
- Club West, Blaine homes for sale
- Deacon's Walk, Blaine homes for sale
- Donnays Oak Park, Blaine homes for sale
- Edinburgh, Minneapolis homes for sale
- Eidem, Minneapolis homes for sale
- Harpers Street, Blaine homes for sale
- Melody Manor, Fridley homes for sale
- Mounds View, Saint Paul homes for sale
- Northdale, Coon Rapids homes for sale
- Oaks of Shenandoah, Coon Rapids homes for sale
- Orchard Trail, Minneapolis homes for sale
- Pinebrook, Minneapolis homes for sale
- Quail Creek, Blaine homes for sale
- River Park, Minneapolis homes for sale
- River View, Minneapolis homes for sale
- The Lakes, Blaine homes for sale
- Thompson Heights, Coon Rapids homes for sale
- Thompson Riverview Terrace, Coon Rapids homes for sale
- Willowstone, Minneapolis homes for sale
Counties near Blaine, 55434
- Anoka County homes for sale
- Benton County homes for sale
- Carver County homes for sale
- Chisago County homes for sale
- Dakota County homes for sale
- Goodhue County homes for sale
- Hennepin County homes for sale
- Isanti County homes for sale
- Kanabec County homes for sale
- McLeod County homes for sale
- Mille Lacs County homes for sale
- Pierce County homes for sale
- Polk County homes for sale
- Ramsey County homes for sale
- Rice County homes for sale
- St. Croix County homes for sale
- Scott County homes for sale
- Sherburne County homes for sale
- Washington County homes for sale
- Wright County homes for sale
Protect your home and budget from life's surprises with an Assurant Home Warranty, backed by a partner that supports you through every step of homeownership. Explore Plans.
©2026 Century 21 Real Estate LLC. All rights reserved. CENTURY 21®, the CENTURY 21 Logo and C21® are service marks owned by Century 21 Real Estate LLC. Century 21 Real Estate LLC fully supports the principles of the Fair Housing Act and the Equal Opportunity Act. Each office is independently owned and operated. Listing information is deemed reliable but not guaranteed accurate.