- Allen's Ridge, Palm Harbor homes for sale
- Autumn Woods, Palm Harbor homes for sale
- Barrington Oaks West, Palm Harbor homes for sale
- Baywood Village, Palm Harbor homes for sale
- Beacon Groves, Palm Harbor homes for sale
- Cove Springs, Palm Harbor homes for sale
- Crystal Beach, Palm Harbor homes for sale
- Dove Hollow, Palm Harbor homes for sale
- Downtown Palm Harbor, Palm Harbor homes for sale
- Eniswood, Palm Harbor homes for sale
- Fox Chase, Palm Harbor homes for sale
- Green Valley Estates, Palm Harbor homes for sale
- Indian Bluff Island, Palm Harbor homes for sale
- Innisbrook, Palm Harbor homes for sale
- Laurel Oak Country Woods, Palm Harbor homes for sale
- Ozona Village, Palm Harbor homes for sale
- Rustic Oaks, Palm Harbor homes for sale
- Sage Oaks, Palm Harbor homes for sale
- Westlake Village, Palm Harbor homes for sale
- Wexford Leas, Palm Harbor homes for sale
Palm Harbor, FL - homes for sale
300 of 632 results displayed
- New
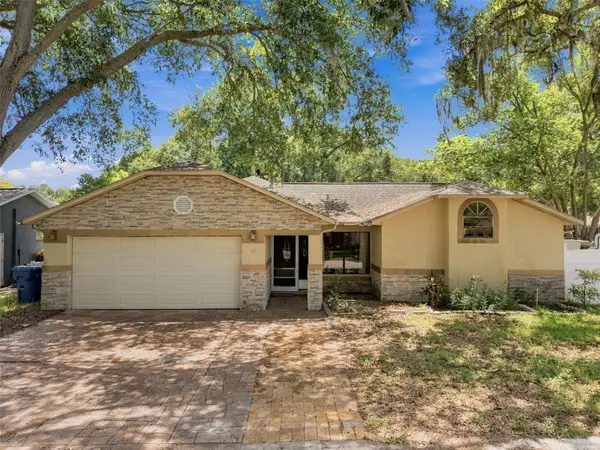
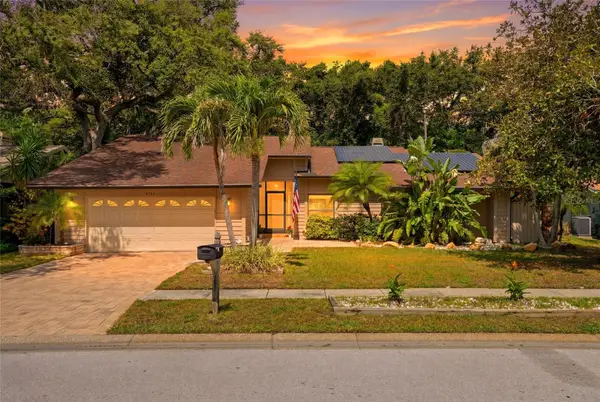
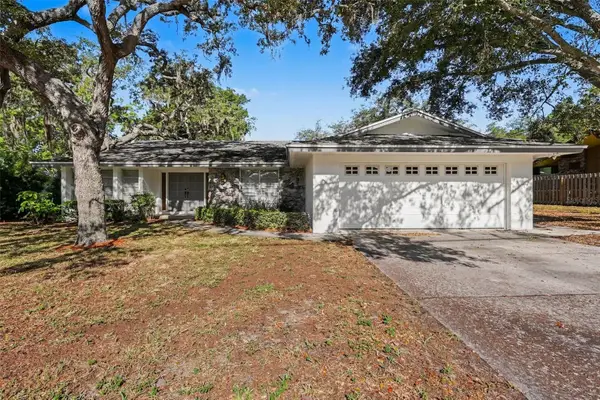
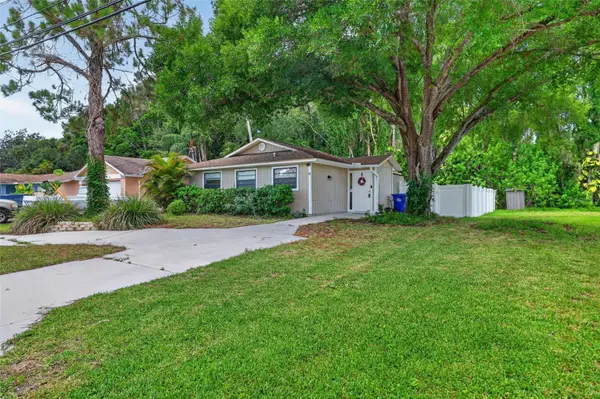 $315,000Active2 beds 1 baths1,030 sq. ft.
9 Freshwater Drive, PALM HARBOR, FL 34684
MLS# TB8526277Listed by: KELLER WILLIAMS SOUTH TAMPA - Open Fri, 6 to 7:30pmNew
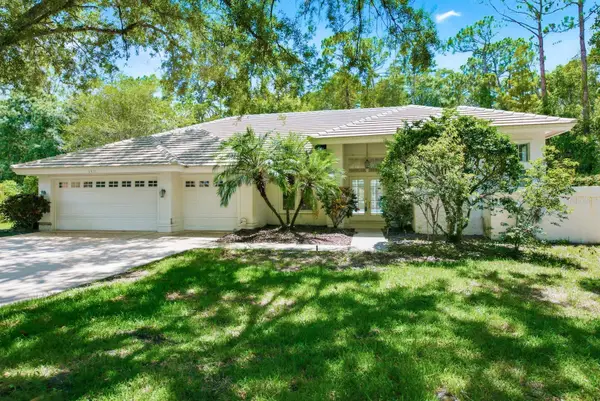
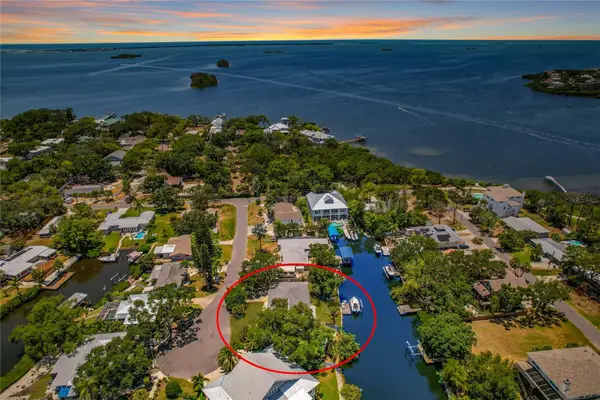
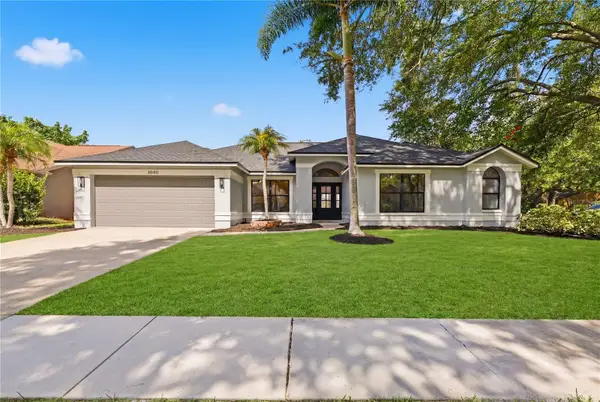 $750,000Active5 beds 3 baths2,492 sq. ft.
3040 Windridge Oaks Drive, PALM HARBOR, FL 34684
MLS# TB8528725Listed by: DALTON WADE INC - New
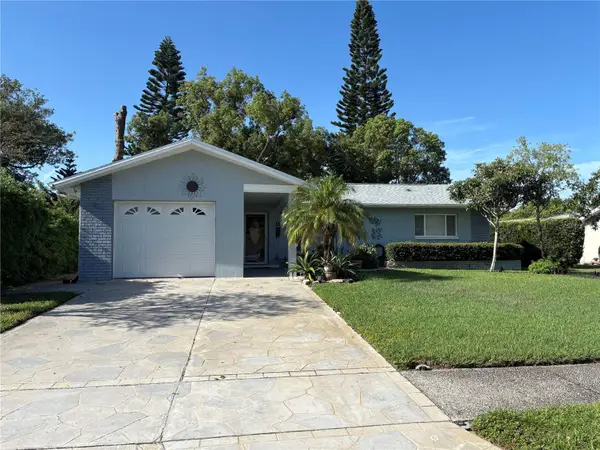
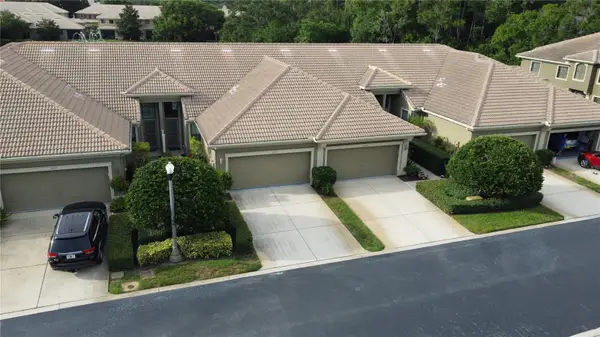
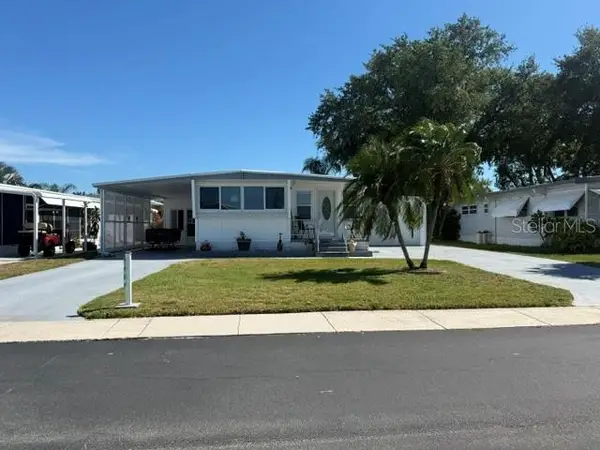
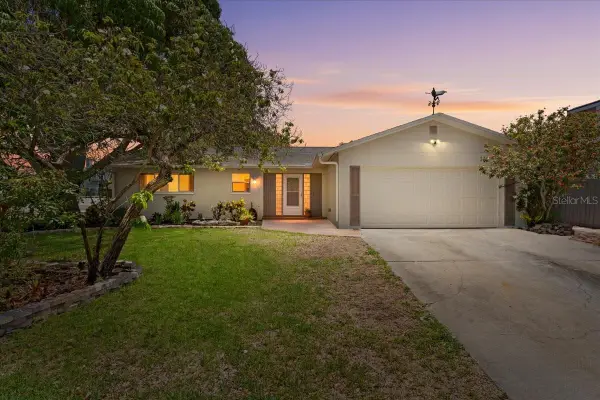
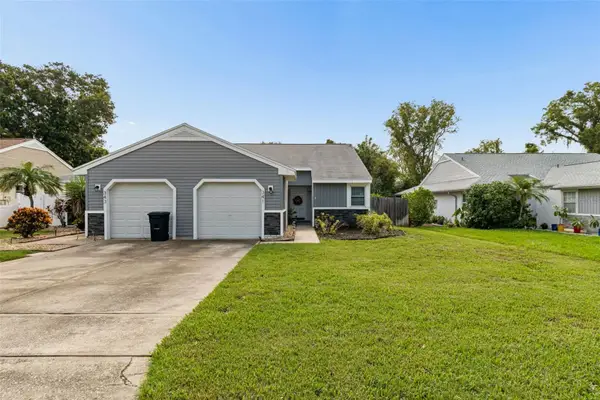 $250,000Active2 beds 1 baths855 sq. ft.
341 Hibiscus Drive, PALM HARBOR, FL 34684
MLS# TB8528121Listed by: GULF SHORES REALTY ERA POWERED LLC - New
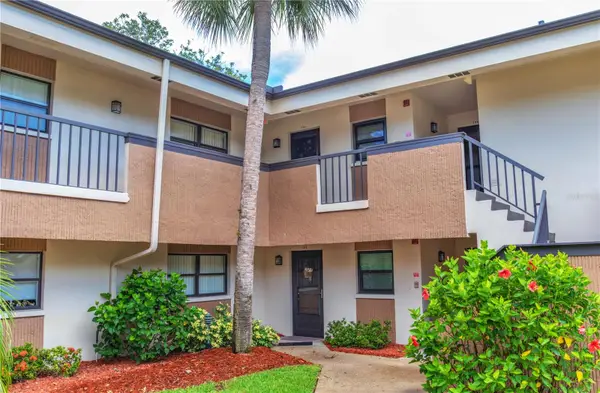
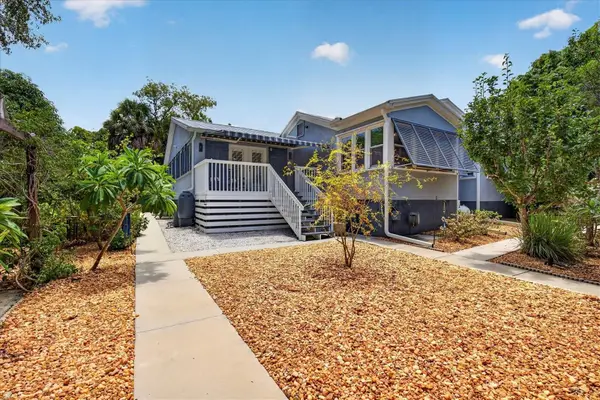
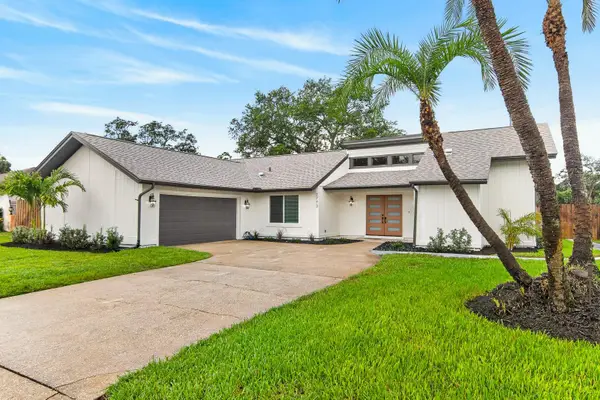
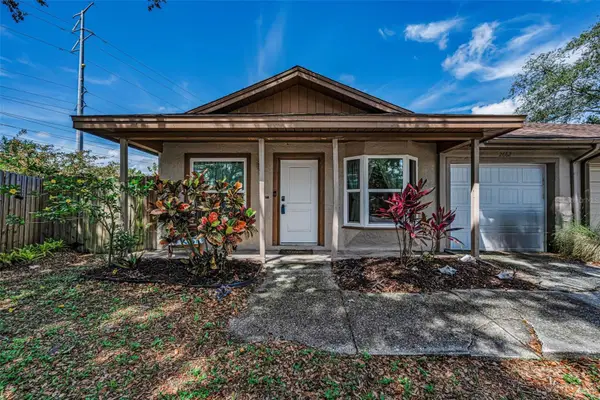
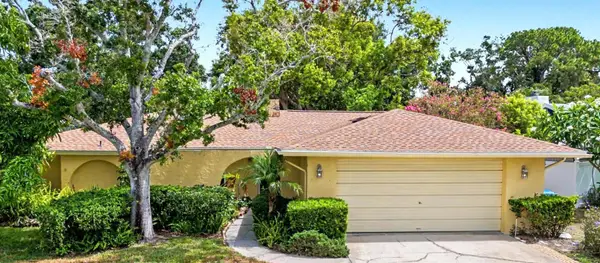 $465,000Active2 beds 2 baths1,228 sq. ft.
1100 Persimmon Drive, PALM HARBOR, FL 34683
MLS# TB8523875Listed by: MIHARA & ASSOCIATES INC. - New
 $184,900Active2 beds 2 baths1,038 sq. ft.
1882 Pine Ridge Way W #C2, PALM HARBOR, FL 34684
MLS# TB8528807Listed by: KELLER WILLIAMS REALTY- PALM HARBOR - Open Sat, 12 to 2pm
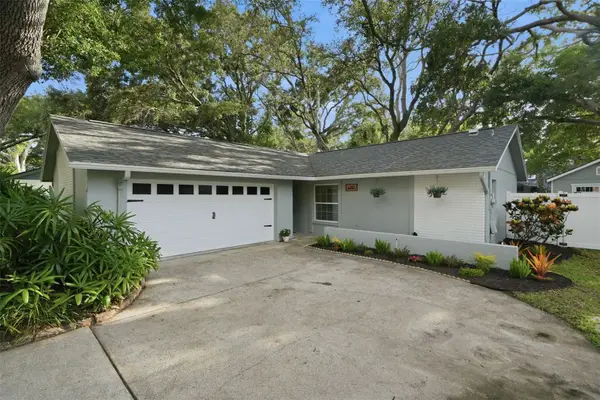
 $689,999Active4 beds 3 baths2,412 sq. ft.
2876 Lake Valencia Boulevard E, PALM HARBOR, FL 34684
MLS# TB8525279Listed by: CHARLES RUTENBERG REALTY INC - Open Sat, 12 to 2pm$689,999Active4 beds 3 baths2,412 sq. ft.
2876 Lake Valencia Boulevard E, PALM HARBOR, FL 34684
MLS# TB8525279Listed by: CHARLES RUTENBERG REALTY INC - Open Sat, 12 to 2pm$689,999Active4 beds 3 baths2,412 sq. ft.
2876 Lake Valencia Boulevard E, PALM HARBOR, FL 34684
MLS# TB8525279Listed by: CHARLES RUTENBERG REALTY INC - Open Sat, 12 to 2pm$689,999Active4 beds 3 baths2,412 sq. ft.
2876 Lake Valencia Boulevard E, PALM HARBOR, FL 34684
MLS# TB8525279Listed by: CHARLES RUTENBERG REALTY INC - New
 $159,000Active2 beds 2 baths1,095 sq. ft.
161 Hickory Gate Drive, PALM HARBOR, FL 34684
MLS# TB8529193Listed by: CHARLES RUTENBERG REALTY INC - New
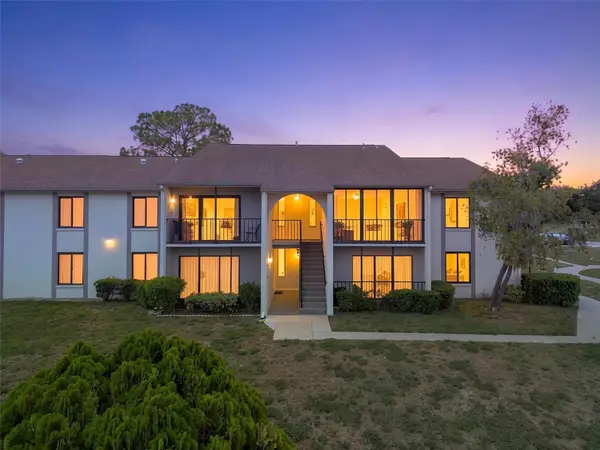
 $775,000Active3 beds 3 baths2,324 sq. ft.
602 Ozona Village Drive, PALM HARBOR, FL 34683
MLS# TB8529021Listed by: PREMIER SOTHEBYS INTL REALTY - New
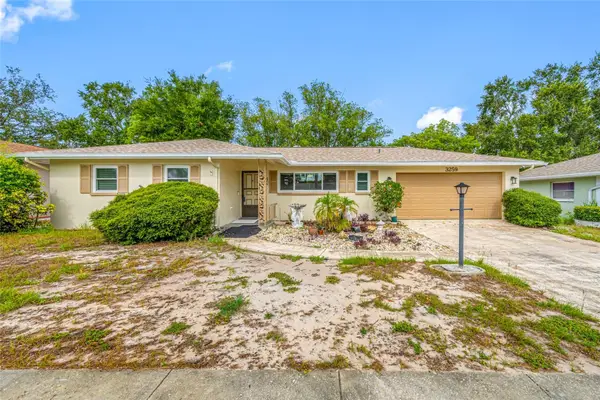 $330,000Active2 beds 2 baths1,158 sq. ft.
3259 Parkway Place, PALM HARBOR, FL 34684
MLS# TB8528743Listed by: PREMIER REALTY OF TAMPA - New
 $185,000Active0.13 Acres
Avery Avenue, CRYSTAL BEACH, FL 34681
MLS# TB8528987Listed by: COLDWELL BANKER REALTY - New
 $475,000Active3 beds 2 baths1,624 sq. ft.
324 Sweetgum Court, PALM HARBOR, FL 34683
MLS# TB8528926Listed by: COASTAL PROPERTIES GROUP INTERNATIONAL  $780,000Pending4 beds 2 baths2,234 sq. ft.
1822 Pipers Meadow Drive, PALM HARBOR, FL 34683
MLS# TB8528681Listed by: KELLER WILLIAMS REALTY- PALM HARBOR- New
 $373,000Active3 beds 2 baths1,588 sq. ft.
627 Crystal Dr, PALM HARBOR, FL 34683
MLS# TB8528554Listed by: BLAKE REAL ESTATE INC 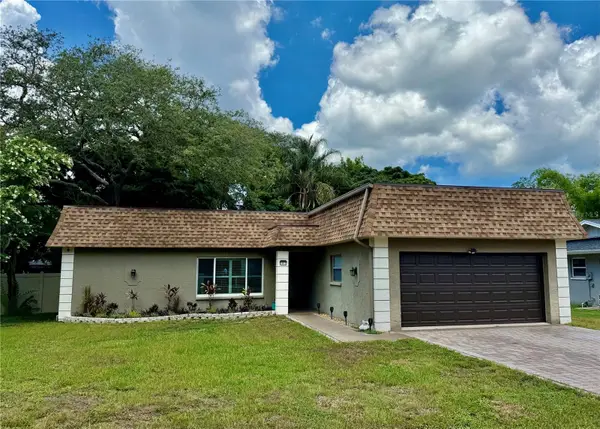 $510,000Active3 beds 2 baths1,609 sq. ft.
1011 Winding Oaks Drive, PALM HARBOR, FL 34683
MLS# TB8525903Listed by: DUNEDIN LIFE REALTY- New
 $379,000Active2 beds 2 baths1,230 sq. ft.
133 Stafford Circle, PALM HARBOR, FL 34684
MLS# TB8528365Listed by: CHARLES RUTENBERG REALTY INC - New
 $138,000Active2 beds 2 baths1,000 sq. ft.
2700 Nebraska Avenue #2-205, PALM HARBOR, FL 34684
MLS# W7887566Listed by: BHHS FLORIDA PROPERTIES GROUP 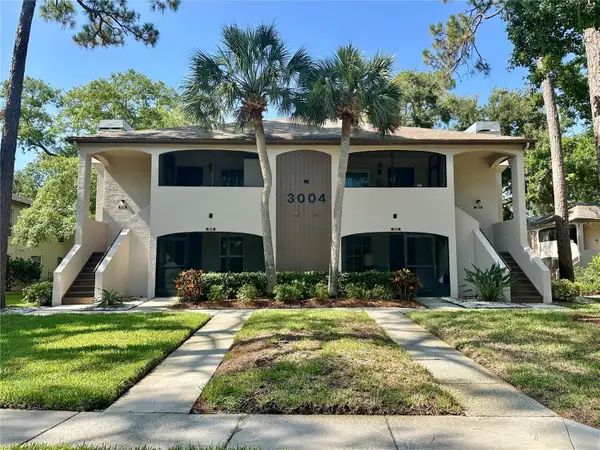 $184,900Active2 beds 2 baths900 sq. ft.
3004 Bonaventure Circle #102, PALM HARBOR, FL 34684
MLS# TB8525348Listed by: KRKJ PARADISE REAL ESTATE, LLC- $184,900Active2 beds 2 baths900 sq. ft.
3004 Bonaventure Circle #102, PALM HARBOR, FL 34684
MLS# TB8525348Listed by: KRKJ PARADISE REAL ESTATE, LLC - $184,900Active2 beds 2 baths900 sq. ft.
3004 Bonaventure Circle #102, PALM HARBOR, FL 34684
MLS# TB8525348Listed by: KRKJ PARADISE REAL ESTATE, LLC - $184,900Active2 beds 2 baths900 sq. ft.
3004 Bonaventure Circle #102, PALM HARBOR, FL 34684
MLS# TB8525348Listed by: KRKJ PARADISE REAL ESTATE, LLC - New
 $1,795,000Active6 beds 6 baths5,825 sq. ft.
967 Pine Hill Road, PALM HARBOR, FL 34683
MLS# TB8528233Listed by: CHARLES RUTENBERG REALTY INC - New
 $284,900Active3 beds 2 baths950 sq. ft.
3251 Latana Drive, PALM HARBOR, FL 34684
MLS# TB8526166Listed by: KELLER WILLIAMS ST PETE REALTY - New
 $599,000Active3 beds 2 baths2,028 sq. ft.
670 Sparrow Avenue, PALM HARBOR, FL 34683
MLS# TB8528356Listed by: MIHARA & ASSOCIATES INC. - New
 $354,000Active2 beds 2 baths1,353 sq. ft.
1491 Mahogany Lane #1491, PALM HARBOR, FL 34683
MLS# TB8527891Listed by: HOMEFRONT REALTY - New
 $389,500Active3 beds 2 baths1,160 sq. ft.
3751 Mackenzie Court, PALM HARBOR, FL 34684
MLS# TB8528169Listed by: LIFES A BEACH REAL ESTATE - New
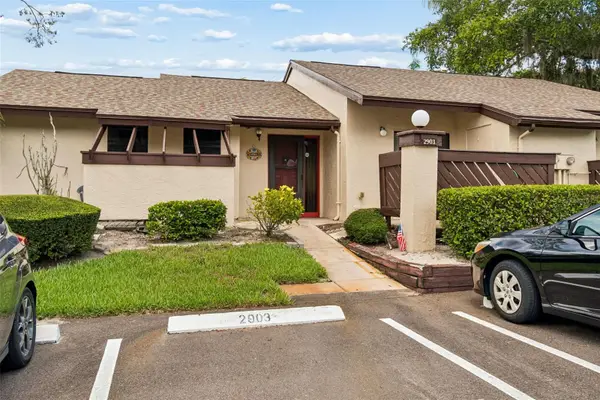
 $249,500Active2 beds 4 baths976 sq. ft.
3121 Beecher Drive E #D, PALM HARBOR, FL 34683
MLS# TB8528258Listed by: CENTURY 21 COAST TO COAST - New
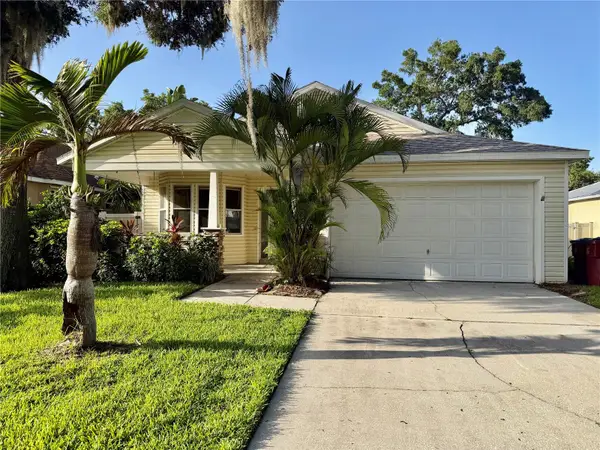
 $730,000Active4 beds 3 baths2,363 sq. ft.
1776 Wood Thrush Way, PALM HARBOR, FL 34683
MLS# TB8526892Listed by: LPT REALTY, LLC - Open Sun, 2 to 4pmNew
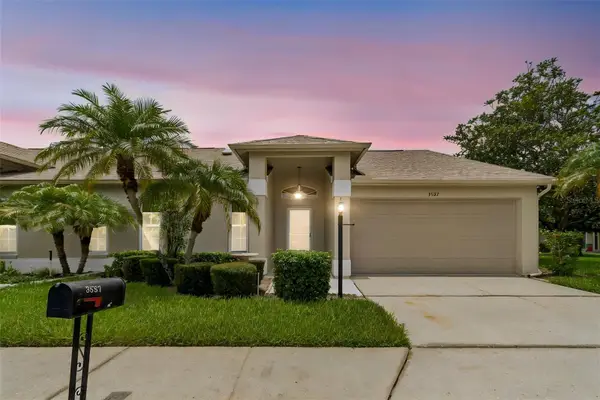 $335,000Active2 beds 2 baths1,280 sq. ft.
3537 Birkdale Lane, PALM HARBOR, FL 34684
MLS# TB8526264Listed by: BHHS FLORIDA PROPERTIES GROUP - New
 $349,900Active2 beds 2 baths1,191 sq. ft.
1520 Kenmore Court, PALM HARBOR, FL 34684
MLS# TB8527579Listed by: COLDWELL BANKER REALTY - New
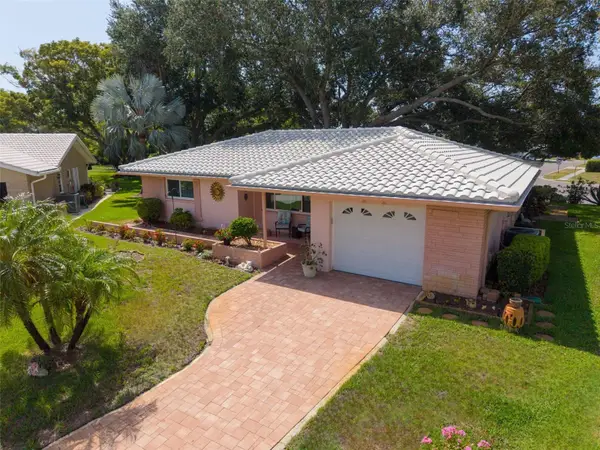
 $249,916Active2 beds 2 baths1,120 sq. ft.
2903 Fig Court, PALM HARBOR, FL 34684
MLS# TB8526998Listed by: KELLER WILLIAMS REALTY- PALM HARBOR - New
 $459,900Active3 beds 2 baths1,596 sq. ft.
1580 Pennsylvania Avenue, PALM HARBOR, FL 34683
MLS# TB8527392Listed by: CHARLES RUTENBERG REALTY INC - New
 $299,900Active3 beds 2 baths996 sq. ft.
72 Lake Shore Drive, PALM HARBOR, FL 34684
MLS# TB8526702Listed by: PREMIER SOTHEBY'S INTL REALTY - New
 $215,000Active1 beds 1 baths610 sq. ft.
36750 Us Highway 19 N #20-117, PALM HARBOR, FL 34684
MLS# TB8527840Listed by: FLORIDA PROPERTIES DIVERSIFIED - New
 $485,000Active2 beds 2 baths1,208 sq. ft.
401 Dempsey Road, PALM HARBOR, FL 34683
MLS# TB8527057Listed by: COASTAL PROPERTIES GROUP INTERNATIONAL - New
 $274,900Active1 beds 1 baths825 sq. ft.
36750 Us Highway 19 N #03116, PALM HARBOR, FL 34684
MLS# TB8527297Listed by: GOLF HOST SECURITIES INC - New
 $499,000Active3 beds 2 baths1,789 sq. ft.
201 Arbor Glen Drive, PALM HARBOR, FL 34683
MLS# TB8527744Listed by: LIPPLY REAL ESTATE - Open Sat, 1 to 3pmNew
 $995,000Active4 beds 4 baths3,220 sq. ft.
126 Old Oak Circle, PALM HARBOR, FL 34683
MLS# TB8526254Listed by: CHARLES RUTENBERG REALTY INC - New
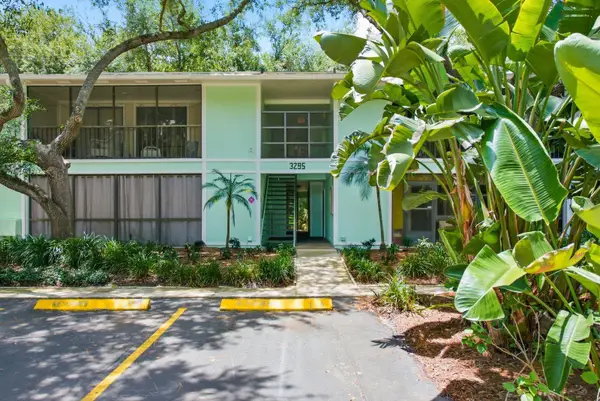 $162,900Active2 beds 2 baths825 sq. ft.
3295 Fox Chase Circle N #207, PALM HARBOR, FL 34683
MLS# TB8527844Listed by: KELLER WILLIAMS REALTY- PALM HARBOR  $205,900Active1 beds 1 baths610 sq. ft.
36750 Us Highway 19 N #20-209, PALM HARBOR, FL 34684
MLS# TB8525940Listed by: FLORIDA PROPERTIES DIVERSIFIED- Open Sat, 1am to 3pmNew
 $625,000Active3 beds 2 baths1,962 sq. ft.
4733 Lake Valencia Boulevard W, PALM HARBOR, FL 34684
MLS# TB8525852Listed by: COLDWELL BANKER REALTY - Open Thu, 5 to 7pmNew
 $745,000Active4 beds 3 baths2,826 sq. ft.
3951 Brightside Lane, PALM HARBOR, FL 34685
MLS# TB8527644Listed by: KELLER WILLIAMS REALTY- PALM HARBOR - New
 $365,000Active2 beds 2 baths1,234 sq. ft.
2543 Gloriosa Drive, PALM HARBOR, FL 34684
MLS# TB8525115Listed by: THE REAL ESTATE RX BROKERAGE, LLC - New
 $799,400Active3 beds 3 baths2,815 sq. ft.
2809 Fleeman Road, PALM HARBOR, FL 34683
MLS# TB8527738Listed by: COASTAL PROPERTIES GROUP INTERNATIONAL - New
 $185,000Active2 beds 2 baths1,000 sq. ft.
1227 Queen Anne Drive #A, PALM HARBOR, FL 34684
MLS# TB8526186Listed by: KELLER WILLIAMS REALTY- PALM HARBOR - New
 $659,700Active4 beds 3 baths2,276 sq. ft.
3848 Tarian Court, PALM HARBOR, FL 34684
MLS# TB8527682Listed by: BHHS FLORIDA PROPERTIES GROUP - New
 $879,900Active4 beds 3 baths2,600 sq. ft.
2899 Turtle Terrace, PALM HARBOR, FL 34683
MLS# TB8517900Listed by: SELECT PROPERTIES INC - New
 $500,000Active3 beds 3 baths2,454 sq. ft.
3550 Rolando Drive, PALM HARBOR, FL 34683
MLS# TB8526027Listed by: COLDWELL BANKER REALTY - New
 $599,000Active3 beds 2 baths2,299 sq. ft.
4831 Blue Jay Circle, PALM HARBOR, FL 34683
MLS# TB8527379Listed by: COLDWELL BANKER REALTY - Open Sat, 12 to 2pm
 $380,000Active2 beds 2 baths1,504 sq. ft.
182 Sunward Avenue, PALM HARBOR, FL 34684
MLS# TB8524727Listed by: COLDWELL BANKER REALTY - New
 $440,000Active2 beds 2 baths938 sq. ft.
136 Maryland Avenue, PALM HARBOR, FL 34683
MLS# W7886856Listed by: FUTURE HOME REALTY INC - New
 $359,900Active2 beds 2 baths1,332 sq. ft.
3215 Mcmath Drive, PALM HARBOR, FL 34684
MLS# TB8526316Listed by: BLAKE REAL ESTATE INC  $118,500Active1 beds 1 baths636 sq. ft.
3097 Mission Grove Drive, PALM HARBOR, FL 34684
MLS# TB8525428Listed by: COLDWELL BANKER REALTY- New
 $549,000Active4 beds 2 baths1,542 sq. ft.
60 Durham Court, PALM HARBOR, FL 34683
MLS# TB8526112Listed by: SANCTUARY REAL ESTATE GROUP, LLC - New
 $260,000Active2 beds 3 baths1,344 sq. ft.
2626 2nd Court, PALM HARBOR, FL 34684
MLS# TB8526486Listed by: COASTAL PROPERTIES GROUP INTERNATIONAL - New
 $275,000Active2 beds 3 baths1,080 sq. ft.
2217 Tuscany Trace #7, PALM HARBOR, FL 34683
MLS# TB8526469Listed by: COLDWELL BANKER REALTY - New
 $329,900Active2 beds 2 baths1,662 sq. ft.
3550 Oak Lake Drive, PALM HARBOR, FL 34684
MLS# TB8526542Listed by: HOYT REALTY - New
 $825,000Active3 beds 4 baths2,436 sq. ft.
675 S Vincent Street, CRYSTAL BEACH, FL 34681
MLS# O6421471Listed by: BEYCOME OF FLORIDA LLC - New
 $1,175,000Active3 beds 4 baths2,972 sq. ft.
383 Georgia Avenue, CRYSTAL BEACH, FL 34681
MLS# TB8526164Listed by: COASTAL PROPERTIES GROUP INTERNATIONAL - New
 $625,000Active3 beds 4 baths3,633 sq. ft.
1626 Lago Vista Boulevard, PALM HARBOR, FL 34685
MLS# TB8525134Listed by: FUTURE HOME REALTY INC - Open Sun, 1 to 3:30pmNew
 $485,000Active2 beds 2 baths1,481 sq. ft.
1861 Willow Oak Drive N, PALM HARBOR, FL 34683
MLS# TB8525926Listed by: RE/MAX REALTEC GROUP INC - New
 $555,000Active3 beds 2 baths2,411 sq. ft.
209 15th Street, PALM HARBOR, FL 34683
MLS# O6422541Listed by: MARK SPAIN REAL ESTATE - New
 $1,150,000Active4 beds 3 baths2,782 sq. ft.
404 Laurel Lane, PALM HARBOR, FL 34683
MLS# TB8525513Listed by: COASTAL PROPERTIES GROUP INTERNATIONAL - Open Sat, 1 to 3pm
 $649,900Active4 beds 2 baths1,859 sq. ft.
2773 Valencia Lane W, PALM HARBOR, FL 34684
MLS# TB8525901Listed by: INSTANT EQUITY REALTY 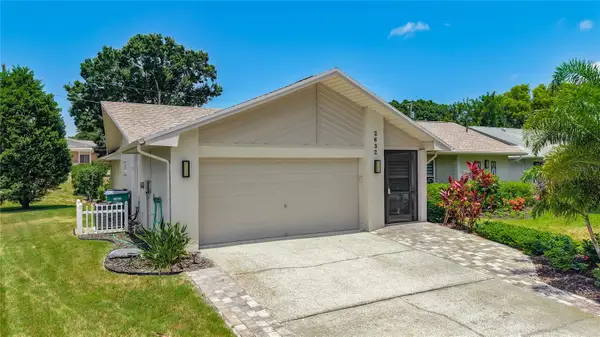 $449,000Active2 beds 2 baths1,754 sq. ft.
2632 Camille Drive, PALM HARBOR, FL 34684
MLS# TB8525654Listed by: FUTURE HOME REALTY INC $479,900Pending4 beds 3 baths1,718 sq. ft.
2931 Shannon Circle, PALM HARBOR, FL 34684
MLS# TB8525098Listed by: SOUTHERN LIFE REALTY $760,000Active4 beds 3 baths2,581 sq. ft.
751 House Wren Circle, PALM HARBOR, FL 34683
MLS# TB8521752Listed by: DALTON WADE INC $139,000Active2 beds 2 baths900 sq. ft.
4805 Alt 19 #114, PALM HARBOR, FL 34683
MLS# TB8525144Listed by: DALTON WADE INC- Open Sat, 12am to 2pm
 $199,777Active2 beds 2 baths960 sq. ft.
1131 Orange Tree Circle W #C, PALM HARBOR, FL 34684
MLS# TB8525462Listed by: FLORIDA LUXURY REALTY INC - Open Sat, 12 to 2pm
 $925,000Active3 beds 3 baths2,648 sq. ft.
266 Florida Boulevard, CRYSTAL BEACH, FL 34681
MLS# TB8525258Listed by: COLDWELL BANKER REALTY  $1,375,000Active0.45 Acres
Mayo Street, PALM HARBOR, FL 34683
MLS# TB8525595Listed by: BHHS FLORIDA PROPERTIES GROUP $459,900Active3 beds 2 baths1,500 sq. ft.
2321 Maben Avenue, PALM HARBOR, FL 34683
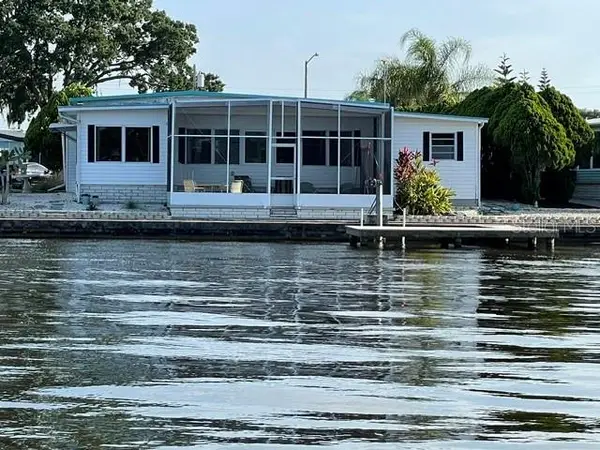
MLS# TB8525060Listed by: FILLMORE REAL ESTATE GROUP $5,000Active3 beds 3 baths1,703 sq. ft.
775 Wildflower Drive, Other, FL 34683
MLS# 620491Listed by: JAMIE BOONE, LLC- Open Sat, 12 to 2pm
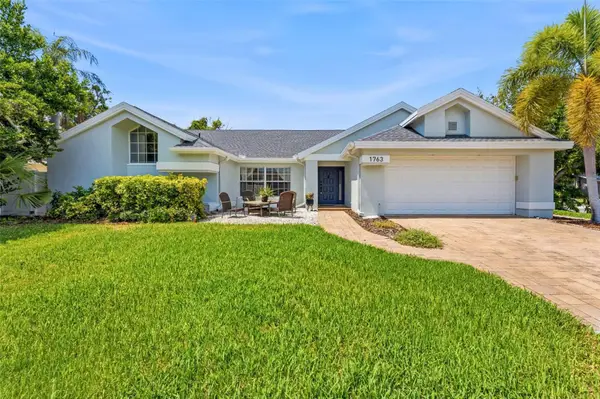 $575,000Active3 beds 3 baths2,095 sq. ft.
1763 Pebble Hill Court, PALM HARBOR, FL 34683
MLS# TB8525142Listed by: BLAKE REAL ESTATE INC 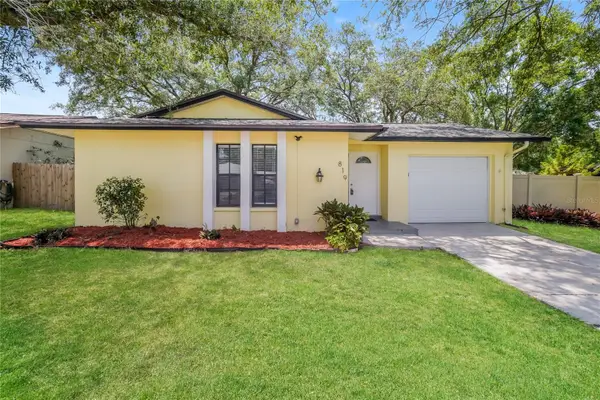 $355,000Pending3 beds 2 baths1,232 sq. ft.
819 Greenfield Drive, PALM HARBOR, FL 34684
MLS# C7527962Listed by: SOVEREIGN REAL ESTATE GROUP- Open Sun, 1 to 3pm
 $379,900Active2 beds 2 baths1,296 sq. ft.
271 Colonial Boulevard #11, PALM HARBOR, FL 34684
MLS# TB8525256Listed by: A BETTER WAY REALTY INC 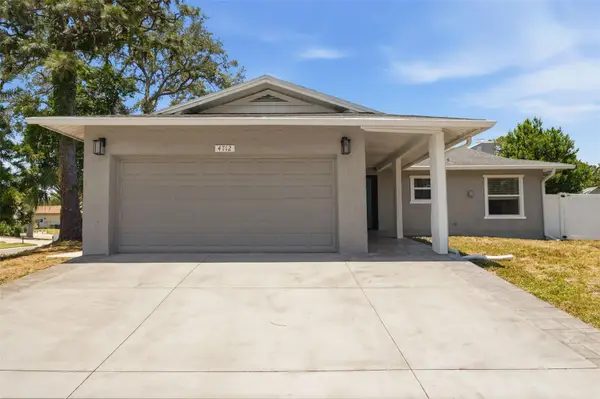 $419,900Active2 beds 2 baths1,423 sq. ft.
4712 Simcoe Street, PALM HARBOR, FL 34683
MLS# TB8524117Listed by: EZ CHOICE REALTY $614,900Active4 beds 3 baths2,219 sq. ft.
4882 W Breeze Circle, PALM HARBOR, FL 34683
MLS# TB8520481Listed by: KELLER WILLIAMS REALTY- PALM HARBOR $400,000Active3 beds 3 baths1,848 sq. ft.
302 Buckingham Place, PALM HARBOR, FL 34684
MLS# TB8525233Listed by: KELLER WILLIAMS REALTY- PALM HARBOR $899,900Active5 beds 4 baths3,764 sq. ft.
2800 Long Putt Court, PALM HARBOR, FL 34683
MLS# TB8524504Listed by: KELLER WILLIAMS REALTY- PALM HARBOR $815,000Active0.22 Acres
624 Mayo Street, CRYSTAL BEACH, FL 34681
MLS# TB8524982Listed by: COASTAL PROPERTIES GROUP INTERNATIONAL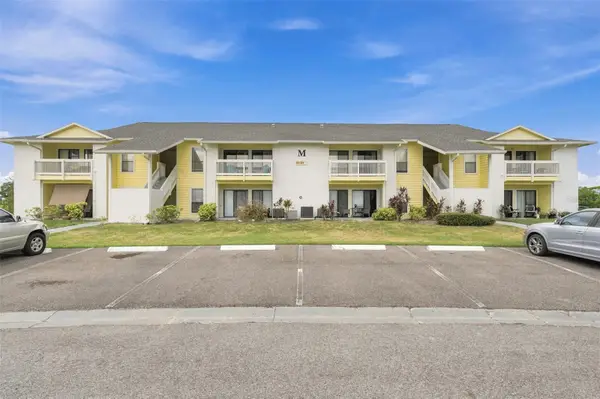 $119,000Active1 beds 1 baths705 sq. ft.
455 Alt 19 S #216, PALM HARBOR, FL 34683
MLS# TB8525123Listed by: RE/MAX COLLECTIVE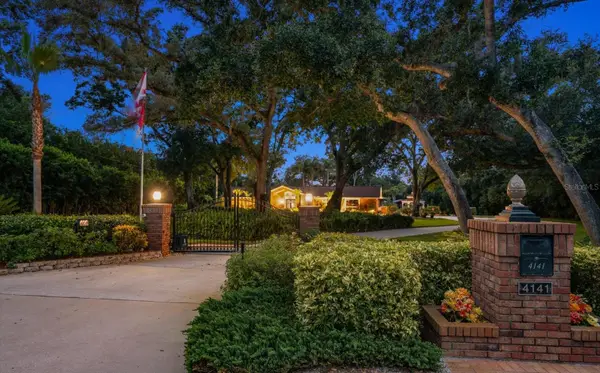 $2,200,000Active3 beds 3 baths3,766 sq. ft.
4141 Winding Willow Drive, PALM HARBOR, FL 34683
MLS# TB8520928Listed by: SMITH & ASSOCIATES REAL ESTATE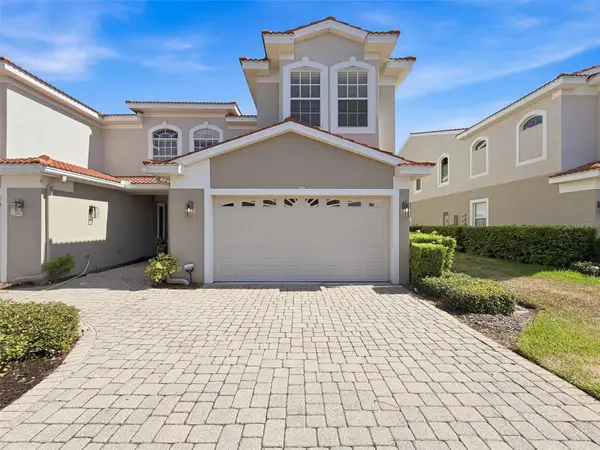 $548,000Pending3 beds 3 baths2,538 sq. ft.
937 Canino Court, PALM HARBOR, FL 34683
MLS# W7886855Listed by: VERANDA REALTY GROUP- Open Sat, 1 to 3pm
 $244,900Active2 beds 2 baths684 sq. ft.
294 Colonial Boulevard #48, PALM HARBOR, FL 34684
MLS# TB8525033Listed by: A BETTER WAY REALTY INC 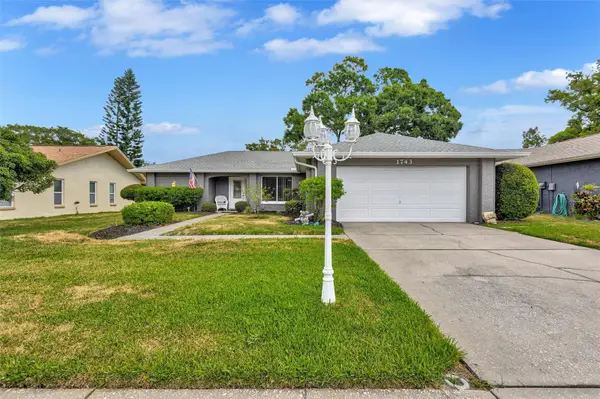 $465,000Active2 beds 2 baths1,642 sq. ft.
1743 Macdonnell Drive, PALM HARBOR, FL 34684
MLS# TB8524182Listed by: CHARLES RUTENBERG REALTY INC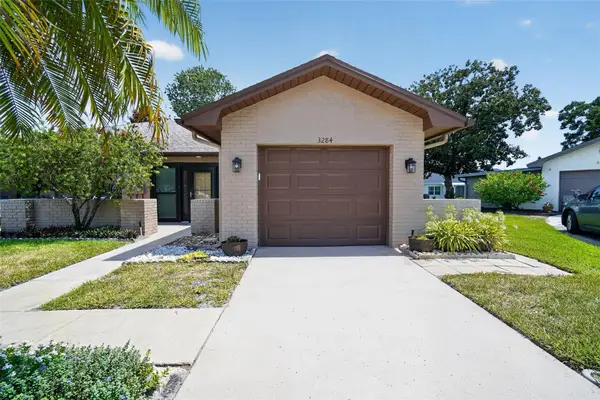 $325,000Active2 beds 2 baths1,148 sq. ft.
3284 Gorse Court, PALM HARBOR, FL 34684
MLS# O6419468Listed by: HOUWZER INC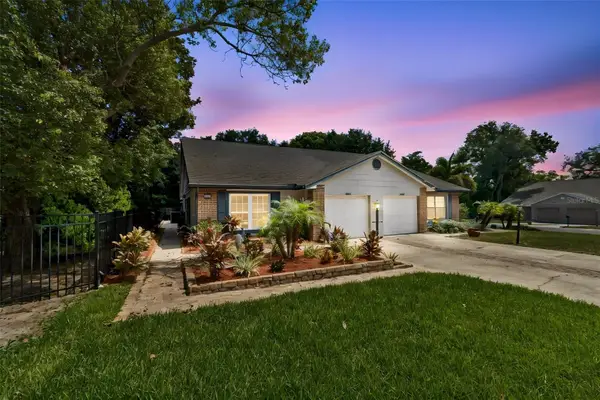 $370,000Pending3 beds 2 baths1,450 sq. ft.
2861 Whitehall Drive, PALM HARBOR, FL 34684
MLS# TB8522081Listed by: FUTURE HOME REALTY INC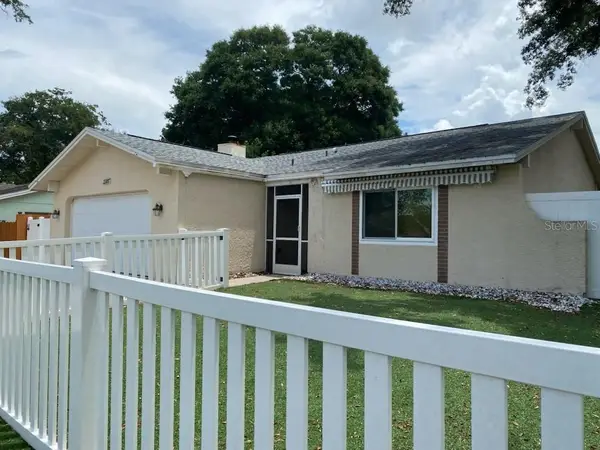 $525,000Active4 beds 4 baths1,944 sq. ft.
2107 Grove Valley, PALM HARBOR, FL 34683
MLS# TB8519682Listed by: NEW DIMENSIONS IN REAL EST INC $294,900Active2 beds 2 baths1,144 sq. ft.
150 Stafford Circle, PALM HARBOR, FL 34684
MLS# W7887077Listed by: INVESTMENT FLORIDA REALTY LLC $450,000Pending3 beds 2 baths1,642 sq. ft.
3068 E Dorchester Drive, PALM HARBOR, FL 34684
MLS# W7887179Listed by: REALTY EXECUTIVES AMERICA INC $1,799,000Active4 beds 3 baths3,062 sq. ft.
760 Seaview Drive, CRYSTAL BEACH, FL 34681
MLS# TB8521551Listed by: COUNTRY CLUB REALTY- Open Sat, 10am to 2pm
 $419,000Active3 beds 2 baths1,379 sq. ft.
1335 15th Street, PALM HARBOR, FL 34683
MLS# TB8523979Listed by: FUTURE HOME REALTY INC  $1,333,000Active3 beds 3 baths2,251 sq. ft.
121 Carlyle Drive, PALM HARBOR, FL 34683
MLS# TB8521898Listed by: BRADSHAW & BRADSHAW REALTY SER $175,000Active2 beds 2 baths1,121 sq. ft.
3313 Haviland Court #203, PALM HARBOR, FL 34684
MLS# TB8524059Listed by: FUTURE HOME REALTY INC $699,900Pending3 beds 3 baths2,187 sq. ft.
2034 Cindy Circle, PALM HARBOR, FL 34683
MLS# TB8523546Listed by: FUTURE HOME REALTY INC $630,000Active4 beds 2 baths2,226 sq. ft.
10 Linden Lane, PALM HARBOR, FL 34683
MLS# O6420486Listed by: BEYCOME OF FLORIDA LLC $456,800Active0.54 Acres
0 Pennsylvania Avenue, PALM HARBOR, FL 34683
MLS# TB8523517Listed by: DALTON WADE INC $479,900Active3 beds 2 baths1,826 sq. ft.
3960 Tarpon Pointe Circle, PALM HARBOR, FL 34684
MLS# TB8523574Listed by: COLDWELL BANKER REALTY $425,500Active3 beds 2 baths1,122 sq. ft.
1515 Nebraska Avenue, PALM HARBOR, FL 34683
MLS# TB8523842Listed by: RE/MAX REALTY UNLIMITED $375,000Pending3 beds 2 baths1,319 sq. ft.
2903 Macalpin Drive S, PALM HARBOR, FL 34684
MLS# TB8523134Listed by: COASTAL PROPERTIES GROUP INTERNATIONAL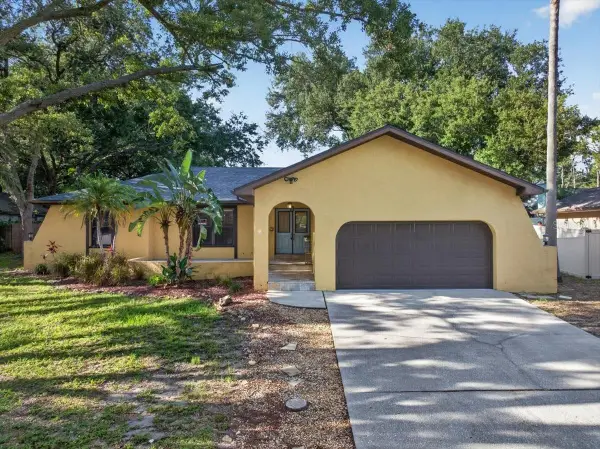 $623,000Active4 beds 3 baths2,240 sq. ft.
2883 Mandarin Place, PALM HARBOR, FL 34684
MLS# TB8521394Listed by: RE/MAX REALTEC GROUP INC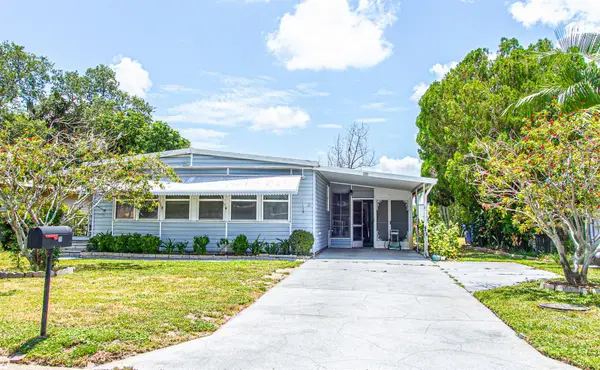 $118,000Active2 beds 2 baths1,248 sq. ft.
26 Hamilton Lane, PALM HARBOR, FL 34684
MLS# TB8521957Listed by: FUTURE HOME REALTY INC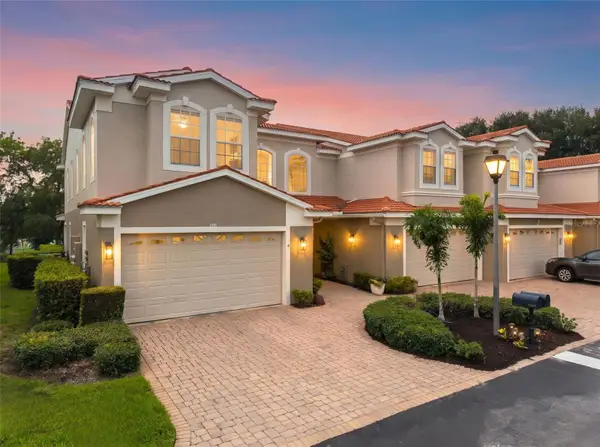 $539,900Active3 beds 3 baths2,409 sq. ft.
1460 Ribolla Drive, PALM HARBOR, FL 34683
MLS# TB8522358Listed by: COLDWELL BANKER REALTY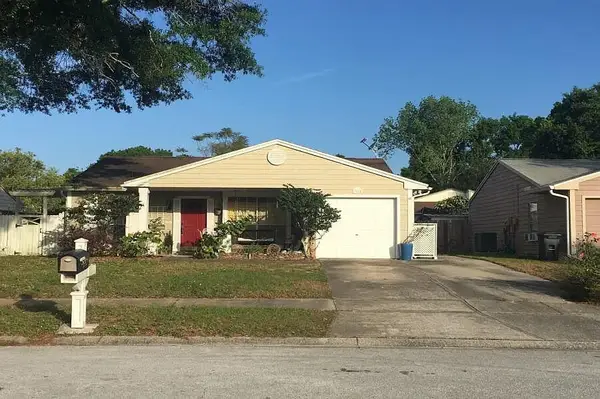 $5,000Active3 beds 2 baths1,343 sq. ft.
3864 Regent Drive, Other, FL 34683
MLS# 620418Listed by: JAMIE BOONE, LLC $220,000Active1 beds 1 baths814 sq. ft.
2735 Sherbrooke Lane #C, PALM HARBOR, FL 34684
MLS# TB8523032Listed by: COLDWELL BANKER REALTY $189,000Active3 beds 2 baths1,338 sq. ft.
215 Oak Circle, Other, FL 00N/A
MLS# 1006339Listed by: KELLER WILLIAMS REALTY FWB $438,900Active3 beds 2 baths1,475 sq. ft.
1529 E Dorchester Drive, PALM HARBOR, FL 34684
MLS# TB8518054Listed by: COASTAL PROPERTIES GROUP INTERNATIONAL $289,900Active2 beds 2 baths1,030 sq. ft.
2199 Chianti Place #9-0923, PALM HARBOR, FL 34683
MLS# TB8523061Listed by: DALTON WADE INC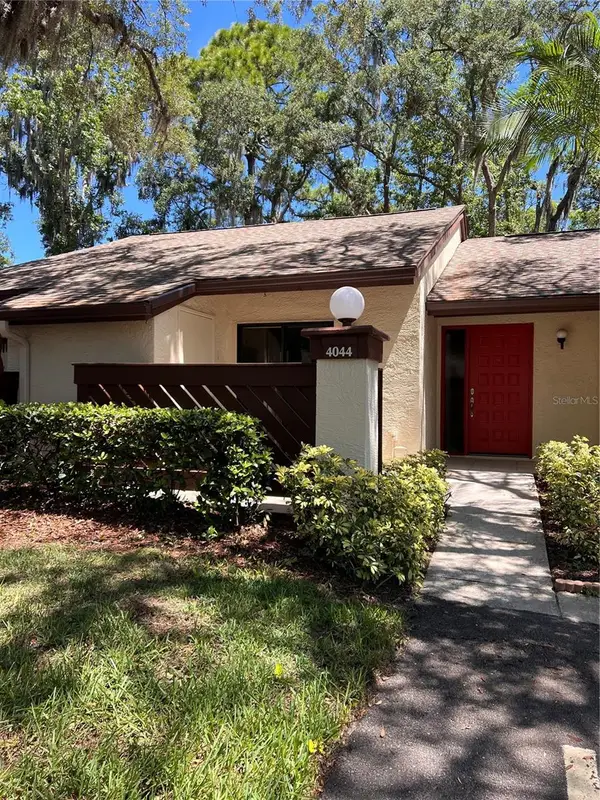 $298,000Active2 beds 2 baths1,120 sq. ft.
4044 Corkwood Court, PALM HARBOR, FL 34684
MLS# TB8510001Listed by: BAY REALTY GROUP INC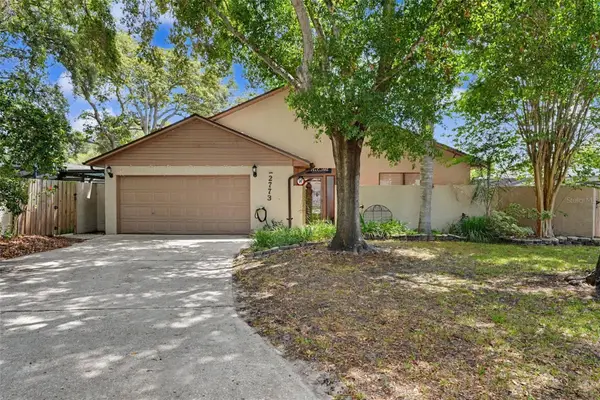 $625,000Active4 beds 3 baths1,903 sq. ft.
2773 Jeffrey Drive, PALM HARBOR, FL 34684
MLS# TB8522527Listed by: EXP REALTY LLC $599,000Active4 beds 2 baths2,025 sq. ft.
165 Woodcutter Lane, PALM HARBOR, FL 34683
MLS# TB8522654Listed by: LPT REALTY, LLC. $509,000Active3 beds 2 baths1,564 sq. ft.
203 Driftwood Drive W, PALM HARBOR, FL 34683
MLS# TB8523151Listed by: SMITH & ASSOCIATES REAL ESTATE $750,000Pending3 beds 2 baths2,136 sq. ft.
1131 Virginia Avenue, PALM HARBOR, FL 34683
MLS# TB8523210Listed by: COASTAL PROPERTIES GROUP INTERNATIONAL $1,600,000Active4 beds 4 baths3,613 sq. ft.
3781 Executive Drive, PALM HARBOR, FL 34685
MLS# W7887063Listed by: FUTURE HOME REALTY $3,550,000Active4 beds 4 baths3,401 sq. ft.
121 Augusta Avenue, PALM HARBOR, FL 34683
MLS# TB8521430Listed by: KELLER WILLIAMS REALTY- PALM HARBOR $1,750,000Active0.24 Acres
121 Augusta Avenue, PALM HARBOR, FL 34683
MLS# TB8521433Listed by: KELLER WILLIAMS REALTY- PALM HARBOR- Open Sat, 11am to 1pm
 $855,000Active4 beds 2 baths2,590 sq. ft.
3969 Talah Drive, PALM HARBOR, FL 34684
MLS# TB8522671Listed by: KELLER WILLIAMS TAMPA CENTRAL  $524,900Active3 beds 2 baths2,087 sq. ft.
2409 Osprey Avenue, PALM HARBOR, FL 34683
MLS# TB8521786Listed by: COASTAL PROPERTIES GROUP INTERNATIONAL $450,000Pending3 beds 2 baths1,684 sq. ft.
2521 Gulfbreeze Circle, PALM HARBOR, FL 34683
MLS# TB8520362Listed by: RE/MAX REALTEC GROUP INC $238,500Active2 beds 2 baths1,050 sq. ft.
1503 Lennox Road E #1503, PALM HARBOR, FL 34683
MLS# TB8522678Listed by: Y GROUP REALTY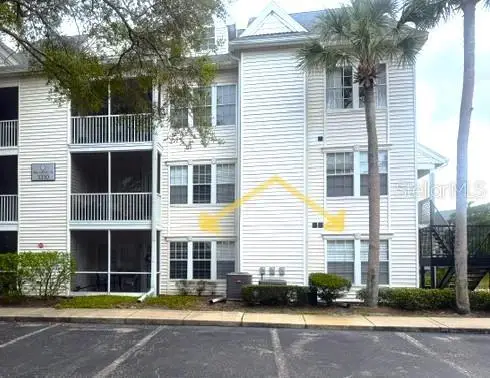 $199,000Pending2 beds 2 baths1,121 sq. ft.
3310 Haviland Court #104, PALM HARBOR, FL 34684
MLS# TB8521497Listed by: RE/MAX REALTEC GROUP INC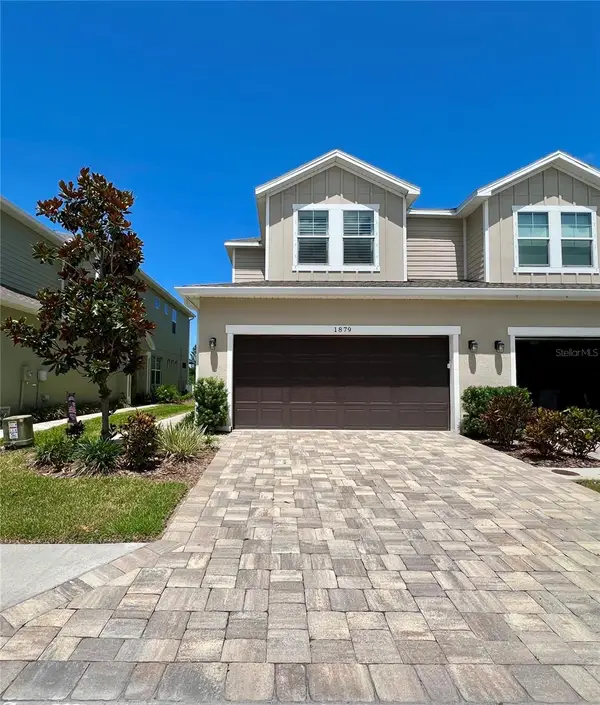 $579,900Pending3 beds 3 baths1,931 sq. ft.
1879 Trailside Drive, PALM HARBOR, FL 34683
MLS# TB8521719Listed by: ABI ROAD REALTY LLC $393,000Active3 beds 3 baths1,700 sq. ft.
477 Harbor Ridge Drive, PALM HARBOR, FL 34683
MLS# TB8521947Listed by: KEY PREMIER REALTY $250,000Active2 beds 2 baths1,416 sq. ft.
198 Philadelphia Boulevard #11, PALM HARBOR, FL 34684
MLS# TB8522227Listed by: OUT FAST REALTY & INVESTMENTS $769,000Active5 beds 3 baths3,060 sq. ft.
1125 Spanish Oaks Drive W, PALM HARBOR, FL 34683
MLS# TB8512699Listed by: TREASURED HOME COLLECTION $495,000Pending2 beds 3 baths1,316 sq. ft.
302 S Mayo Street, CRYSTAL BEACH, FL 34681
MLS# TB8520558Listed by: COASTAL PROPERTIES GROUP INTERNATIONAL $2,599,999Active4 beds 4 baths3,526 sq. ft.
119 Carlyle Circle, PALM HARBOR, FL 34683
MLS# TB8520908Listed by: CHARLES RUTENBERG REALTY INC- Open Sun, 12 to 3pm
 $450,000Active2 beds 2 baths964 sq. ft.
412 Pennsylvania Avenue, PALM HARBOR, FL 34683
MLS# TB8521846Listed by: COASTAL PROPERTIES GROUP INTERNATIONAL  $240,000Pending3 beds 2 baths1,298 sq. ft.
2917 Fig Court, PALM HARBOR, FL 34684
MLS# O6418991Listed by: COMPASS FLORIDA LLC $700,000Pending3 beds 3 baths2,344 sq. ft.
895 Whippoorwill Drive, PALM HARBOR, FL 34683
MLS# TB8519078Listed by: KELLER WILLIAMS SOUTH TAMPA $825,000Pending4 beds 3 baths2,336 sq. ft.
4703 Devonshire Boulevard, PALM HARBOR, FL 34685
MLS# TB8518529Listed by: RE/MAX ELITE REALTY $199,000Active2 beds 2 baths979 sq. ft.
2655 Pine Ridge Way N #D3, PALM HARBOR, FL 34684
MLS# W7886861Listed by: SANDPEAK REALTY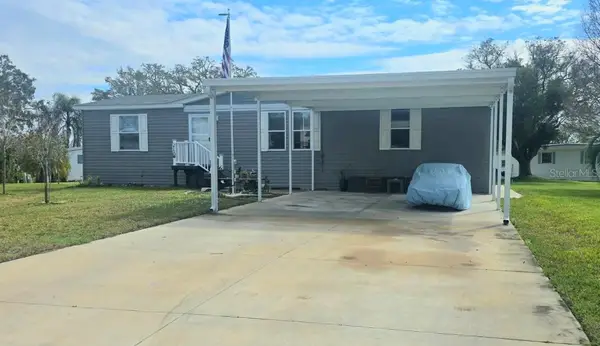 $314,900Active3 beds 2 baths1,512 sq. ft.
210 Philadelphia Court #17, PALM HARBOR, FL 34684
MLS# TB8520994Listed by: A BETTER WAY REALTY INC- Open Sat, 11am to 2pm
 $900,000Active4 beds 3 baths2,854 sq. ft.
136 Sheffield Circle E, PALM HARBOR, FL 34683
MLS# TB8512808Listed by: KELLER WILLIAMS REALTY- PALM H  $1,049,999Active5 beds 3 baths3,042 sq. ft.
3692 Johnathon Avenue, PALM HARBOR, FL 34685
MLS# TB8520892Listed by: RE/MAX REALTEC GROUP INC $349,900Active3 beds 3 baths1,485 sq. ft.
2384 Hounds Trail, PALM HARBOR, FL 34683
MLS# TB8521474Listed by: CHARLES RUTENBERG REALTY INC $259,000Pending2 beds 1 baths797 sq. ft.
2672 Megan Court, PALM HARBOR, FL 34684
MLS# TB8521448Listed by: RE/MAX ACTION FIRST OF FLORIDA $225,000Active3 beds 2 baths1,298 sq. ft.
2926 Star Apple Court, PALM HARBOR, FL 34684
MLS# TB8521358Listed by: COASTAL PROPERTIES GROUP INTERNATIONAL $189,000Active2 beds 2 baths1,000 sq. ft.
1009 Queen Anne Drive #B, PALM HARBOR, FL 34684
MLS# TB8520737Listed by: FILLMORE REAL ESTATE GROUP $725,000Pending4 beds 2 baths2,193 sq. ft.
631 House Wren Circle, PALM HARBOR, FL 34683
MLS# TB8520537Listed by: KELLER WILLIAMS REALTY- PALM HARBOR $599,900Active3 beds 3 baths2,026 sq. ft.
3948 Orchard Hill Circle, PALM HARBOR, FL 34684
MLS# A4697490Listed by: FINE PROPERTIES $559,000Active3 beds 3 baths1,759 sq. ft.
1564 Colony Court, PALM HARBOR, FL 34683
MLS# TB8520820Listed by: FUTURE HOME REALTY INC $875,000Pending4 beds 3 baths2,782 sq. ft.
2332 Waterview Court, PALM HARBOR, FL 34684
MLS# TB8520630Listed by: FUTURE HOME REALTY INC $219,000Active3 beds 2 baths1,520 sq. ft.
2844 Countrybrook Drive #12, PALM HARBOR, FL 34684
MLS# TB8521064Listed by: SEXAUER REAL ESTATE INTL. $639,900Pending3 beds 2 baths2,272 sq. ft.
2786 Valencia Lane W, PALM HARBOR, FL 34684
MLS# TB8520426Listed by: COLDWELL BANKER REALTY $499,000Active3 beds 2 baths1,616 sq. ft.
2437 Hawk Avenue, PALM HARBOR, FL 34683
MLS# W7886760Listed by: DALTON WADE INC- Open Sun, 11am to 1pm
 $199,000Active1 beds 2 baths893 sq. ft.
2205 Lennox Road E #2205, PALM HARBOR, FL 34683
MLS# TB8520366Listed by: COASTAL PROPERTIES GROUP INTERNATIONAL  $875,000Active4 beds 4 baths2,502 sq. ft.
141 Old Oak Circle, PALM HARBOR, FL 34683
MLS# TB8516934Listed by: EXP REALTY LLC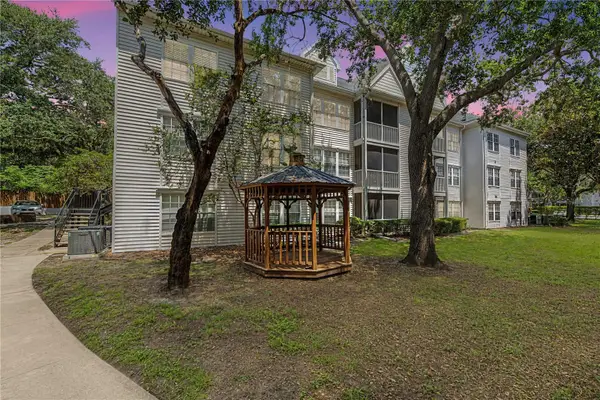 $274,900Active3 beds 2 baths1,579 sq. ft.
3266 Haviland Court #303, PALM HARBOR, FL 34684
MLS# TB8519429Listed by: RE/MAX REALTEC GROUP INC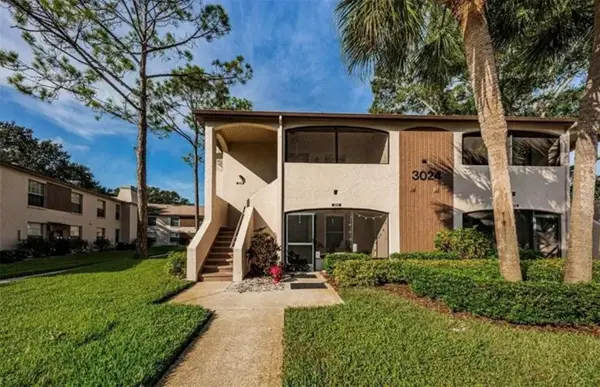 $214,999Active2 beds 2 baths900 sq. ft.
3024 Bonaventure Circle #204, PALM HARBOR, FL 34684
MLS# O6418238Listed by: BEYCOME OF FLORIDA LLC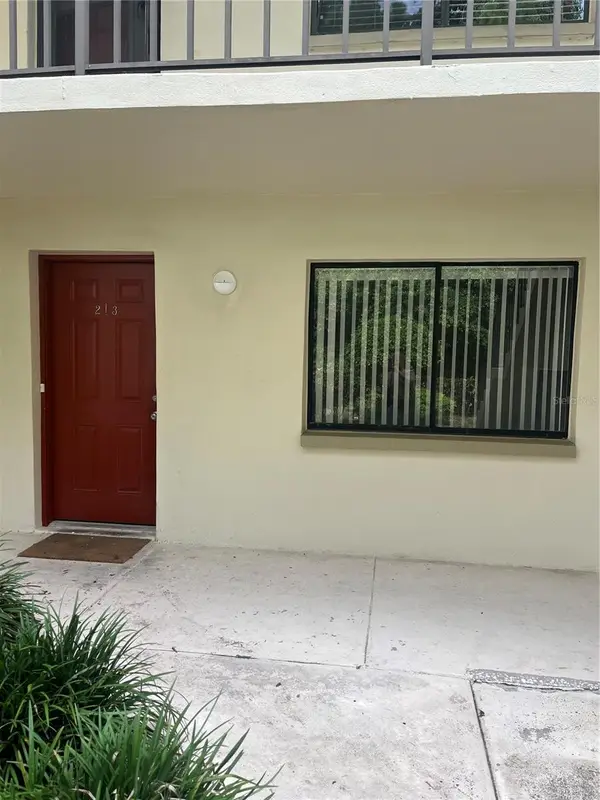 $189,000Active2 beds 2 baths871 sq. ft.
3300 Fox Chase Circle N #213, PALM HARBOR, FL 34683
MLS# TB8520932Listed by: CENTURY 21 ELITE LOCATIONS, INC $590,000Active3 beds 2 baths1,869 sq. ft.
1382 Sutton Place Drive, PALM HARBOR, FL 34683
MLS# W7886792Listed by: UPCHURCH REALTY LLC $299,900Active2 beds 2 baths1,148 sq. ft.
3277 Gorse Court, PALM HARBOR, FL 34684
MLS# TB8520177Listed by: SMITH & ASSOCIATES REAL ESTATE $865,900Active4 beds 3 baths2,684 sq. ft.
3909 Tarian Court, PALM HARBOR, FL 34684
MLS# TB8519770Listed by: COASTAL PROPERTIES GROUP INTERNATIONAL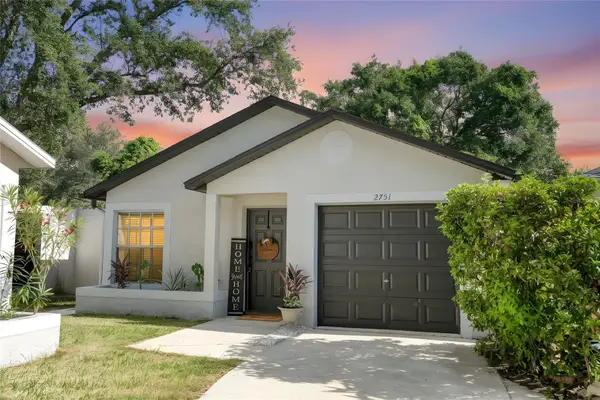 $359,900Active3 beds 2 baths1,124 sq. ft.
2751 Wilson Court, PALM HARBOR, FL 34684
MLS# TB8511417Listed by: CHARLES RUTENBERG REALTY INC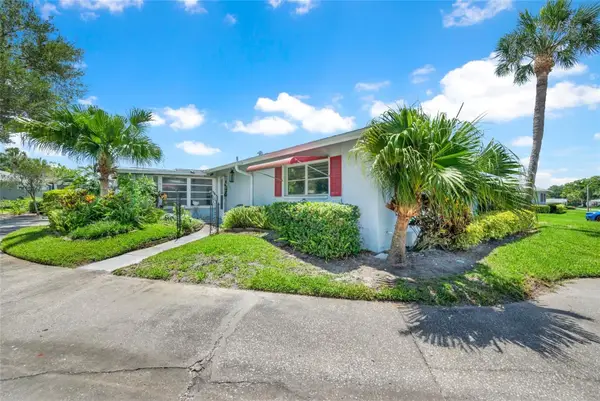 $212,000Active2 beds 2 baths1,000 sq. ft.
1608 Whitebridge Drive #B, PALM HARBOR, FL 34684
MLS# TB8512823Listed by: CHARLES RUTENBERG REALTY INC $1,099,000Pending4 beds 5 baths3,446 sq. ft.
3148 Autumn Drive, PALM HARBOR, FL 34683
MLS# TB8519833Listed by: KELLER WILLIAMS SOUTH SHORE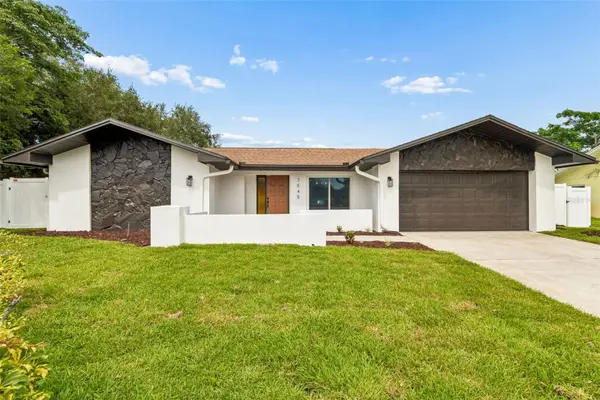 $624,900Pending3 beds 3 baths2,137 sq. ft.
3545 Snowy Egret Court, PALM HARBOR, FL 34683
MLS# TB8519089Listed by: KELLER WILLIAMS REALTY- PALM H $539,900Active4 beds 2 baths1,998 sq. ft.
970 Valley View Circle, PALM HARBOR, FL 34684
MLS# TB8520237Listed by: TROPICAL LIFE REALTY, INC. $584,600Active3 beds 2 baths1,517 sq. ft.
103 Carlyle Drive, PALM HARBOR, FL 34683
MLS# W7886706Listed by: ISLAND REAL EST&PROP MGMT INC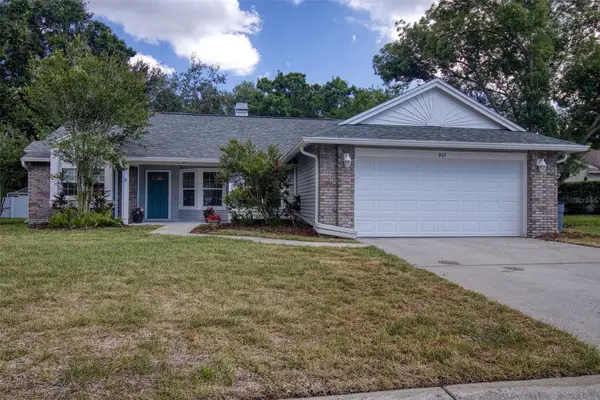 $549,900Pending3 beds 2 baths1,652 sq. ft.
957 Edgehill Drive, PALM HARBOR, FL 34684
MLS# TB8510478Listed by: COASTAL PROPERTIES GROUP INTERNATIONAL $199,900Active2 beds 2 baths918 sq. ft.
2261 Shelly Drive #D, PALM HARBOR, FL 34684
MLS# TB8503311Listed by: COLDWELL BANKER REALTY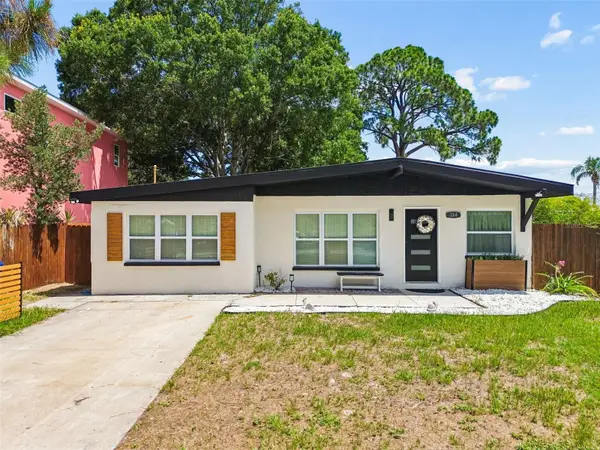 $440,000Active3 beds 2 baths1,332 sq. ft.
314 Indiana Avenue, CRYSTAL BEACH, FL 34681
MLS# TB8517747Listed by: COASTAL PROPERTIES GROUP INTERNATIONAL $279,500Active2 beds 1 baths788 sq. ft.
314 Maryland Avenue, CRYSTAL BEACH, FL 34681
MLS# TB8518397Listed by: COASTAL PROPERTIES GROUP INTERNATIONAL $248,900Active2 beds 2 baths1,125 sq. ft.
2262 Chianti Place #5-0511, PALM HARBOR, FL 34683
MLS# TB8517806Listed by: KELLER WILLIAMS REALTY- PALM H $115,000Pending1 beds 1 baths636 sq. ft.
3156 Highlands Boulevard #A, PALM HARBOR, FL 34684
MLS# TB8503348Listed by: COLDWELL BANKER REALTY $225,000Pending2 beds 3 baths1,161 sq. ft.
3323 Fox Hunt Drive, PALM HARBOR, FL 34683
MLS# TB8519475Listed by: SERENE HOMES REALTY $1,049,000Active4 beds 4 baths3,108 sq. ft.
3926 Saywood Court, PALM HARBOR, FL 34685
MLS# TB8514156Listed by: RE/MAX ACTION FIRST OF FLORIDA $106,000Pending1 beds 1 baths730 sq. ft.
2700 Nebraska Avenue #1-106, PALM HARBOR, FL 34684
MLS# TB8518751Listed by: IMPACT REALTY TAMPA BAY $349,900Active2 beds 2 baths1,330 sq. ft.
3259 Hilary Circle #1C, PALM HARBOR, FL 34684
MLS# TB8518759Listed by: RE/MAX REALTEC GROUP INC $225,000Pending2 beds 2 baths1,030 sq. ft.
2263 Bancroft Circle N #B, PALM HARBOR, FL 34683
MLS# TB8519047Listed by: BAYSIDE EXECUTIVE REALTY $1,299,900Pending5 beds 3 baths3,540 sq. ft.
3110 Harvest Moon Drive, PALM HARBOR, FL 34683
MLS# TB8518414Listed by: KEY LIME REAL ESTATE INC $485,000Pending2 beds 2 baths1,540 sq. ft.
135 Patty Ann Boulevard, PALM HARBOR, FL 34683
MLS# TB8516911Listed by: FUTURE HOME REALTY INC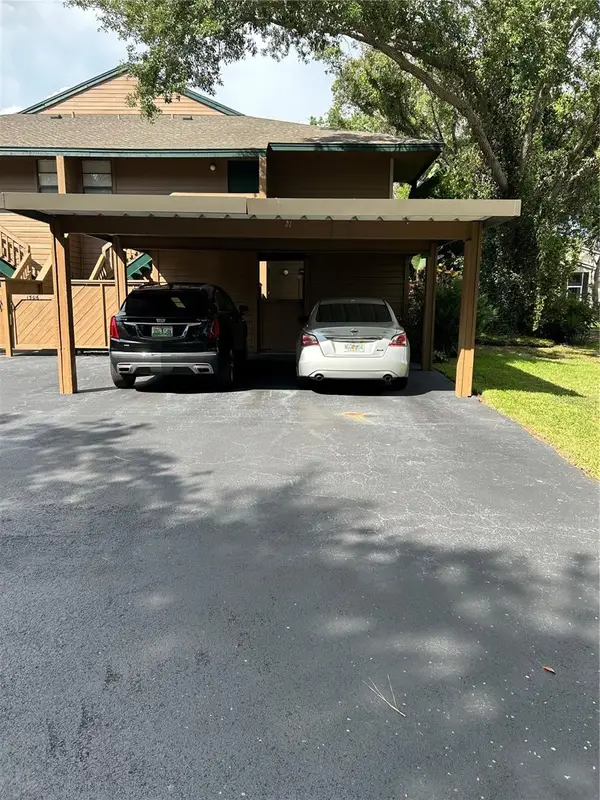 $239,900Active2 beds 2 baths1,050 sq. ft.
1505 Lennox Road E #1505, PALM HARBOR, FL 34683
MLS# TB8518788Listed by: GAP AND ASSOCIATES LLC $459,900Active2 beds 2 baths1,396 sq. ft.
381 Westwinds Drive, PALM HARBOR, FL 34683
MLS# TB8516559Listed by: LPT REALTY, LLC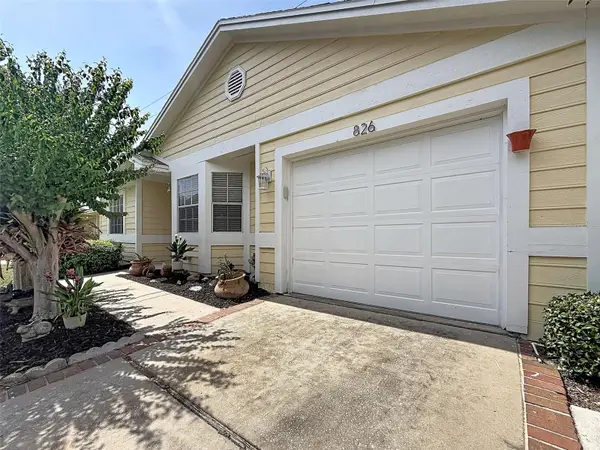 $399,900Pending3 beds 2 baths1,263 sq. ft.
826 Franklin Circle, PALM HARBOR, FL 34683
MLS# TB8517374Listed by: CHARLES RUTENBERG REALTY INC $450,000Active3 beds 2 baths1,506 sq. ft.
1320 Noell Boulevard, PALM HARBOR, FL 34683
MLS# C7527266Listed by: SOVEREIGN REAL ESTATE GROUP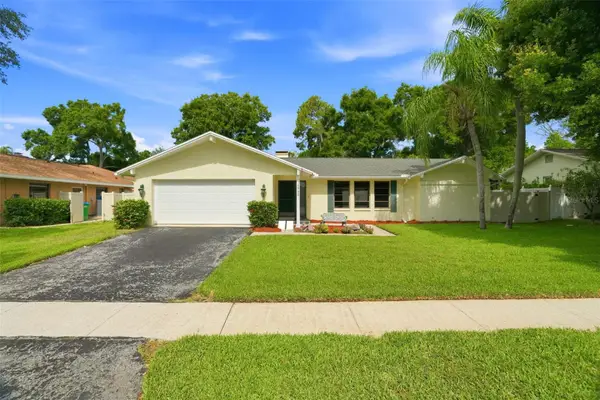 $529,000Active3 beds 2 baths1,933 sq. ft.
795 Hickory Lane, PALM HARBOR, FL 34683
MLS# TB8518129Listed by: SUNCOAST SHORES REALTY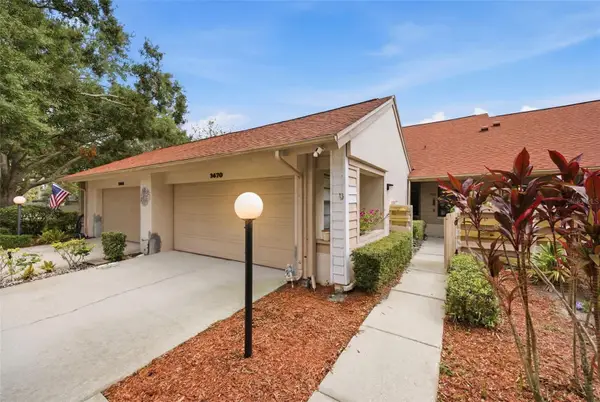 $369,900Active2 beds 2 baths1,620 sq. ft.
3670 Imperial Ridge Parkway, PALM HARBOR, FL 34684
MLS# TB8518578Listed by: KELLER WILLIAMS REALTY PORTFOLIO COLLECTION $1,249,000Active4 beds 3 baths3,163 sq. ft.
3459 Woodridge Parkway, PALM HARBOR, FL 34684
MLS# TB8518519Listed by: REAL BROKER, LLC $245,000Pending2 beds 3 baths1,344 sq. ft.
2763 5th Court, PALM HARBOR, FL 34684
MLS# W7886526Listed by: CHARLES RUTENBERG REALTY INC $829,999Active3 beds 3 baths2,221 sq. ft.
2831 Jarvis Circle, PALM HARBOR, FL 34683
MLS# TB8518166Listed by: SANCTUARY REAL ESTATE GROUP, LLC $179,000Active1 beds 1 baths530 sq. ft.
36750 Us Highway 19 N #4-224, PALM HARBOR, FL 34683
MLS# TB8517962Listed by: CENTURY 21 COASTAL ALLIANCE $450,000Pending2 beds 2 baths1,994 sq. ft.
2189 Oak Forest Lane, PALM HARBOR, FL 34683
MLS# W7886393Listed by: BHHS FLORIDA PROPERTIES GROUP $825,000Pending4 beds 3 baths3,152 sq. ft.
4878 W Breeze Circle, PALM HARBOR, FL 34683
MLS# TB8513262Listed by: CHARLES RUTENBERG REALTY INC- Open Sat, 2 to 4pm
 $389,000Active3 beds 3 baths1,700 sq. ft.
485 Harbor Ridge Drive, PALM HARBOR, FL 34683
MLS# TB8516650Listed by: PALM PARADISE REALTY GROUP  $374,900Active2 beds 1 baths879 sq. ft.
414 Tampa Road, PALM HARBOR, FL 34683
MLS# TB8510203Listed by: SOUTHERN LIFE REALTY $1,250,000Pending4 beds 5 baths4,047 sq. ft.
5022 Jewell Terrace, PALM HARBOR, FL 34685
MLS# TB8514551Listed by: RE/MAX REALTEC GROUP INC $499,400Pending3 beds 2 baths1,630 sq. ft.
1315 Westlake Boulevard, PALM HARBOR, FL 34683
MLS# TB8513223Listed by: COASTAL PROPERTIES GROUP INTERNATIONAL $269,000Active2 beds 2 baths1,230 sq. ft.
3351 Stonehaven Court W #C, PALM HARBOR, FL 34684
MLS# TB8516005Listed by: RAGSDALE RESIDENTIAL REALTY $575,000Active3 beds 3 baths2,409 sq. ft.
1340 Ribolla Drive, PALM HARBOR, FL 34683
MLS# TB8517236Listed by: REALTY OF RIVERVIEW LLC $199,999Active2 beds 1 baths855 sq. ft.
3165 Phlox Drive, PALM HARBOR, FL 34684
MLS# TB8517639Listed by: KELLER WILLIAMS REALTY- PALM H $599,444Pending4 beds 2 baths1,778 sq. ft.
4811 Klosterman Oaks Boulevard, PALM HARBOR, FL 34683
MLS# TB8517203Listed by: COASTAL PROPERTIES GROUP INTERNATIONAL $499,000Active3 beds 2 baths1,724 sq. ft.
341 Arbor Drive W, PALM HARBOR, FL 34683
MLS# TB8517549Listed by: KELLER WILLIAMS REALTY- PALM H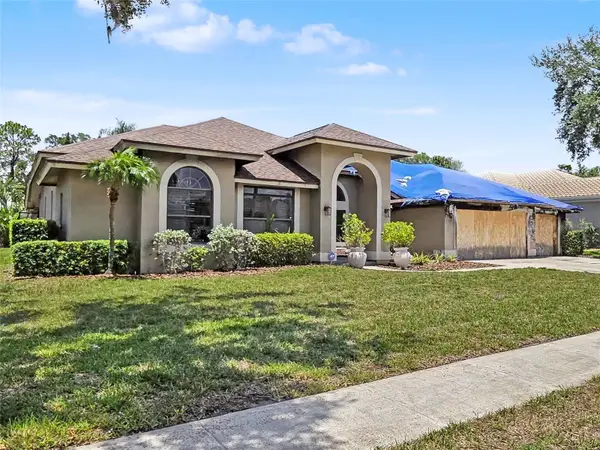 $195,000Pending4 beds 4 baths3,054 sq. ft.
3749 Embassy Circle, PALM HARBOR, FL 34685
MLS# TB8515844Listed by: AMERICAN HERITAGE REALTY, INC.- Open Sat, 11am to 3pm
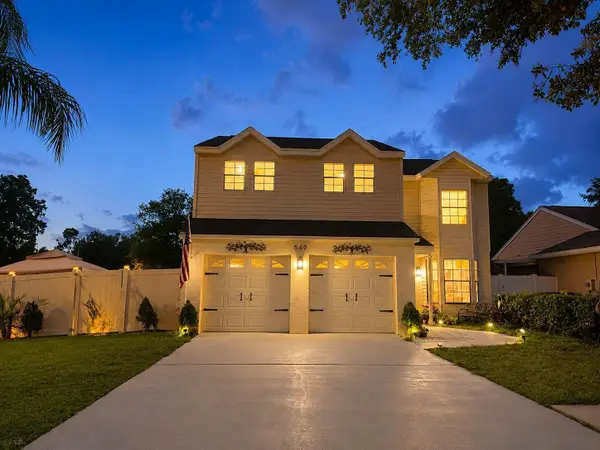 $569,900Active4 beds 3 baths2,111 sq. ft.
540 Sheridan Drive, Palm Harbor, FL 34684
MLS# R11154255Listed by: BEYCOME OF FLORIDA LLC  $620,000Active3 beds 3 baths2,090 sq. ft.
521 Meravan Drive, PALM HARBOR, FL 34683
MLS# TB8516343Listed by: ENGEL & VOLKERS BELLEAIR- Open Sun, 11am to 1pm
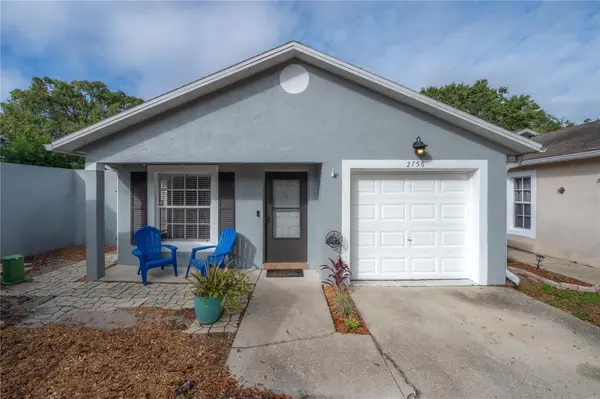 $370,000Active3 beds 2 baths1,124 sq. ft.
2756 Braham Court, PALM HARBOR, FL 34684
MLS# TB8517164Listed by: COMPASS FLORIDA LLC  $2,750,000Pending0.8 Acres
621 N Mayo Street, CRYSTAL BEACH, FL 34681
MLS# TB8515876Listed by: BHHS FLORIDA PROPERTIES GROUP $469,000Active3 beds 2 baths1,732 sq. ft.
999 Gillespie Drive, PALM HARBOR, FL 34684
MLS# TB8516714Listed by: CHARLES RUTENBERG REALTY INC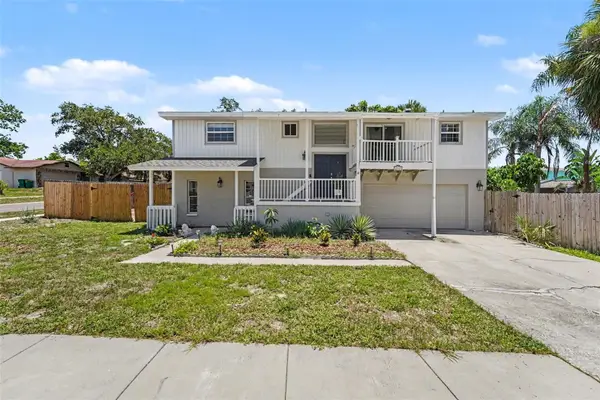 $520,000Active4 beds 3 baths2,175 sq. ft.
4941 Cardinal Trail, PALM HARBOR, FL 34683
MLS# TB8516860Listed by: MARK SPAIN REAL ESTATE- Open Sun, 1am to 3pm
 $899,900Active2 beds 2 baths1,625 sq. ft.
610 Indiana Avenue, CRYSTAL BEACH, FL 34681
MLS# TB8516703Listed by: EXIT BAYSHORE REALTY - Open Sat, 1:30am to 3:30pm
 $785,000Active3 beds 2 baths1,875 sq. ft.
502 Florida Boulevard, CRYSTAL BEACH, FL 34681
MLS# TB8516664Listed by: REALTY EXPERTS ASSOCIATES  $620,000Active3 beds 3 baths2,342 sq. ft.
1415 Tessano Place, PALM HARBOR, FL 34683
MLS# TB8516501Listed by: CHARLES RUTENBERG REALTY INC $499,999Active3 beds 2 baths1,642 sq. ft.
16 Citrus Drive, PALM HARBOR, FL 34684
MLS# TB8516471Listed by: QUICKSILVER REAL ESTATE GROUP $358,000Pending3 beds 3 baths1,930 sq. ft.
1485 Mahogany Lane #1602, PALM HARBOR, FL 34683
MLS# TB8511283Listed by: COASTAL PROPERTIES GROUP INTERNATIONAL $429,900Active3 beds 2 baths1,595 sq. ft.
2740 Hamble Village Lane, PALM HARBOR, FL 34684
MLS# TB8513520Listed by: CHARLES RUTENBERG REALTY INC $554,000Pending2 beds 2 baths1,963 sq. ft.
1166 Gillespie Drive, PALM HARBOR, FL 34684
MLS# TB8510527Listed by: RAGSDALE RESIDENTIAL REALTY $320,000Pending3 beds 2 baths1,414 sq. ft.
369 Westwinds Drive, PALM HARBOR, FL 34683
MLS# O6414218Listed by: BEYCOME OF FLORIDA LLC $155,000Active2 beds 2 baths1,008 sq. ft.
3301 Alt 19 #130, DUNEDIN, FL 34698
MLS# TB8515892Listed by: CVACH REAL ESTATE SERVICES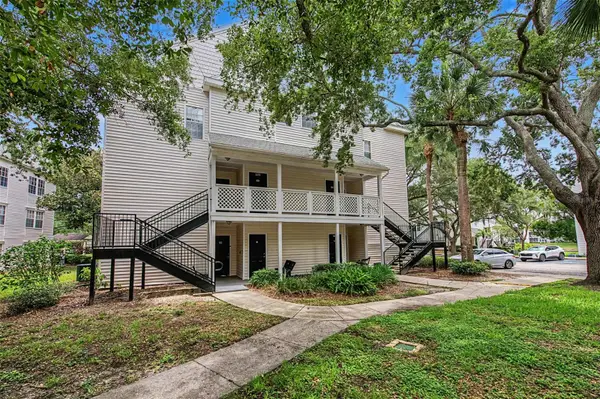 $219,900Active2 beds 2 baths1,491 sq. ft.
3270 Haviland Court #301, PALM HARBOR, FL 34684
MLS# TB8514357Listed by: RE/MAX REALTEC GROUP INC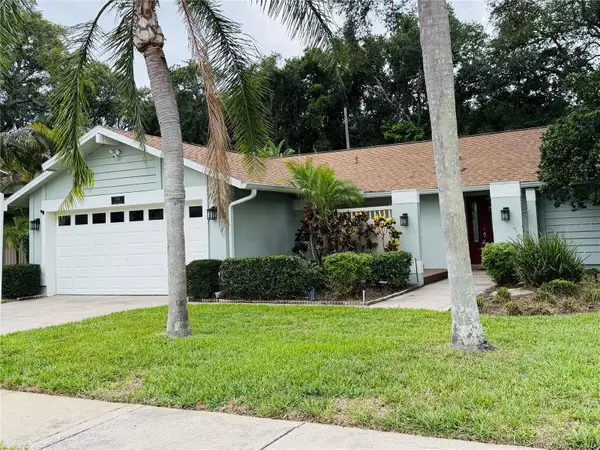 $525,000Pending3 beds 2 baths2,076 sq. ft.
4765 Lake Valencia Boulevard W, PALM HARBOR, FL 34684
MLS# TB8512694Listed by: CHARLES RUTENBERG REALTY INC $125,000Active2 beds 2 baths866 sq. ft.
3127 Mission Grove Drive #3127, PALM HARBOR, FL 34684
MLS# TB8515598Listed by: EXP REALTY LLC $249,999Active2 beds 3 baths1,150 sq. ft.
205 Somerset Lane, PALM HARBOR, FL 34684
MLS# TB8515153Listed by: SANCTUARY REAL ESTATE GROUP, LLC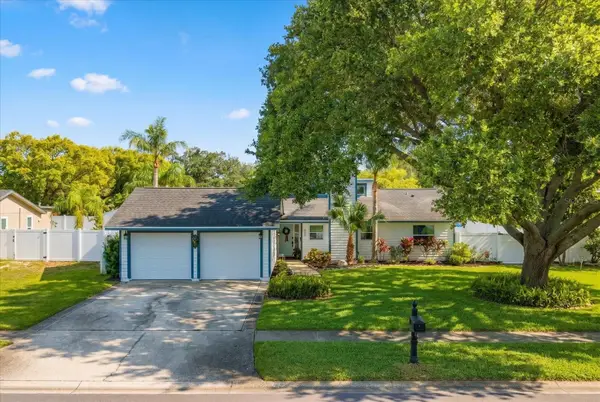 $499,000Pending3 beds 2 baths1,358 sq. ft.
420 Oxford Road, PALM HARBOR, FL 34683
MLS# TB8515770Listed by: COLDWELL BANKER REALTY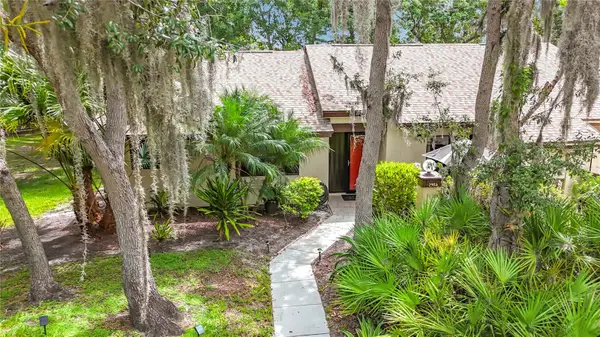 $259,900Active2 beds 2 baths1,298 sq. ft.
2983 Elder Court, PALM HARBOR, FL 34684
MLS# TB8515434Listed by: NEXTHOME LUXE COASTAL $264,900Active2 beds 2 baths1,075 sq. ft.
2141 Portofino Place #28-2815, PALM HARBOR, FL 34683
MLS# TB8492147Listed by: CHARLES RUTENBERG REALTY INC $489,900Pending3 beds 2 baths1,624 sq. ft.
665 Deer Run N, PALM HARBOR, FL 34684
MLS# TB8515549Listed by: DALTON WADE INC $387,700Active2 beds 2 baths1,332 sq. ft.
3271 Mcmath Drive, PALM HARBOR, FL 34684
MLS# TB8514165Listed by: BHHS FLORIDA PROPERTIES GROUP $325,000Active2 beds 1 baths816 sq. ft.
100 Avery Avenue, CRYSTAL BEACH, FL 34681
MLS# TB8513449Listed by: CHARLES RUTENBERG REALTY INC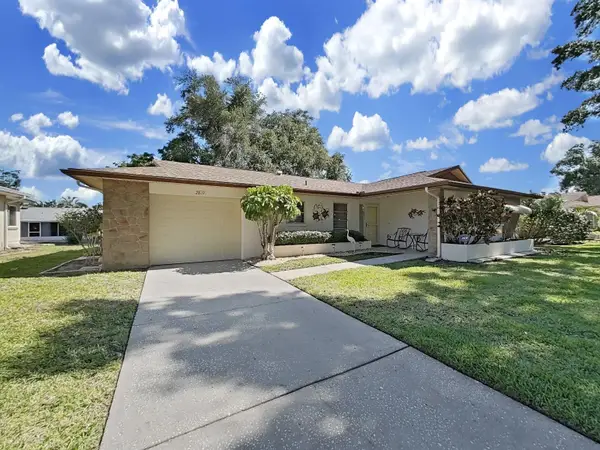 $364,900Active2 beds 2 baths1,288 sq. ft.
2819 Thistle Court S, PALM HARBOR, FL 34684
MLS# TB8515135Listed by: CHARLES RUTENBERG REALTY INC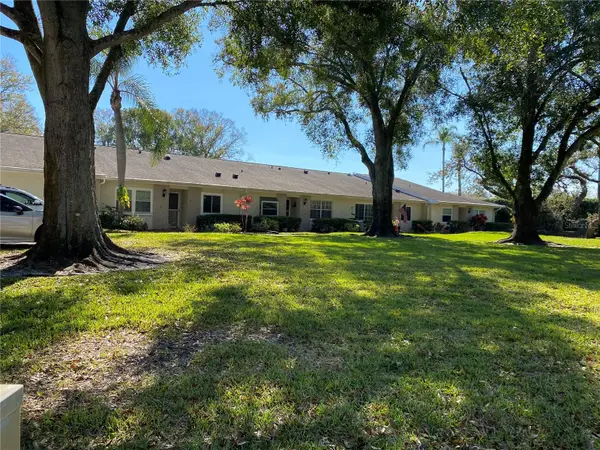 $214,900Active2 beds 2 baths1,230 sq. ft.
1059 Dunrobin Drive #B, PALM HARBOR, FL 34684
MLS# TB8514992Listed by: CHARLES RUTENBERG REALTY INC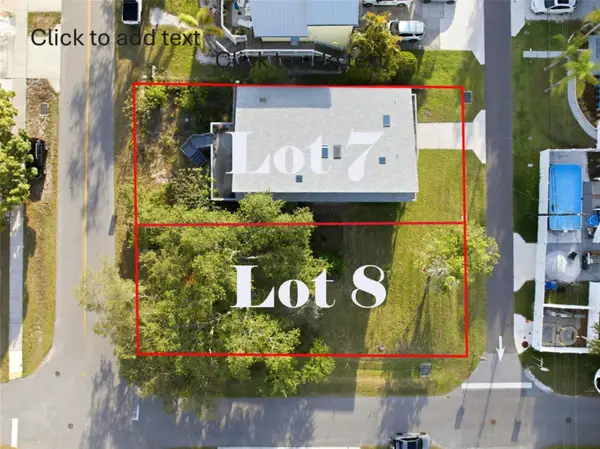 $145,000Active0.14 Acres
0 Georgia Ave. Avenue, CRYSTAL BEACH, FL 34681
MLS# TB8515212Listed by: FUTURE HOME REALTY INC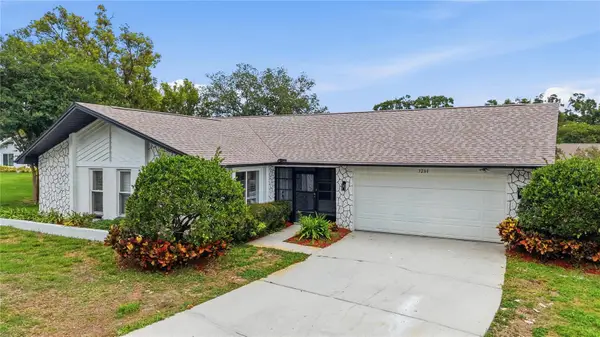 $489,000Active2 beds 2 baths1,863 sq. ft.
3280 Skene Terrace, PALM HARBOR, FL 34684
MLS# O6413333Listed by: BEYCOME OF FLORIDA LLC- Open Sun, 12am to 3pm
 $899,000Active3 beds 2 baths2,328 sq. ft.
416 Tennessee Avenue, CRYSTAL BEACH, FL 34681
MLS# TB8515161Listed by: COASTAL PROPERTIES GROUP INTERNATIONAL  $265,000Pending2 beds 3 baths1,344 sq. ft.
2612 2nd Court, PALM HARBOR, FL 34684
MLS# O6412841Listed by: BEYCOME OF FLORIDA LLC $368,000Pending3 beds 2 baths1,680 sq. ft.
78 Maple Avenue, PALM HARBOR, FL 34684
MLS# TB8513564Listed by: COLDWELL BANKER REALTY $285,000Active1 beds 1 baths825 sq. ft.
36750 Us Highway 19 N #19-115, PALM HARBOR, FL 34683
MLS# TB8514554Listed by: CHARLES RUTENBERG REALTY INC $699,999Active4 beds 3 baths2,607 sq. ft.
3256 Bentley Drive, PALM HARBOR, FL 34684
MLS# TB8513921Listed by: FILLMORE REAL ESTATE GROUP $5,000Active4 beds 2 baths2,336 sq. ft.
904 High View Drive, Other, FL 34683
MLS# 620112Listed by: JAMIE BOONE, LLC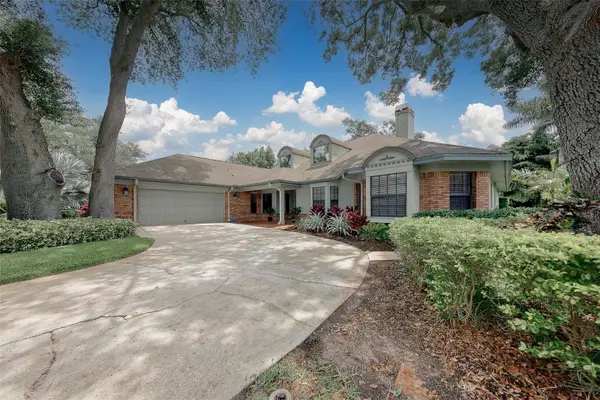 $934,900Pending4 beds 3 baths3,108 sq. ft.
276 Sheffield Circle W, PALM HARBOR, FL 34683
MLS# TB8514200Listed by: CHARLES RUTENBERG REALTY INC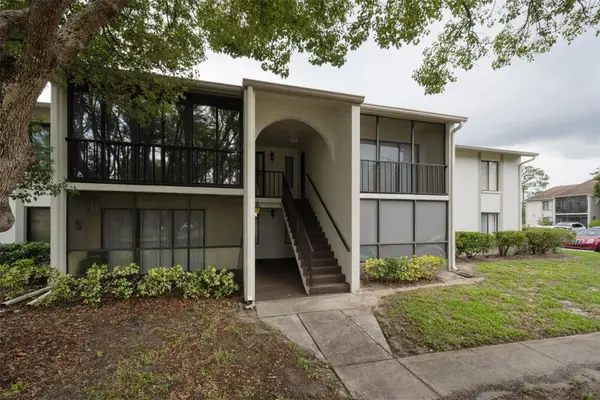 $149,900Active2 beds 2 baths1,038 sq. ft.
2687 Pine Ridge Way S #B2, PALM HARBOR, FL 34684
MLS# TB8514012Listed by: RE/MAX REALTEC GROUP INC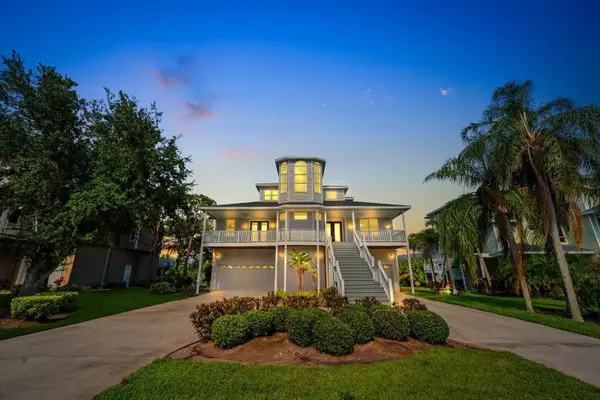 $1,499,000Active4 beds 6 baths3,612 sq. ft.
921 Point Seaside Drive, CRYSTAL BEACH, FL 34681
MLS# TB8513317Listed by: THE SHOP REAL ESTATE CO.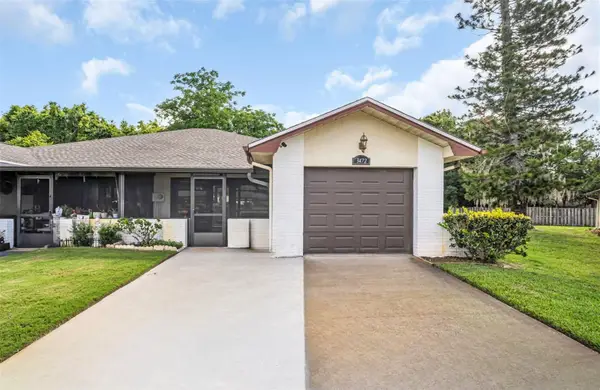 $319,900Active2 beds 2 baths1,289 sq. ft.
3472 Maclaren Drive, PALM HARBOR, FL 34684
MLS# TB8513775Listed by: COLDWELL BANKER REALTY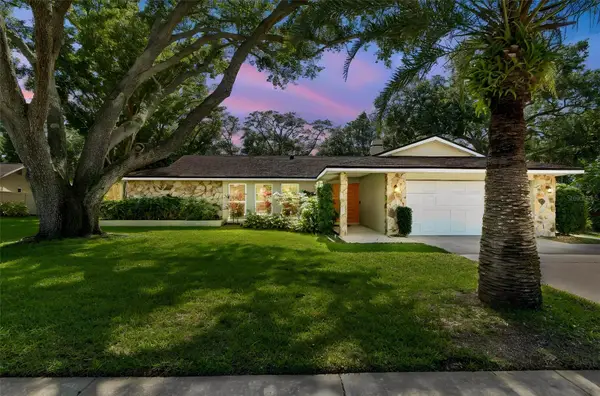 $564,916Pending3 beds 2 baths1,893 sq. ft.
515 Sandy Hook Road, PALM HARBOR, FL 34683
MLS# TB8513657Listed by: KELLER WILLIAMS REALTY- PALM H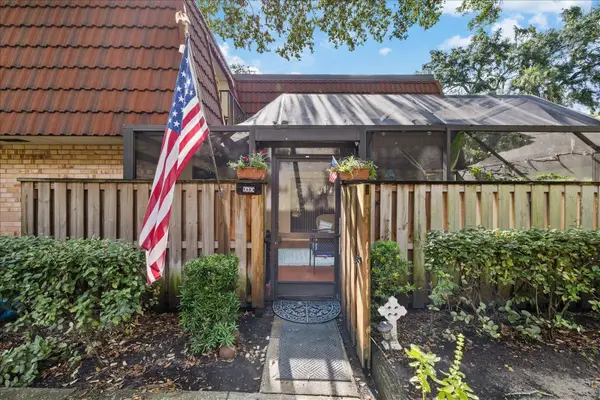 $239,000Pending2 beds 3 baths1,344 sq. ft.
2603 2nd Court, PALM HARBOR, FL 34684
MLS# TB8512596Listed by: KELLER WILLIAMS REALTY- PALM H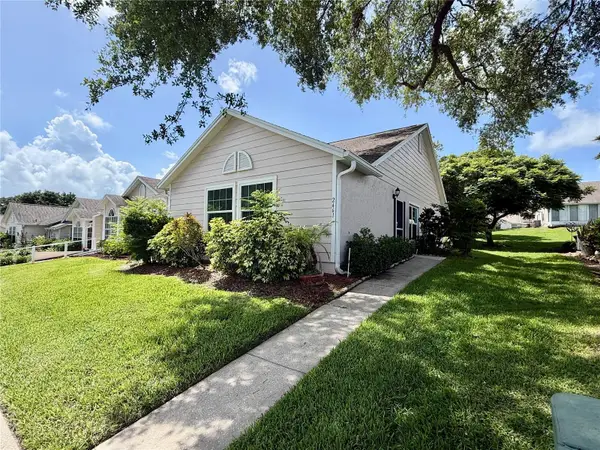 $330,000Active3 beds 2 baths1,410 sq. ft.
2461 Bentley Drive, PALM HARBOR, FL 34684
MLS# TB8513620Listed by: CENTURY 21 BE3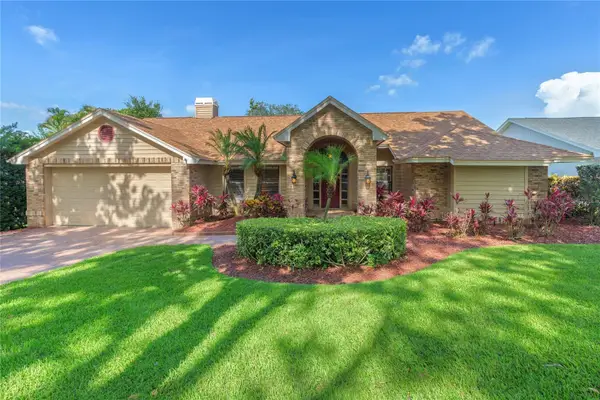 $859,000Active4 beds 2 baths2,824 sq. ft.
2653 Landing Way, PALM HARBOR, FL 34684
MLS# TB8510969Listed by: EXP REALTY LLC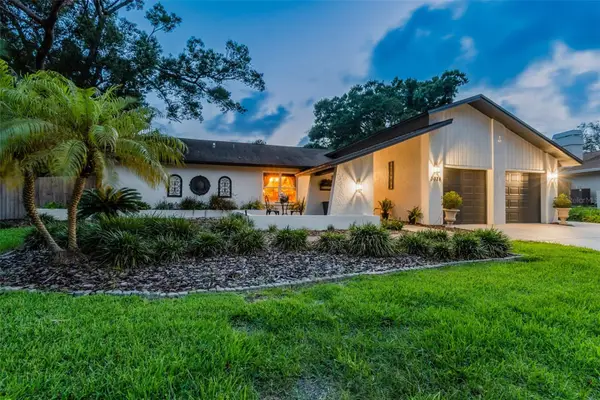 $659,900Pending3 beds 2 baths2,032 sq. ft.
3034 Enisglen Drive, PALM HARBOR, FL 34683
MLS# TB8513383Listed by: EXP REALTY LLC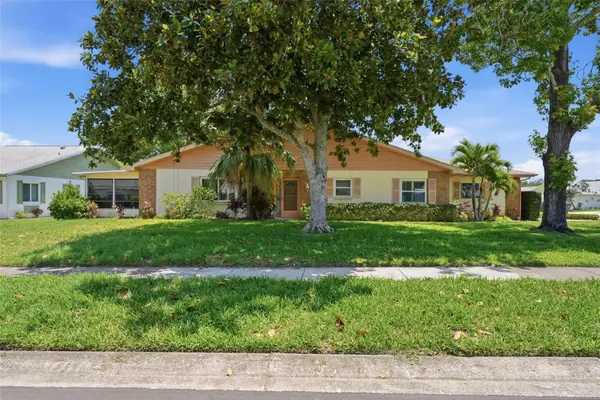 $299,000Pending2 beds 2 baths1,332 sq. ft.
3251 Mcmath Drive, PALM HARBOR, FL 34684
MLS# TB8512566Listed by: EXP REALTY LLC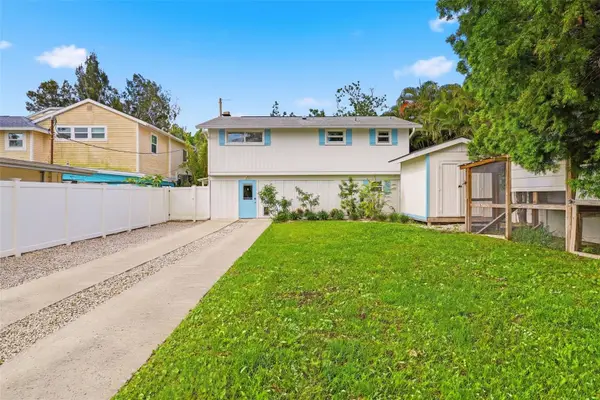 $489,900Active4 beds 2 baths1,412 sq. ft.
7 Georgia Avenue, CRYSTAL BEACH, FL 34681
MLS# TB8512723Listed by: REAL BROKER, LLC- Open Fri, 4 to 6pm
 $290,000Active2 beds 2 baths918 sq. ft.
2662 Megan Court, PALM HARBOR, FL 34684
MLS# TB8512496Listed by: PREMIER SOTHEBY'S INTL REALTY 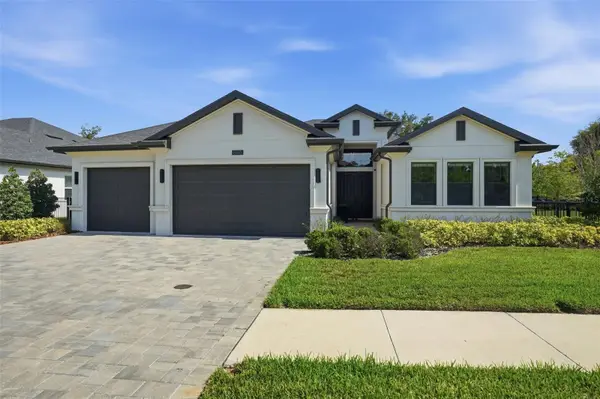 $1,399,900Active4 beds 4 baths3,035 sq. ft.
1916 Jullee Lane, PALM HARBOR, FL 34683
MLS# TB8512703Listed by: RE/MAX REALTEC GROUP INC- Open Sat, 1 to 3pm
 $574,900Active3 beds 2 baths1,769 sq. ft.
344 Crosswinds Drive, PALM HARBOR, FL 34683
MLS# TB8507768Listed by: KELLER WILLIAMS REALTY- PALM H 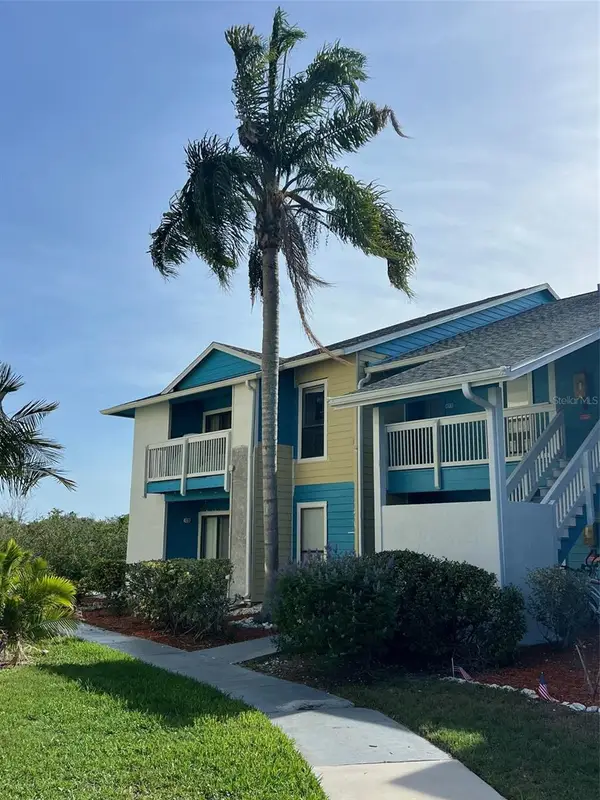 $179,900Active2 beds 2 baths898 sq. ft.
455 Alt 19 S #159, PALM HARBOR, FL 34683
MLS# TB8511786Listed by: IMPERIUM REAL ESTATE SERVICES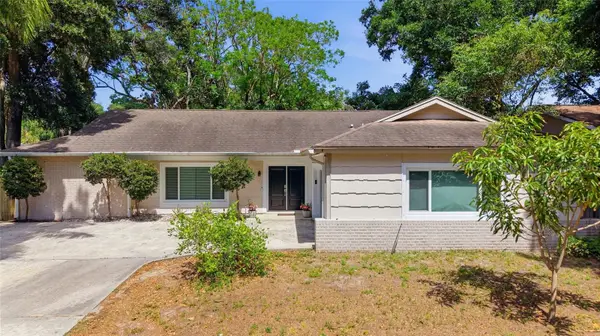 $539,999Active3 beds 2 baths2,096 sq. ft.
2447 Grove Ridge Drive, PALM HARBOR, FL 34683
MLS# TB8512191Listed by: 54 REALTY LLC $249,500Active2 beds 2 baths1,050 sq. ft.
1006 Lennox Road W #1006, PALM HARBOR, FL 34683
MLS# TB8508324Listed by: CHARLES RUTENBERG REALTY INC $99,000Active14.28 Acres
9 Yawl Lane #9, PALM HARBOR, FL 34683
MLS# TB8512411Listed by: RE/MAX ELITE REALTY $550,000Active0.27 Acres
100 Augusta Avenue, PALM HARBOR, FL 34683
MLS# TB8511520Listed by: COLDWELL BANKER REALTY $315,000Active3 beds 2 baths1,152 sq. ft.
4793 Pleasant Avenue, PALM HARBOR, FL 34683
MLS# TB8512578Listed by: EXP REALTY LLC $149,999Pending2 beds 3 baths1,344 sq. ft.
2707 12th Court, PALM HARBOR, FL 34684
MLS# TB8511381Listed by: EXP REALTY LLC $270,000Active2 beds 3 baths1,518 sq. ft.
2599 Dolly Bay Drive #305, PALM HARBOR, FL 34684
MLS# TB8512345Listed by: 27NORTH REALTY $459,000Active4 beds 2 baths1,706 sq. ft.
2627 Surrey Drive, PALM HARBOR, FL 34684
MLS# TB8512001Listed by: MARK SPAIN REAL ESTATE $1,785,000Active3 beds 3 baths3,378 sq. ft.
3493 Shoreline Circle, PALM HARBOR, FL 34684
MLS# TB8511432Listed by: DALTON WADE INC $1,825,000Active5 beds 4 baths4,496 sq. ft.
3157 N Canal Drive, PALM HARBOR, FL 34684
MLS# TB8504097Listed by: PREMIER COMMUNITY REALTY INC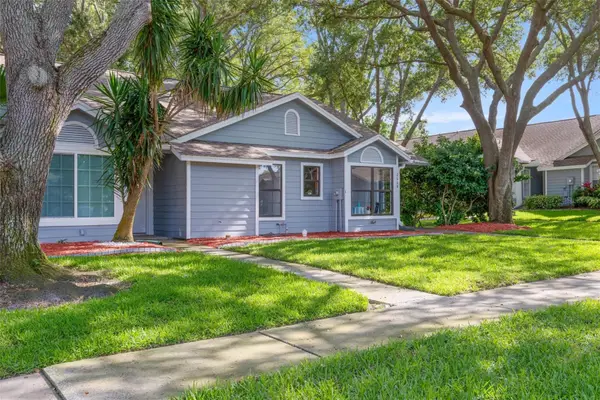 $234,000Active2 beds 2 baths1,200 sq. ft.
2668 Bentley Drive, PALM HARBOR, FL 34684
MLS# TB8498063Listed by: REALTY EXPERTS $117,000Active2 beds 1 baths806 sq. ft.
3157 Mission Grove Drive, PALM HARBOR, FL 34684
MLS# TB8510526Listed by: RAGSDALE RESIDENTIAL REALTY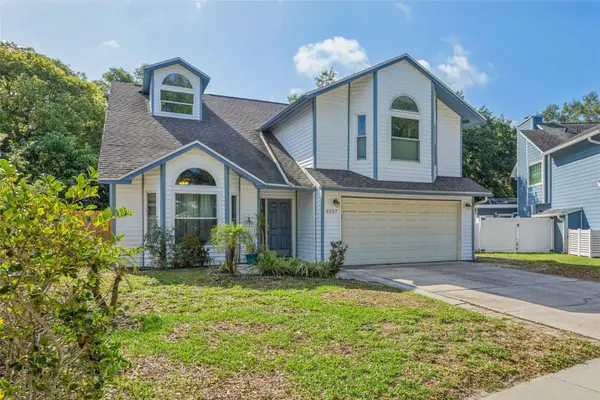 $540,000Active4 beds 3 baths2,347 sq. ft.
3237 Montrose Circle, PALM HARBOR, FL 34684
MLS# TB8511743Listed by: FUTURE HOME REALTY INC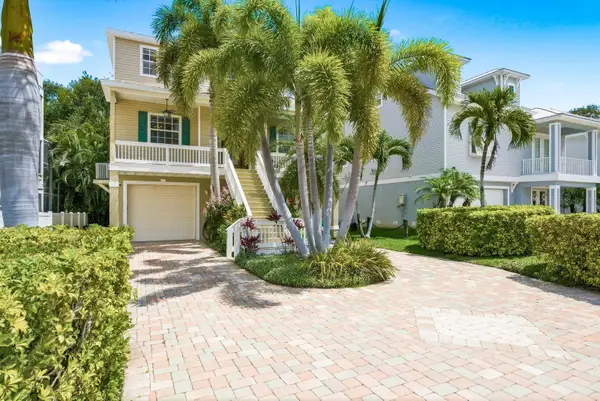 $649,000Active3 beds 3 baths1,928 sq. ft.
503 Palm Avenue, PALM HARBOR, FL 34683
MLS# TB8508594Listed by: KELLER WILLIAMS REALTY- PALM H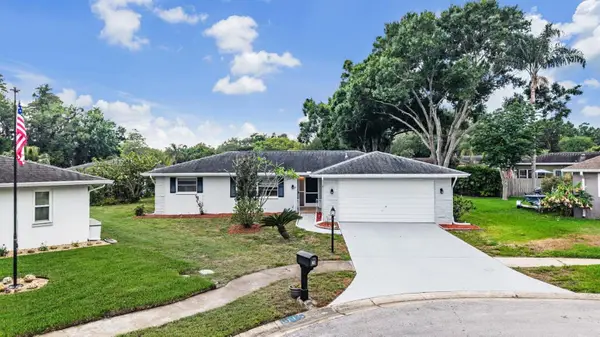 $364,800Pending2 beds 2 baths1,434 sq. ft.
20 Shell Circle, PALM HARBOR, FL 34684
MLS# TB8508168Listed by: RE/MAX REALTEC GROUP INC $379,900Active3 beds 2 baths1,097 sq. ft.
125 Crystal Beach Avenue, CRYSTAL BEACH, FL 34681
MLS# TB8511458Listed by: LKV REALTY, LLC $389,900Active3 beds 3 baths1,700 sq. ft.
403 Harbor Ridge Drive, PALM HARBOR, FL 34683
MLS# TB8510696Listed by: JASON MITCHELL REAL ESTATE FLO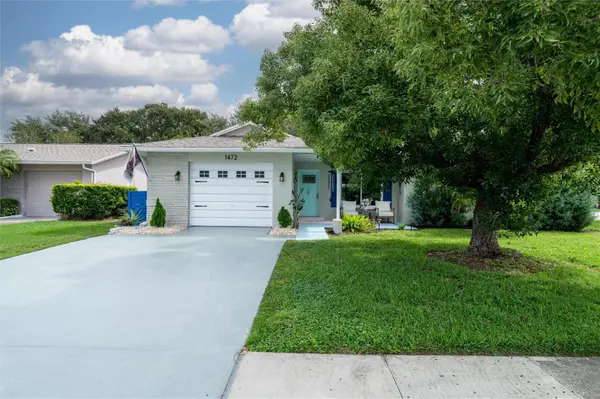 $439,000Active2 beds 2 baths1,211 sq. ft.
1472 Queen Anne Drive, PALM HARBOR, FL 34684
MLS# TB8511470Listed by: LPT REALTY, LLC $950,000Active5 beds 4 baths3,259 sq. ft.
3930 Tarian Court, PALM HARBOR, FL 34684
MLS# TB8505689Listed by: KELLER WILLIAMS REALTY- PALM H $169,900Active2 beds 1 baths675 sq. ft.
2571 Cyprus Drive #1-201, PALM HARBOR, FL 34684
MLS# TB8509000Listed by: RE/MAX REALTEC GROUP INC $259,900Active2 beds 2 baths1,230 sq. ft.
860 Maclaren Drive N #B, PALM HARBOR, FL 34684
MLS# TB8508226Listed by: COLDWELL BANKER REALTY $249,900Active2 beds 2 baths1,000 sq. ft.
2828 Highlands Boulevard #A, PALM HARBOR, FL 34684
MLS# TB8508182Listed by: COLDWELL BANKER REALTY $220,000Active2 beds 2 baths1,120 sq. ft.
4041 Arrowwood Court #4041, PALM HARBOR, FL 34684
MLS# TB8508595Listed by: KELLER WILLIAMS REALTY- PALM H $439,900Pending3 beds 2 baths1,178 sq. ft.
1356 Noell Boulevard, PALM HARBOR, FL 34683
MLS# TB8510811Listed by: DOMAINREALTY.COM LLC $200,000Active2 beds 2 baths1,000 sq. ft.
2700 Nebraska Avenue #5-105, PALM HARBOR, FL 34684
MLS# TB8511200Listed by: KELLER WILLIAMS REALTY PORTFOLIO COLLECTION $624,900Active4 beds 3 baths2,126 sq. ft.
3906 Blooming Hill Lane, PALM HARBOR, FL 34684
MLS# A4692985Listed by: FINE PROPERTIES $164,800Active1 beds 1 baths675 sq. ft.
2571 Cyprus Drive #1-204, PALM HARBOR, FL 34684
MLS# TB8510458Listed by: RE/MAX ACTION FIRST OF FLORIDA $166,100Pending1 beds 1 baths675 sq. ft.
2595 Cyprus Drive #4-217, PALM HARBOR, FL 34684
MLS# TB8510415Listed by: RE/MAX ACTION FIRST OF FLORIDA $164,800Active1 beds 9 baths675 sq. ft.
2571 Cyprus Drive #1-104, PALM HARBOR, FL 34684
MLS# TB8510432Listed by: RE/MAX ACTION FIRST OF FLORIDA $164,600Pending1 beds 1 baths660 sq. ft.
2571 Cyprus Drive #1-106, PALM HARBOR, FL 34684
MLS# TB8510455Listed by: RE/MAX ACTION FIRST OF FLORIDA $547,900Active3 beds 2 baths1,660 sq. ft.
36750 Us Highway 19 N #20305, PALM HARBOR, FL 34684
MLS# TB8510689Listed by: GOLF HOST SECURITIES INC $165,000Pending1 beds 1 baths1,178 sq. ft.
3305 Haviland Court #301, PALM HARBOR, FL 34684
MLS# TB8510859Listed by: QUICKSILVER REAL ESTATE GROUP $979,000Active4 beds 3 baths2,764 sq. ft.
201 Lagoon Drive, PALM HARBOR, FL 34683
MLS# TB8510724Listed by: EXP REALTY LLC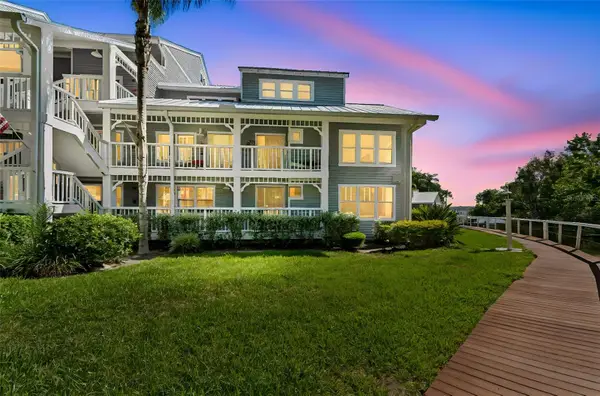 $299,900Active3 beds 2 baths1,870 sq. ft.
2533 Dolly Bay Drive #101, PALM HARBOR, FL 34684
MLS# TB8510170Listed by: RE/MAX COLLECTIVE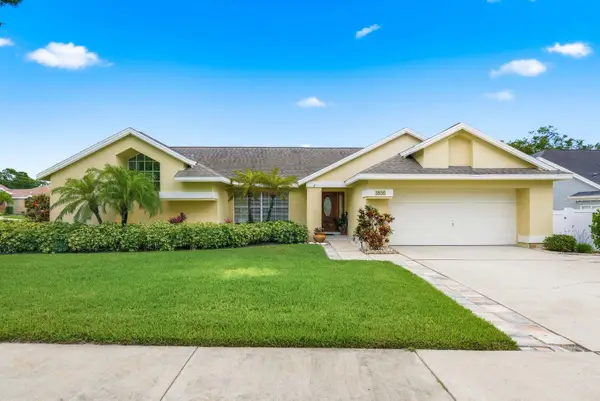 $725,000Pending4 beds 3 baths2,407 sq. ft.
1856 Wood Thrush Way, PALM HARBOR, FL 34683
MLS# TB8509311Listed by: KELLER WILLIAMS REALTY- PALM H $559,000Active2 beds 2 baths1,660 sq. ft.
36750 Us Highway 19 #21202, PALM HARBOR, FL 34684
MLS# TB8510667Listed by: GOLF HOST SECURITIES INC $198,000Pending2 beds 3 baths1,344 sq. ft.
2726 11th Court, PALM HARBOR, FL 34684
MLS# TB8510512Listed by: EXP REALTY LLC $779,000Active3 beds 2 baths1,736 sq. ft.
313 Crystal Beach Avenue, CRYSTAL BEACH, FL 34681
MLS# O6409459Listed by: EXP REALTY LLC $5,000Active3 beds 2 baths1,413 sq. ft.
1644 E Grovehill Road, Other, FL 34683
MLS# 619908Listed by: JAMIE BOONE, LLC $450,000Active2 beds 2 baths1,699 sq. ft.
1647 Bentley Court, PALM HARBOR, FL 34684
MLS# TB8510446Listed by: CAMELOT INC REALTORS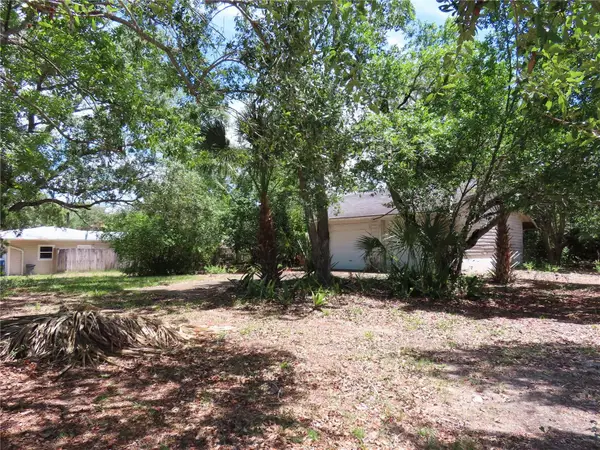 $1,500,500Active0.95 Acres
Mayo, CRYSTAL BEACH, FL 34681
MLS# TB8509351Listed by: EZ HOME CHOICE LLC $350,000Active3 beds 3 baths1,685 sq. ft.
498 Lakeview Drive #44, PALM HARBOR, FL 34683
MLS# TB8510185Listed by: COLDWELL BANKER REALTY $225,000Pending2 beds 2 baths960 sq. ft.
1150 Orange Tree Circle E #D, PALM HARBOR, FL 34684
MLS# TB8510105Listed by: PREMIER SOTHEBY'S INTL REALTY- Open Sat, 12 to 2pm
 $388,900Active3 beds 3 baths1,700 sq. ft.
441 Harbor Ridge Drive, PALM HARBOR, FL 34683
MLS# TB8508907Listed by: LPT REALTY, LLC  $375,990Active3 beds 3 baths1,464 sq. ft.
4578 Stargazer Court, PALM HARBOR, FL 34683
MLS# A4694024Listed by: D.R. HORTON REALTY OF SARASOTA $375,990Active3 beds 3 baths1,464 sq. ft.
4570 Stargazer Court, PALM HARBOR, FL 34683
MLS# A4694014Listed by: D.R. HORTON REALTY OF SARASOTA $375,990Active3 beds 3 baths1,464 sq. ft.
4574 Stargazer Court, PALM HARBOR, FL 34683
MLS# A4694021Listed by: D.R. HORTON REALTY OF SARASOTA $390,990Active3 beds 3 baths1,463 sq. ft.
4566 Stargazer Court, PALM HARBOR, FL 34683
MLS# A4694006Listed by: D.R. HORTON REALTY OF SARASOTA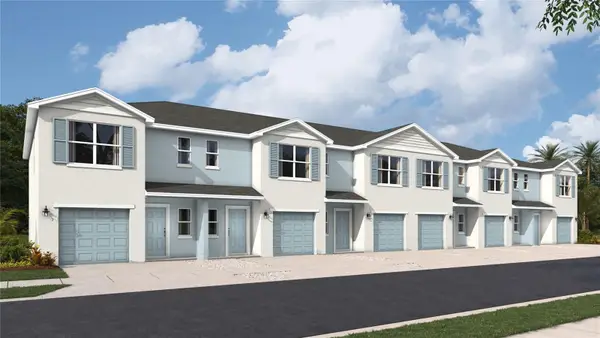 $390,990Active3 beds 3 baths1,463 sq. ft.
4582 Stargazer Court, PALM HARBOR, FL 34683
MLS# A4694011Listed by: D.R. HORTON REALTY OF SARASOTA $259,900Active2 beds 2 baths1,115 sq. ft.
2370 Bentley Drive, PALM HARBOR, FL 34684
MLS# TB8509141Listed by: IMPACT REALTY TAMPA BAY $280,000Pending3 beds 2 baths950 sq. ft.
327 Phlox Drive #327, PALM HARBOR, FL 34684
MLS# W7885784Listed by: F I GREY & SON RESIDENTIAL $324,000Active3 beds 3 baths1,253 sq. ft.
933 Hamilton Court, PALM HARBOR, FL 34683
MLS# TB8509208Listed by: SIGNATURE REALTY ASSOCIATES
Local realty services provided by:CENTURY 21 Results, CENTURY 21 Circle, CENTURY 21 AllPoints Realty
The information being provided by Stellar Mls is for the consumer's personal, non-commercial use and may not be used for any purpose other than to identify prospective properties consumer may be interested in purchasing. Any information relating to real estate for sale referenced on this web site comes from the Internet Data Exchange (IDX) program of the Stellar Mls. CENTURY 21 Results is not a Multiple Listing Service (MLS), nor does it offer MLS access. This website is a service of CENTURY 21 Results, a broker participant of Stellar Mls. This web site may reference real estate listing(s) held by a brokerage firm other than the broker and/or agent who owns this web site.
The accuracy of all information, regardless of source, including but not limited to open house information, square footages and lot sizes, is deemed reliable but not guaranteed and should be personally verified through personal inspection by and/or with the appropriate professionals. The data contained herein is copyrighted by Stellar Mls and is protected by all applicable copyright laws. Any unauthorized dissemination of this information is in violation of copyright laws and is strictly prohibited.
Properties in listings may have been sold or may no longer be available.
Copyright 2026 Stellar Mls. All rights reserved.
Information deemed reliable but not guaranteed. Information is provided, in part, by Greater Miami MLS. This information being provided is for consumer's personal, non-commercial use and may not be used for any other purpose other than to identify prospective properties consumers may be interested in purchasing. SEFMLS Member Broker: David Cates
Neighborhoods near Palm Harbor, FL
Zip codes near Palm Harbor, FL
- 33626 homes for sale
- 33635 homes for sale
- 33755 homes for sale
- 33756 homes for sale
- 33759 homes for sale
- 33761 homes for sale
- 33763 homes for sale
- 33765 homes for sale
- 33767 homes for sale
- 34677 homes for sale
- 34681 homes for sale
- 34683 homes for sale
- 34684 homes for sale
- 34685 homes for sale
- 34688 homes for sale
- 34689 homes for sale
- 34690 homes for sale
- 34691 homes for sale
- 34695 homes for sale
- 34698 homes for sale
Popular searches near Palm Harbor, FL
- Beacon Square homes for sale
- Belleair homes for sale
- Clearwater homes for sale
- Clearwater Beach homes for sale
- Crystal Beach homes for sale
- Dunedin homes for sale
- East Lake homes for sale
- Elfers homes for sale
- Greenbriar homes for sale
- Holiday homes for sale
- Key Vista homes for sale
- Keystone homes for sale
- Keystone-Citrus Park homes for sale
- New Port Richey homes for sale
- Odessa homes for sale
- Oldsmar homes for sale
- Safety Harbor homes for sale
- Tarpon Springs homes for sale
- Trinity homes for sale
- Westchase homes for sale
Protect your home and budget from life's surprises with an Assurant Home Warranty, backed by a partner that supports you through every step of homeownership. Explore Plans.
©2026 Century 21 Real Estate LLC. All rights reserved. CENTURY 21®, the CENTURY 21 Logo and C21® are service marks owned by Century 21 Real Estate LLC. Century 21 Real Estate LLC fully supports the principles of the Fair Housing Act and the Equal Opportunity Act. Each office is independently owned and operated. Listing information is deemed reliable but not guaranteed accurate.