- Abbottsford homes for sale
- Cusseta homes for sale
- Five Points homes for sale
- Franklin homes for sale
- Grantville homes for sale
- Hamilton homes for sale
- Hillcrest homes for sale
- Hogansville homes for sale
- Huguley homes for sale
- La Fayette homes for sale
- Lafayette homes for sale
- Lagrange homes for sale
- Lanett homes for sale
- Oak Grove homes for sale
- Pine Mountain homes for sale
- Roanoke homes for sale
- Texas homes for sale
- Valley homes for sale
- West Point homes for sale
- West Point homes for sale
30240, GA - homes for sale
2 of 2 results displayed
- Open Sun, 1 to 3pm
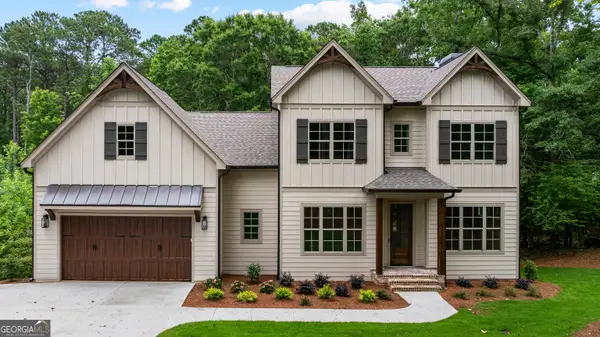 $699,900Active4 beds 4 baths2,835 sq. ft.
118 Sunny Point Circle, Lagrange, GA 30240
MLS# 10789634Listed by: RE/MAX Results
- Open Sun, 1 to 3pm
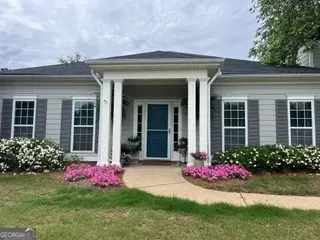 $389,900Active4 beds 3 baths1,785 sq. ft.
129 Copper Creek Drive, Lagrange, GA 30240
MLS# 10774461Listed by: eXp Realty
Local realty services provided by:CENTURY 21 Realty 1 Professionals
2026 Georgia MLS. All rights reserved. Information Deem Reliable But Not Guaranteed July 8, 2026 METROMLS Member Broker: Angela Whitmire
Popular searches near 30240
Popular neighborhoods near 30240
- Asheton Lakes, Auburn homes for sale
- Ashford Place, Lagrange homes for sale
- Auburn University Club, Auburn homes for sale
- Avery Park at Newnan, Newnan homes for sale
- Bent Creek, Opelika homes for sale
- Camelot, Opelika homes for sale
- Cary Woods, Auburn homes for sale
- College Temple, Newnan homes for sale
- Crossvine Village, Lagrange homes for sale
- Granite Hills, Auburn homes for sale
- Head Estates, Auburn homes for sale
- Highland, Opelika homes for sale
- Madison Park, Newnan homes for sale
- Maple Ridge, Columbus homes for sale
- Moore's Mill, Auburn homes for sale
- Moss Creek, Lagrange homes for sale
- North Gate, Opelika homes for sale
- Old Town, Columbus homes for sale
- Shelton Park, Auburn homes for sale
- Veterans, Columbus homes for sale
Counties near Lagrange, 30240
- Carroll County homes for sale
- Chambers County homes for sale
- Chattahoochee County homes for sale
- Clay County homes for sale
- Cleburne County homes for sale
- Coweta County homes for sale
- Douglas County homes for sale
- Fayette County homes for sale
- Haralson County homes for sale
- Harris County homes for sale
- Heard County homes for sale
- Lee County homes for sale
- Meriwether County homes for sale
- Muscogee County homes for sale
- Pike County homes for sale
- Randolph County homes for sale
- Talbot County homes for sale
- Tallapoosa County homes for sale
- Troup County homes for sale
- Upson County homes for sale
Protect your home and budget from life's surprises with an Assurant Home Warranty, backed by a partner that supports you through every step of homeownership. Explore Plans.
©2026 Century 21 Real Estate LLC. All rights reserved. CENTURY 21®, the CENTURY 21 Logo and C21® are service marks owned by Century 21 Real Estate LLC. Century 21 Real Estate LLC fully supports the principles of the Fair Housing Act and the Equal Opportunity Act. Each office is independently owned and operated. Listing information is deemed reliable but not guaranteed accurate.