- Callowhill Historic District, Reading homes for sale
- Centre Park Historic District, Reading homes for sale
- College Heights, Reading homes for sale
- Downtown, Reading homes for sale
- East Reading, Reading homes for sale
- Glenside, Reading homes for sale
- Kenhorst, Reading homes for sale
- Millmont, Reading homes for sale
- Mount Penn, Reading homes for sale
- Northeast Reading, Reading homes for sale
- Northmont, Reading homes for sale
- Northwest Reading, Reading homes for sale
- Outlet District, Reading homes for sale
- Penn's Common Historic District, Reading homes for sale
- Prince Historic District, Reading homes for sale
- Queen Anne Historic District, Reading homes for sale
- Ricktown Arts District, Reading homes for sale
- Southside, Reading homes for sale
- West Reading, Reading homes for sale
- Wyomissing Park, Reading homes for sale
Reading, PA - homes for sale
286 of 286 results displayed
- Coming Soon
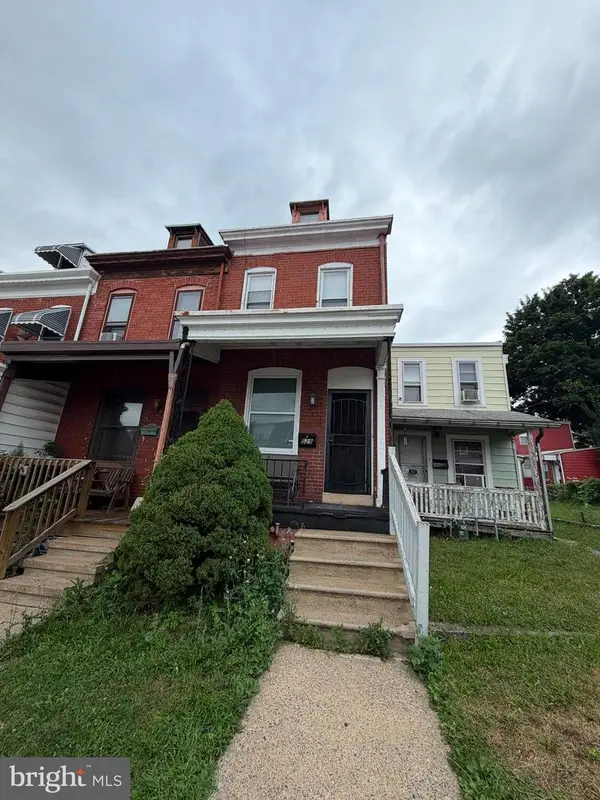
 $240,000Coming Soon5 beds 2 baths
553 Gordon St, READING, PA 19601
MLS# PABK2075426Listed by: COLDWELL BANKER REALTY - New
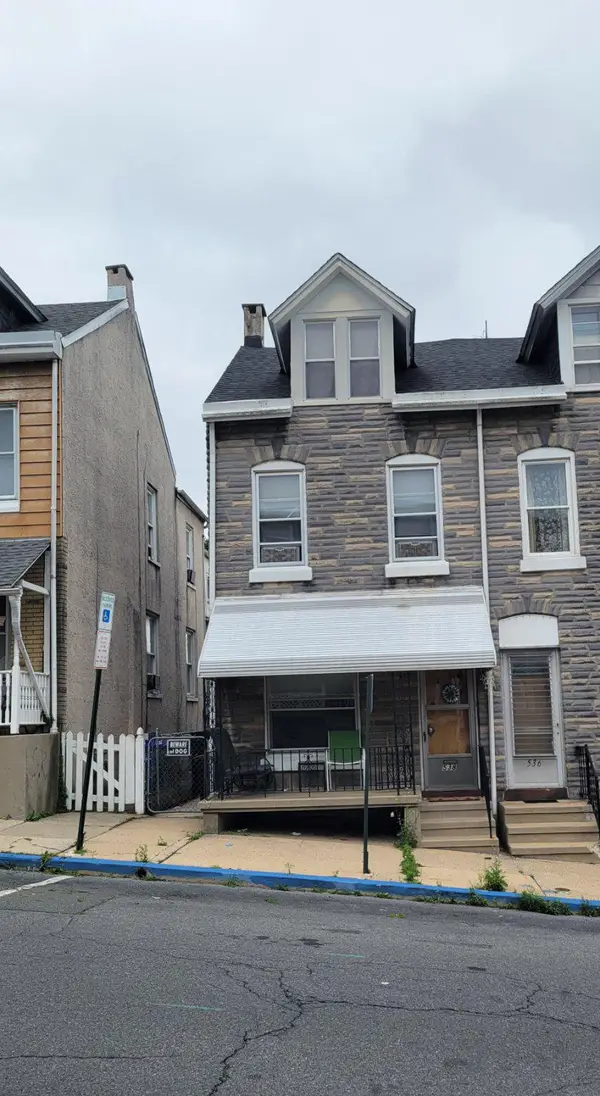
 $214,900Active4 beds 2 baths1,364 sq. ft.
1218 Locust St, READING, PA 19604
MLS# PABK2075068Listed by: DARYL TILLMAN REALTY GROUP - New
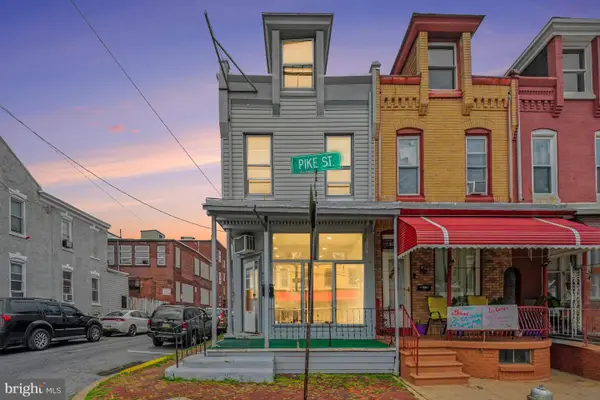
 $259,900Active3 beds 1 baths1,300 sq. ft.
1423 Fayette Ave, READING, PA 19607
MLS# PABK2075358Listed by: REALTY ONE GROUP ALLIANCE - New
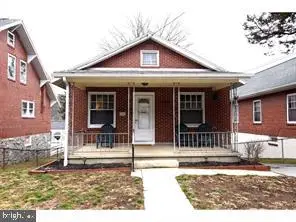
 $219,900Active3 beds -- baths1,382 sq. ft.
229 Upland Ave, READING, PA 19611
MLS# PABK2075286Listed by: COLDWELL BANKER REALTY - Coming Soon
 $225,000Coming Soon3 beds 2 baths
714 Summit Chase Dr, READING, PA 19611
MLS# PABK2074934Listed by: RE/MAX MAIN LINE-WEST CHESTER - Coming SoonOpen Thu, 5 to 7pm
 $150,000Coming Soon2 beds 1 baths
8 Sheffield Ct, READING, PA 19601
MLS# PABK2075042Listed by: KELLER WILLIAMS PLATINUM REALTY - WYOMISSING - New
 $229,900Active4 beds 2 baths1,820 sq. ft.
1049 Oley St, READING, PA 19604
MLS# PABK2075322Listed by: SPRINGER REALTY GROUP  $79,900Pending-- beds -- baths
235 Cedar St, READING, PA 19601
MLS# PABK2075314Listed by: PAGODA REALTY ERA POWERED- New
 $260,300Active3 beds 1 baths1,056 sq. ft.
2207 Fairview Ave, READING, PA 19606
MLS# PABK2075316Listed by: COUNTRY HOME REAL ESTATE, INC. - New
 $264,900Active3 beds 2 baths1,182 sq. ft.
1227 N 11th St, READING, PA 19604
MLS# PABK2075308Listed by: COLDWELL BANKER REALTY - New
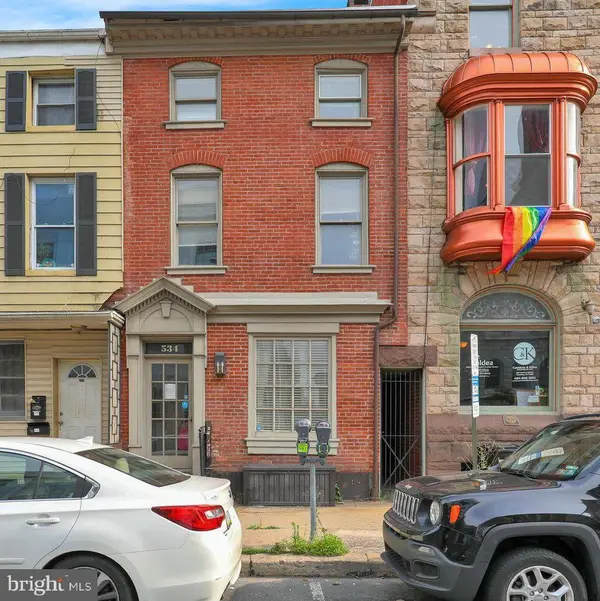 $200,000Active4 beds -- baths1,924 sq. ft.
534 Walnut St, READING, PA 19601
MLS# PABK2075276Listed by: IRON VALLEY REAL ESTATE OF BERKS - New
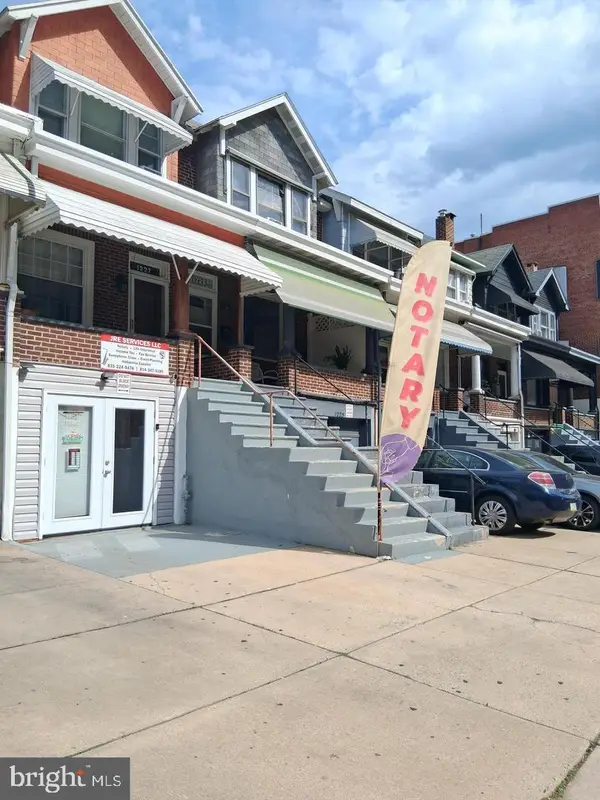
 $234,900Active3 beds -- baths1,506 sq. ft.
929 Pike St, READING, PA 19604
MLS# PABK2075278Listed by: COLDWELL BANKER REALTY - New
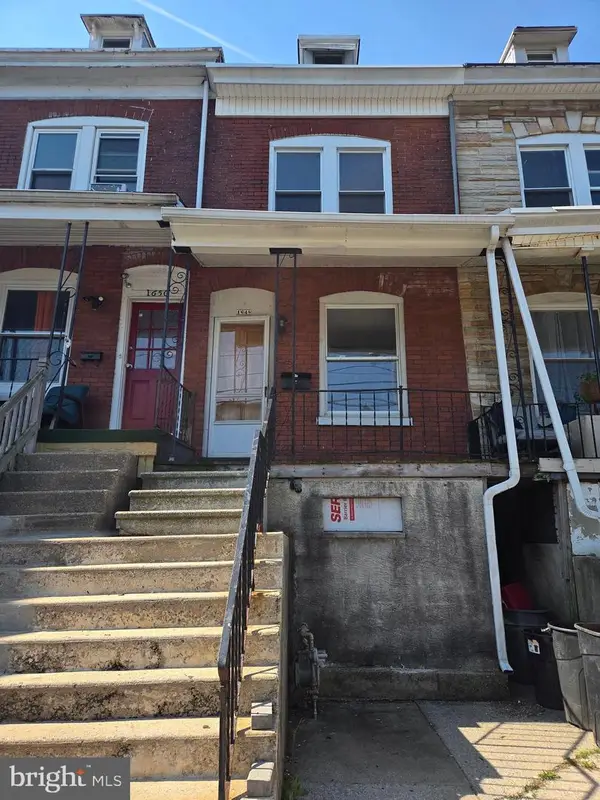 $142,900Active3 beds 1 baths943 sq. ft.
1648 Cotton St, READING, PA 19606
MLS# PABK2075292Listed by: BHHS HOMESALE REALTY- READING BERKS - New
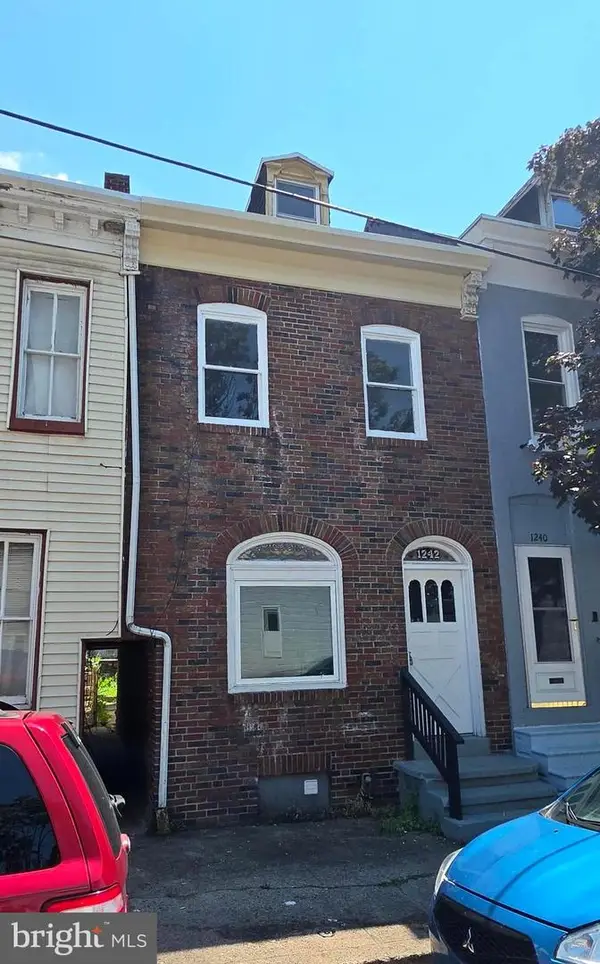 $169,000Active4 beds 1 baths1,282 sq. ft.
1242 Muhlenberg St, READING, PA 19602
MLS# PABK2075246Listed by: REALTY ONE GROUP ALLIANCE - New
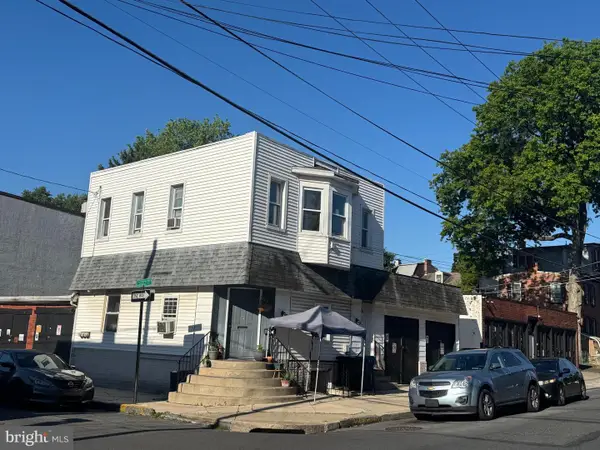 $599,900Active2 beds -- baths
520 Windsor St, READING, PA 19601
MLS# PABK2075072Listed by: SPM REAL ESTATE GROUP - New
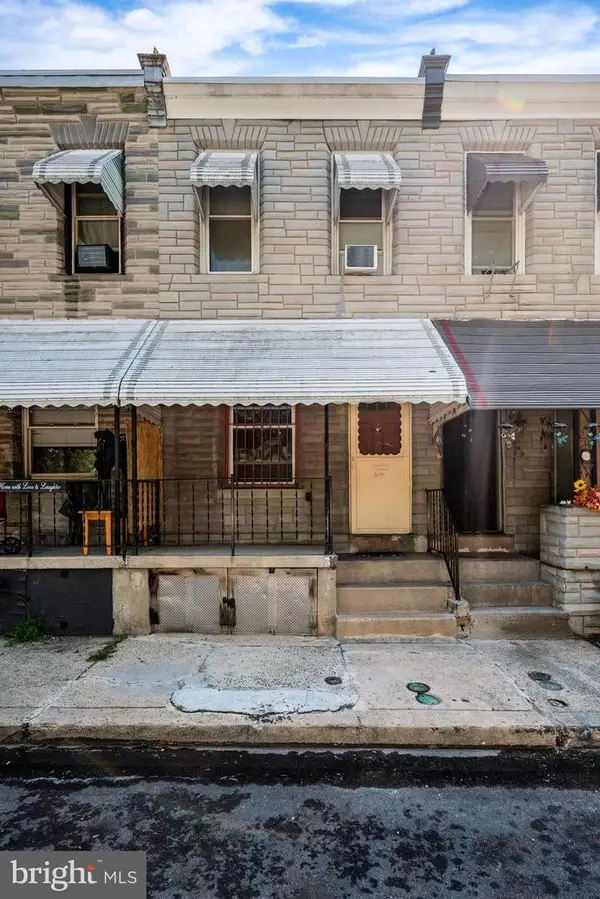 $100,000Active2 beds 1 baths832 sq. ft.
641 Clinton St, READING, PA 19601
MLS# PABK2075054Listed by: DARYL TILLMAN REALTY GROUP - New
 $178,000Active4 beds 1 baths1,420 sq. ft.
1207 Oley St, READING, PA 19604
MLS# PABK2075016Listed by: COLDWELL BANKER REALTY - New
 $174,901Active3 beds 2 baths866 sq. ft.
230 S 18th St, READING, PA 19602
MLS# PABK2074990Listed by: REALTY ONE GROUP ALLIANCE - New
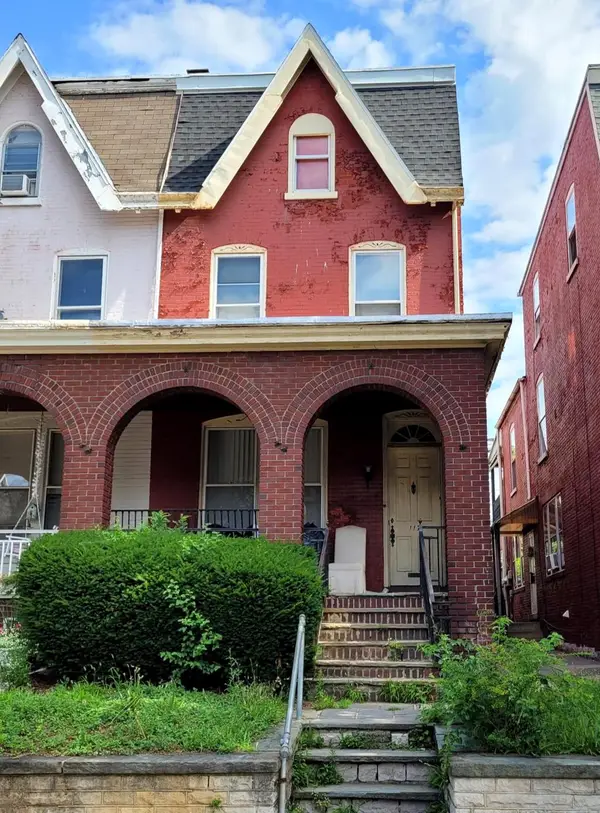
 $119,900Active4 beds 2 baths1,386 sq. ft.
723 Locust St, READING, PA 19604
MLS# PABK2074872Listed by: PROSPERITY REAL ESTATE & INVESTMENT SERVICES - Coming Soon
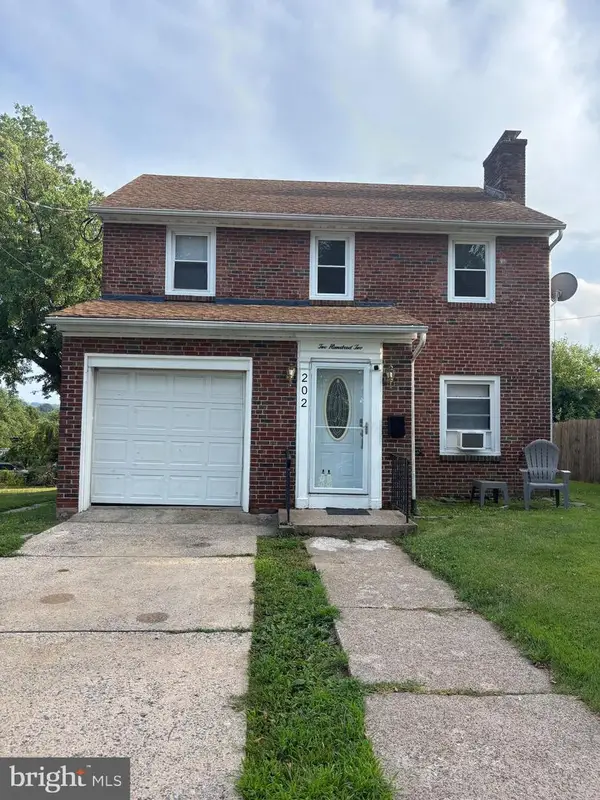 $269,000Coming Soon4 beds 2 baths
202 Gerry St, READING, PA 19611
MLS# PABK2074970Listed by: COLDWELL BANKER REALTY - Coming Soon
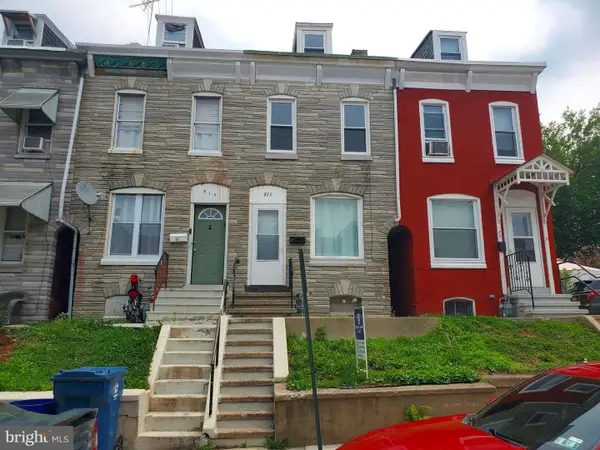 $149,900Coming Soon3 beds 1 baths
813 Locust St, READING, PA 19604
MLS# PABK2074966Listed by: COLDWELL BANKER REALTY - Coming Soon
 $200,000Coming Soon6 beds 2 baths
117 W Douglass St, READING, PA 19601
MLS# PABK2074948Listed by: RE/MAX OF READING - New
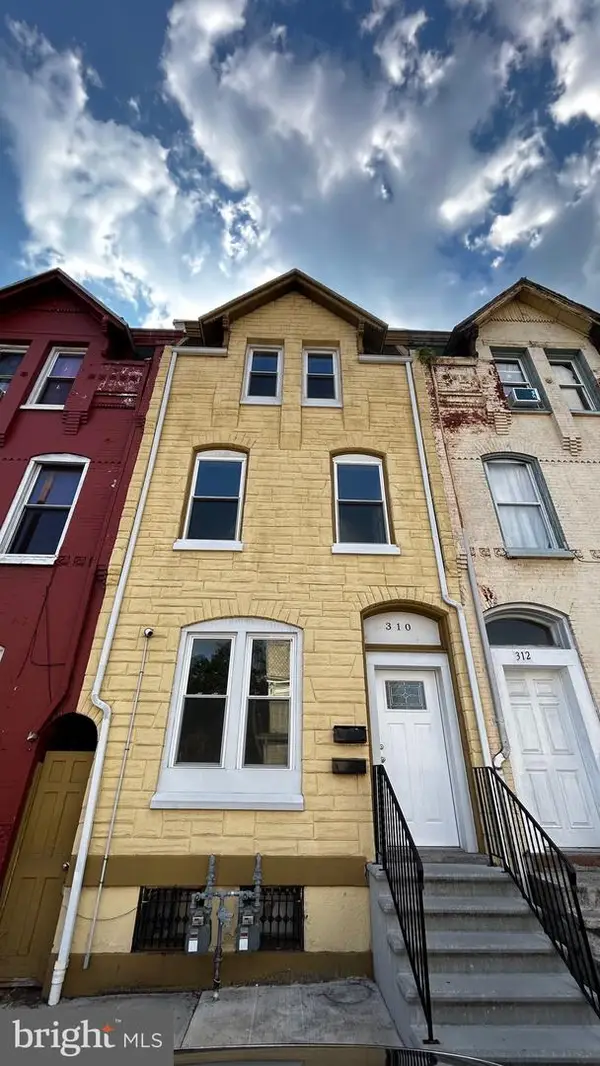 $245,000Active4 beds -- baths2,206 sq. ft.
310 N 4th St, READING, PA 19601
MLS# PABK2074662Listed by: RE/MAX OF READING - New
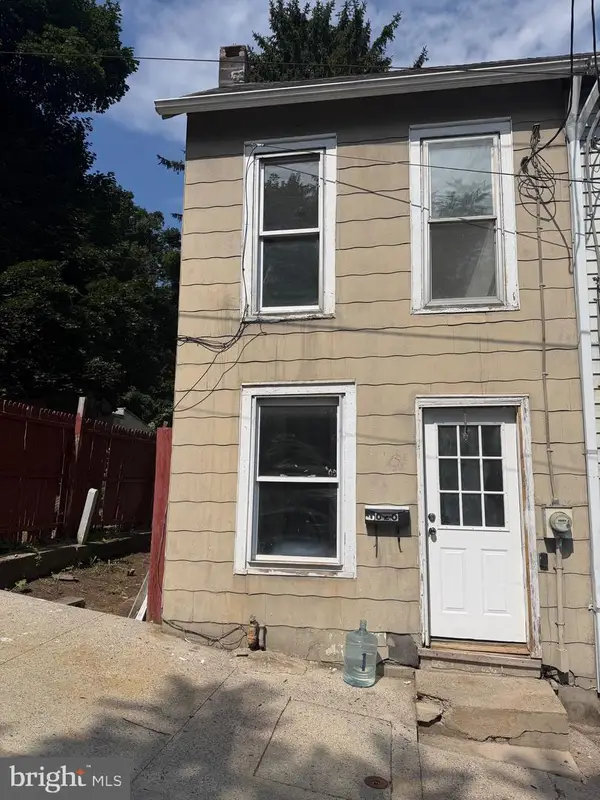 $115,000Active3 beds 1 baths928 sq. ft.
626 S 17 1/2 St, READING, PA 19606
MLS# PABK2074746Listed by: JM DIAMOND REALTY - New
 $299,000Active4 beds 2 baths1,596 sq. ft.
701 Alton Ave, READING, PA 19605
MLS# PABK2074842Listed by: IRON VALLEY REAL ESTATE OF BERKS - New
 $169,000Active3 beds 1 baths1,190 sq. ft.
345 Miller St, READING, PA 19602
MLS# PABK2074952Listed by: BHHS HOMESALE REALTY- READING BERKS - New
 $200,000Active2 beds 1 baths960 sq. ft.
851 Delta Ave, READING, PA 19605
MLS# PABK2074954Listed by: COLDWELL BANKER REALTY - New
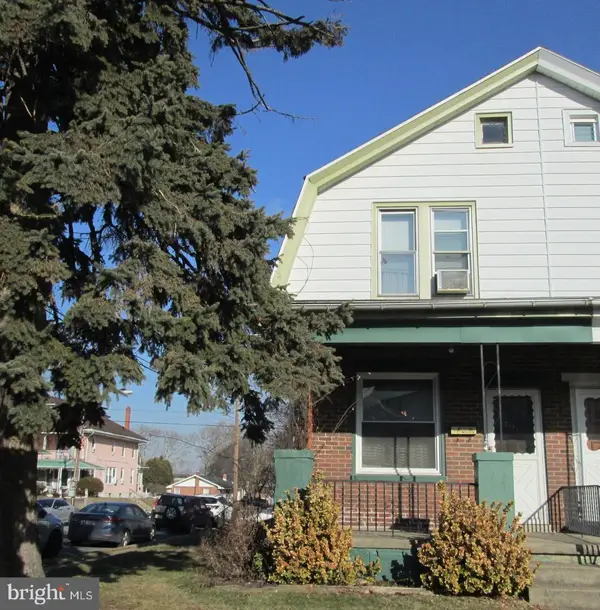
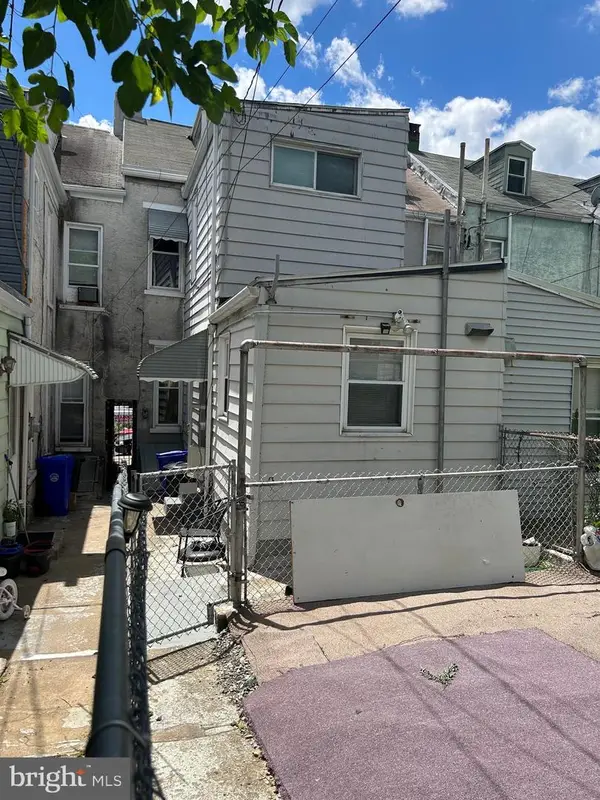
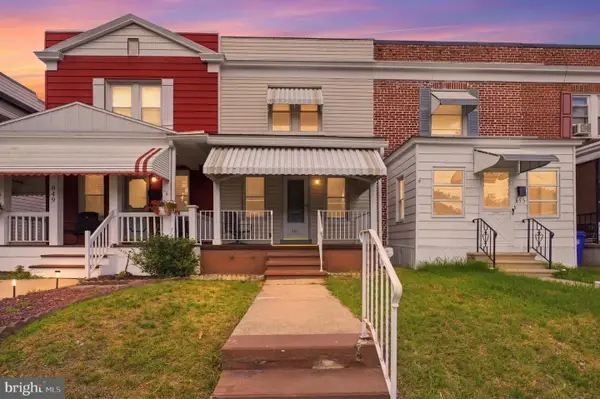
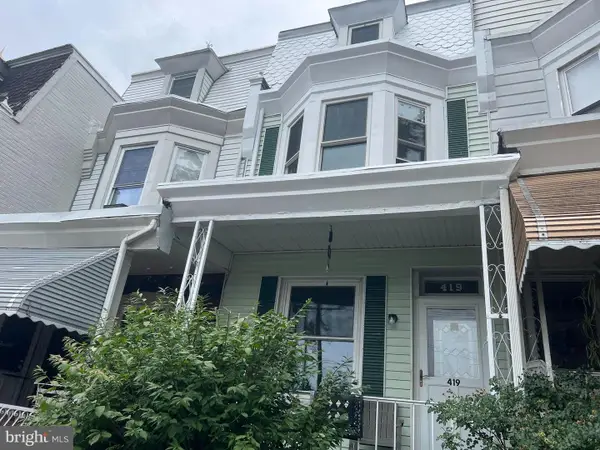 $219,900Active5 beds 2 baths1,358 sq. ft.
419 S 11th St, READING, PA 19602
MLS# PABK2074932Listed by: RE/MAX OF READING  $250,000Pending4 beds 2 baths1,296 sq. ft.
105 John Glenn Ave, READING, PA 19607
MLS# PABK2074070Listed by: AMERICAN HOMES REALTY GROUP- New
 $250,000Active3 beds 2 baths1,408 sq. ft.
1038 Fern Ave, READING, PA 19607
MLS# PABK2074846Listed by: KELLER WILLIAMS PLATINUM REALTY - WYOMISSING - New
 $123,000Active3 beds 1 baths769 sq. ft.
639 Birch St, READING, PA 19604
MLS# PABK2074868Listed by: BHHS HOMESALE REALTY- READING BERKS - New
 $195,000Active5 beds 1 baths1,648 sq. ft.
829 N 11th St, READING, PA 19604
MLS# PABK2074882Listed by: REALTY ONE GROUP ALLIANCE  $314,900Pending4 beds 2 baths1,432 sq. ft.
116 Park Rd, READING, PA 19610
MLS# PABK2074804Listed by: PAGODA REALTY ERA POWERED- Coming Soon
 $269,900Coming Soon3 beds 3 baths
1016-b Penn St, READING, PA 19602
MLS# PABK2074784Listed by: COLDWELL BANKER REALTY - Coming Soon
 $239,900Coming Soon2 beds 3 baths
1016-a Penn St, READING, PA 19602
MLS# PABK2074786Listed by: COLDWELL BANKER REALTY - Coming Soon
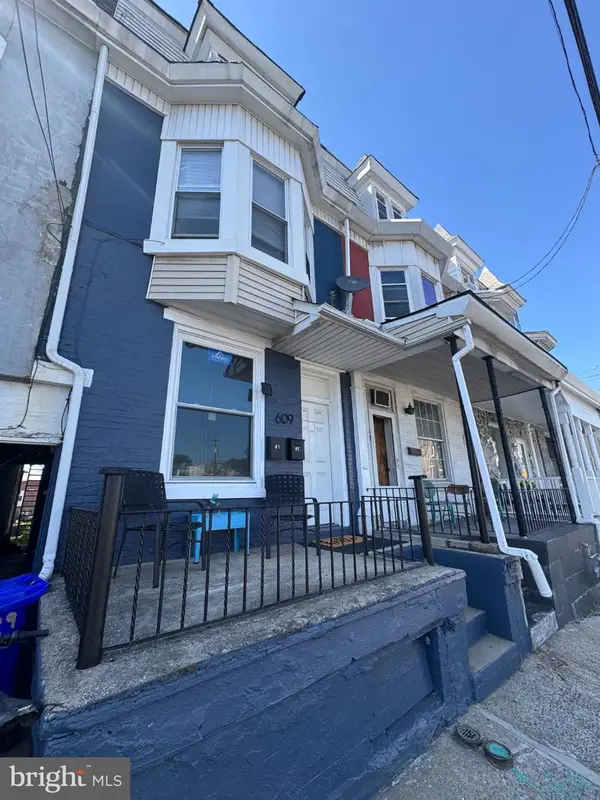 $265,000Coming Soon2 beds -- baths
609 E Lancaster Ave, READING, PA 19611
MLS# PABK2074834Listed by: JM DIAMOND REALTY  $225,000Pending2 beds 1 baths792 sq. ft.
411 Mcarthur Ave, READING, PA 19607
MLS# PABK2074780Listed by: IRON VALLEY REAL ESTATE OF BERKS- New
 $119,900Active3 beds 1 baths792 sq. ft.
529 S 17th St, READING, PA 19606
MLS# PABK2074794Listed by: IRON VALLEY REAL ESTATE OF BERKS - Coming Soon
 $159,900Coming Soon3 beds 1 baths
538 S 14th St, READING, PA 19602
MLS# PABK2074808Listed by: STOUT ASSOCIATES REALTORS 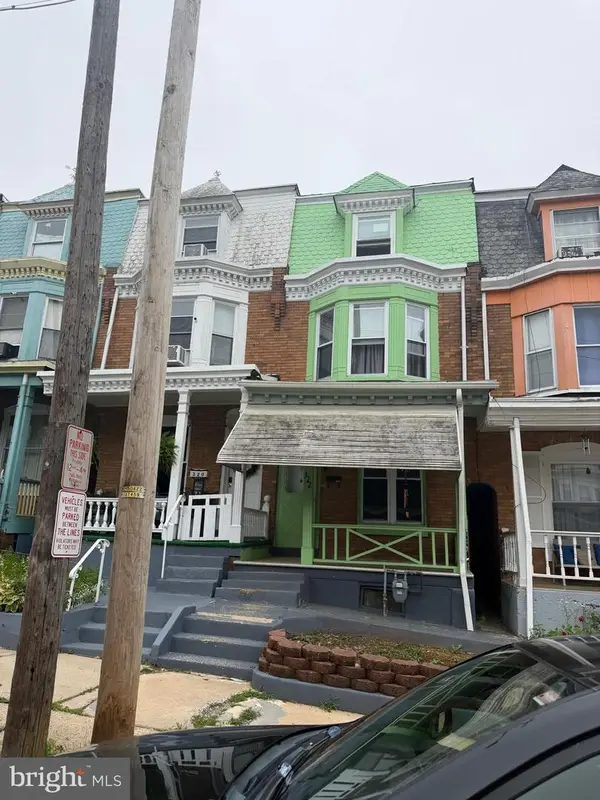 $185,000Active4 beds 2 baths3,405 sq. ft.
322 W Douglass St, READING, PA 19601
MLS# PABK2074712Listed by: IRON VALLEY REAL ESTATE OF BERKS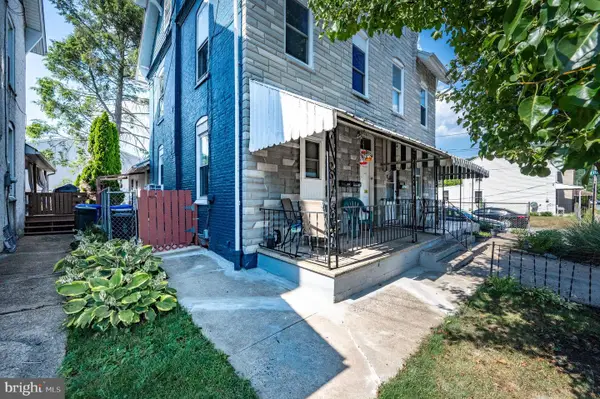 $209,900Pending3 beds -- baths1,626 sq. ft.
103 Upland Ave, READING, PA 19611
MLS# PABK2074674Listed by: DARYL TILLMAN REALTY GROUP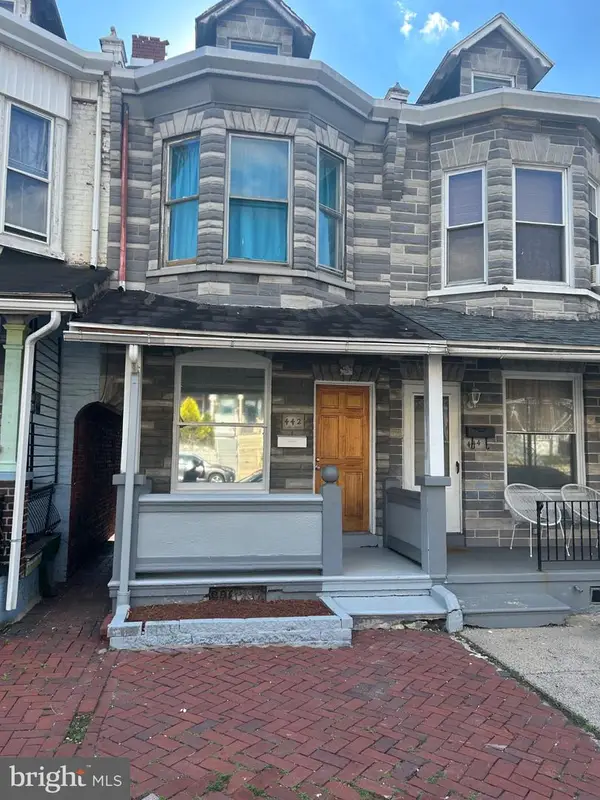 $175,000Active3 beds 1 baths951 sq. ft.
442 N 13th St, READING, PA 19604
MLS# PABK2074766Listed by: REALTY ONE GROUP ALLIANCE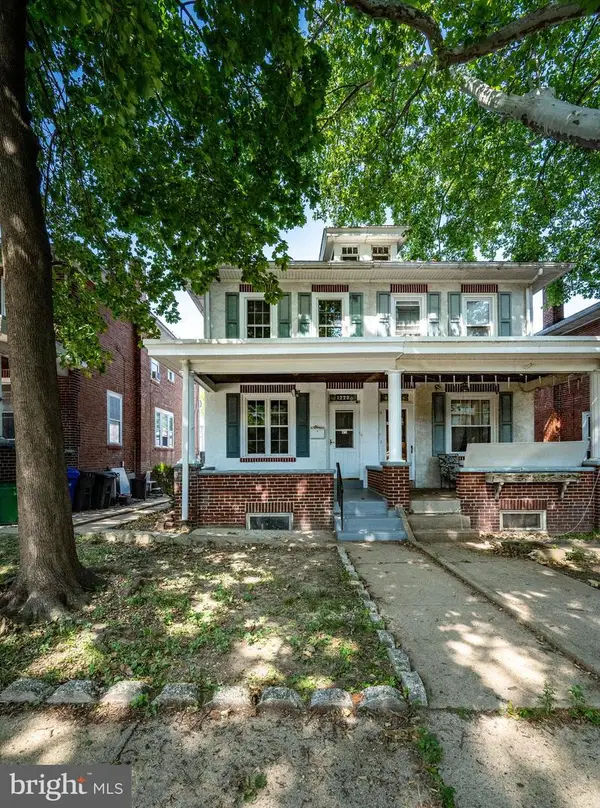 $264,900Active3 beds 2 baths1,316 sq. ft.
1228 Linden St, READING, PA 19604
MLS# PABK2074646Listed by: RAMUS REALTY GROUP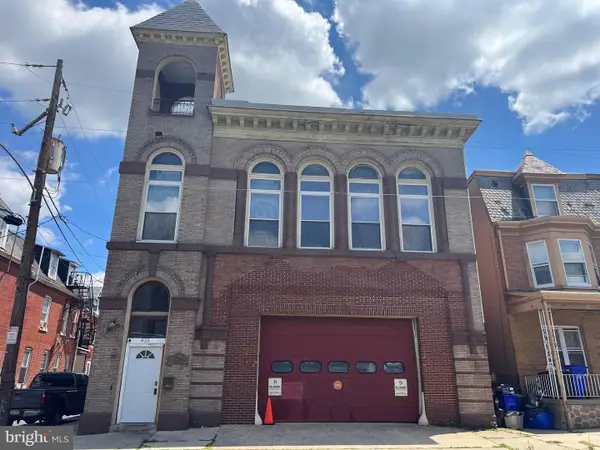
 $350,000Active5 beds 2 baths6,364 sq. ft.
433 S 15th St, READING, PA 19602
MLS# PABK2074754Listed by: CENTURY 21 GOLD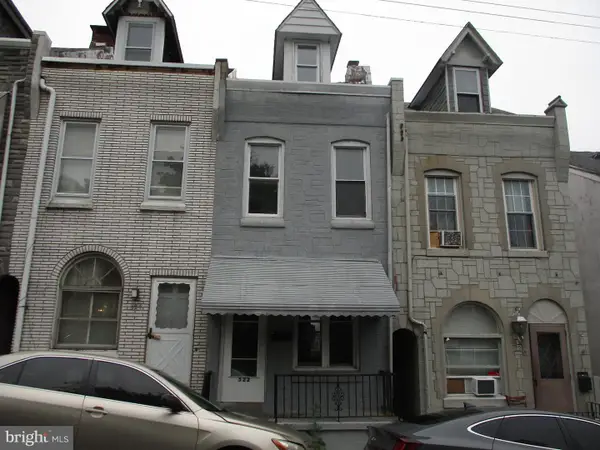 $119,900Pending3 beds 2 baths930 sq. ft.
522 S 17 1/2 St, READING, PA 19606
MLS# PABK2074672Listed by: RE/MAX OF READING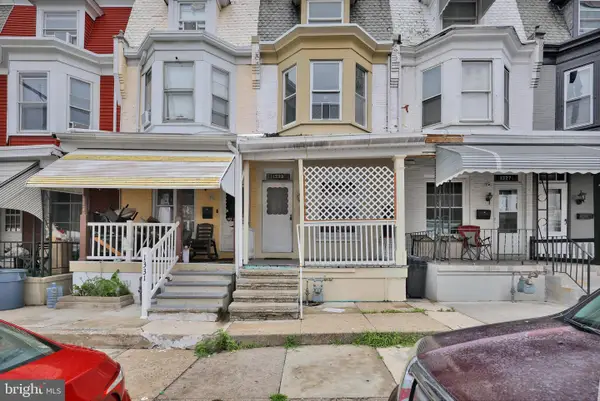 $199,900Pending5 beds 1 baths1,482 sq. ft.
1329 Church St, READING, PA 19601
MLS# PABK2074618Listed by: REALTY ONE GROUP ALLIANCE $249,900Active4 beds 2 baths1,590 sq. ft.
1413 N 12th St, READING, PA 19604
MLS# PABK2074522Listed by: COLDWELL BANKER REALTY $219,000Active3 beds 2 baths1,600 sq. ft.
1539 Moss St, READING, PA 19604
MLS# PABK2074620Listed by: UNITED REAL ESTATE STRIVE 212 $215,000Active5 beds 2 baths1,412 sq. ft.
1324 N 10th St, READING, PA 19604
MLS# PABK2074626Listed by: COLDWELL BANKER REALTY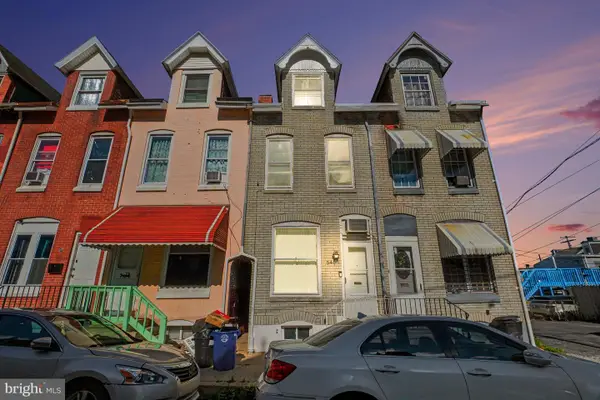 $214,900Active4 beds 3 baths1,248 sq. ft.
546 Locust St, READING, PA 19604
MLS# PABK2074642Listed by: COLDWELL BANKER REALTY $225,000Pending-- beds -- baths2,050 sq. ft.
1234 Church St, READING, PA 19601
MLS# PABK2074570Listed by: REALTY ONE GROUP ALLIANCE $225,000Active5 beds 1 baths1,547 sq. ft.
1042 Church St, READING, PA 19601
MLS# PABK2074566Listed by: REALTY ONE GROUP ALLIANCE $50,000Active0.03 Acres
133-135 Lemon St, READING, PA 19602
MLS# PABK2074578Listed by: COLDWELL BANKER REALTY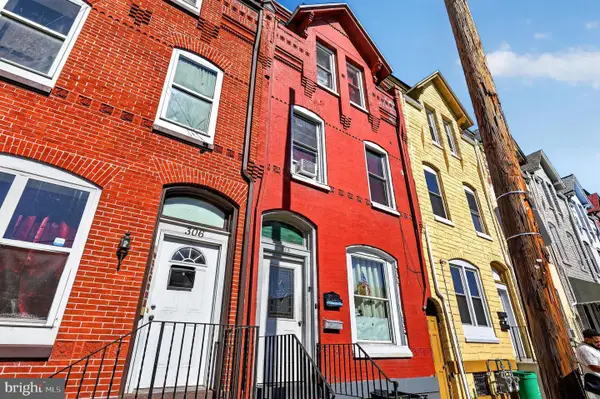 $285,000Active5 beds -- baths2,062 sq. ft.
308 N 4th St, READING, PA 19601
MLS# PABK2074472Listed by: COLDWELL BANKER REALTY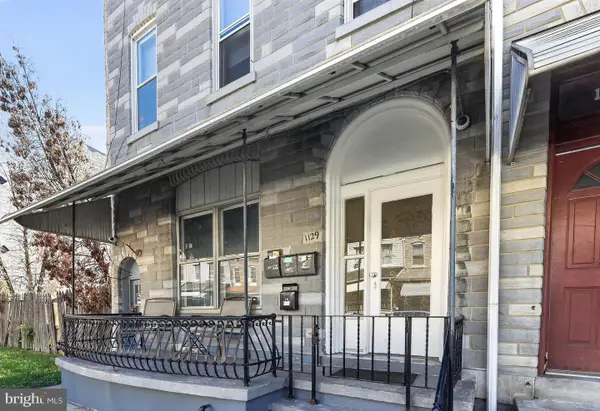 $350,000Active5 beds -- baths2,394 sq. ft.
1129 N 9th St, READING, PA 19604
MLS# PABK2074482Listed by: COLDWELL BANKER REALTY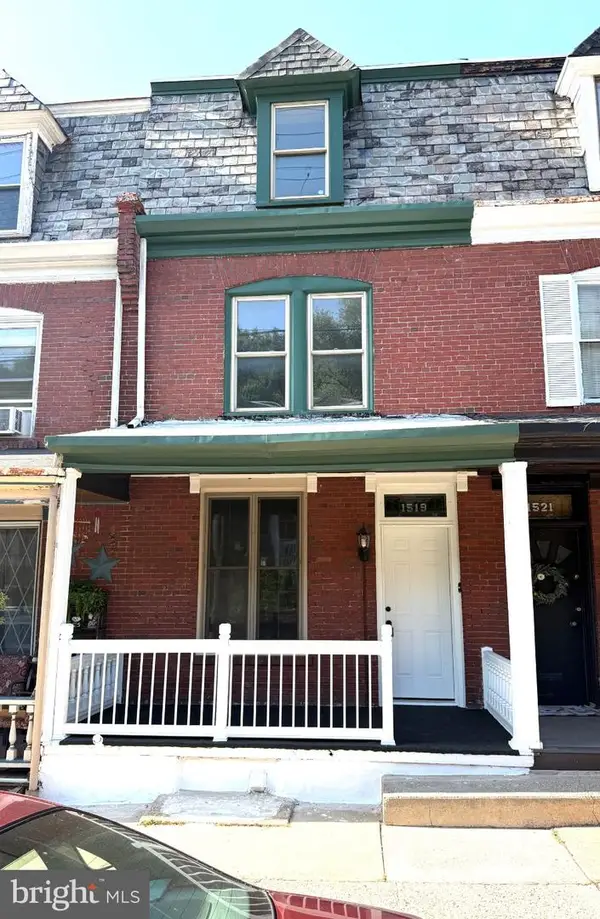 $239,000Active4 beds 2 baths1,615 sq. ft.
1519 Fairview St, READING, PA 19606
MLS# PABK2074556Listed by: IRON VALLEY REAL ESTATE OF BERKS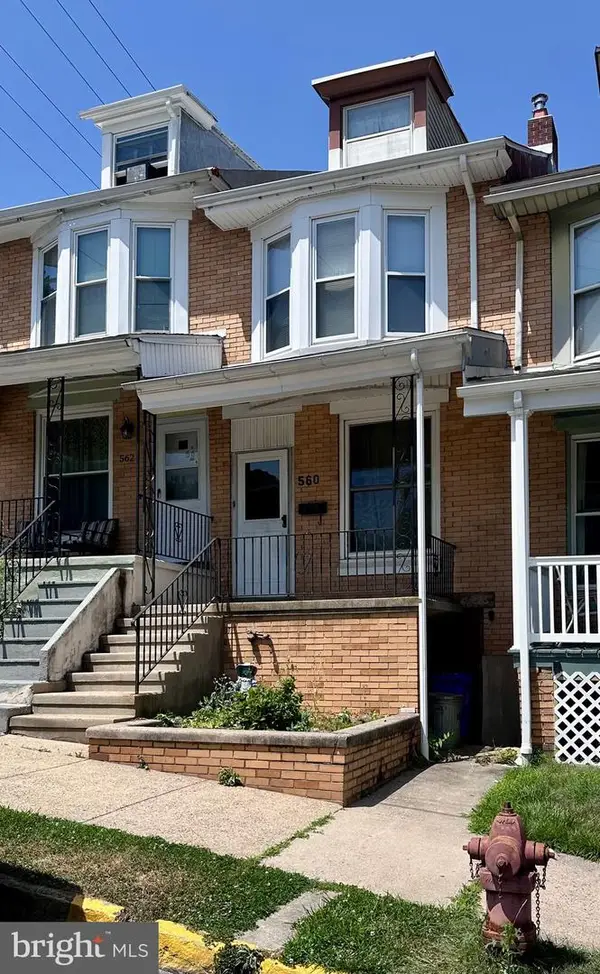 $154,850Pending3 beds 1 baths1,063 sq. ft.
560 S 16th St, READING, PA 19606
MLS# PABK2074548Listed by: REALTY ONE GROUP EXCLUSIVE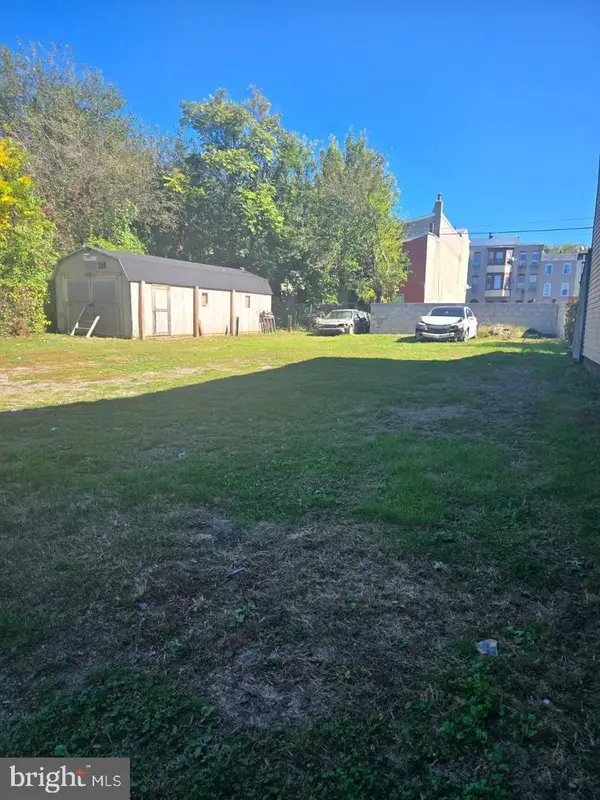 $25,000Active0.03 Acres
133 Lemon St, READING, PA 19602
MLS# PABK2074532Listed by: COLDWELL BANKER REALTY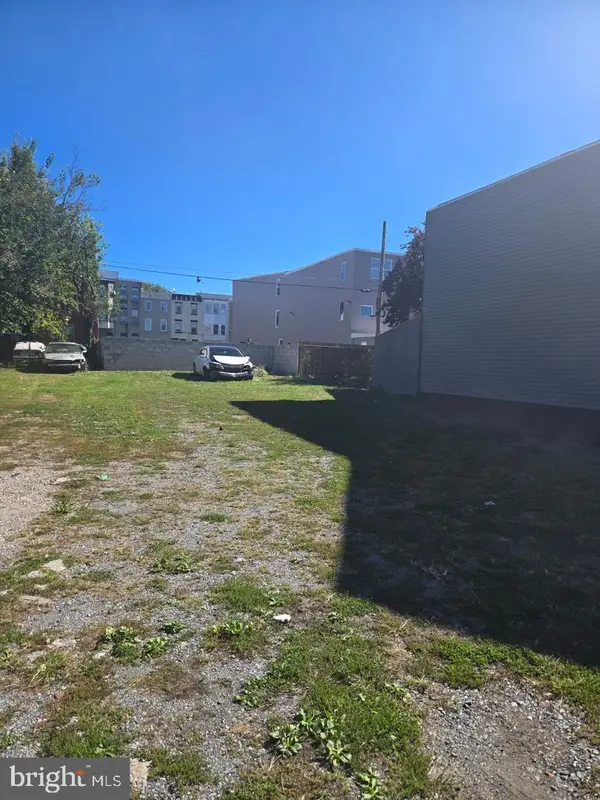 $25,000Active0.03 Acres
135 Lemon St, READING, PA 19602
MLS# PABK2074536Listed by: COLDWELL BANKER REALTY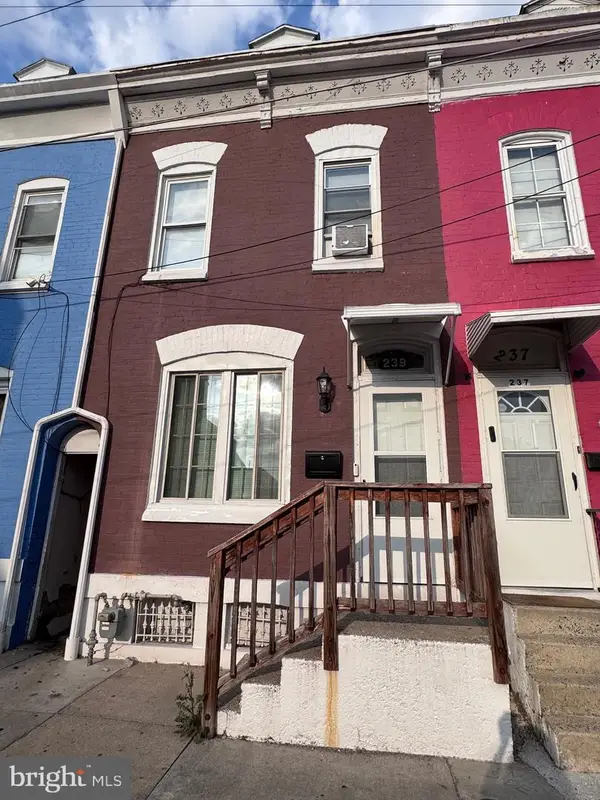 $150,000Pending4 beds 2 baths1,222 sq. ft.
239 Mulberry St, READING, PA 19604
MLS# PABK2073922Listed by: RE/MAX OF READING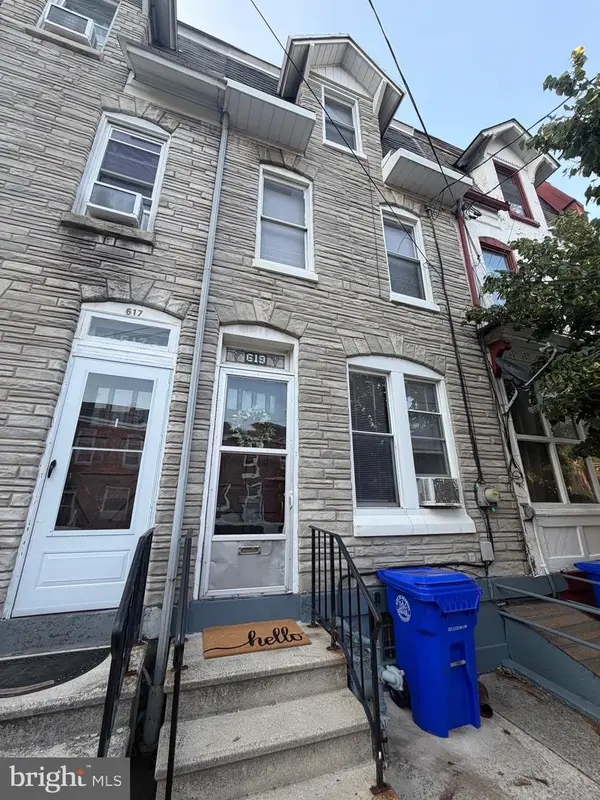 $139,900Pending4 beds 1 baths1,374 sq. ft.
619 Willow St, READING, PA 19602
MLS# PABK2074510Listed by: COLDWELL BANKER REALTY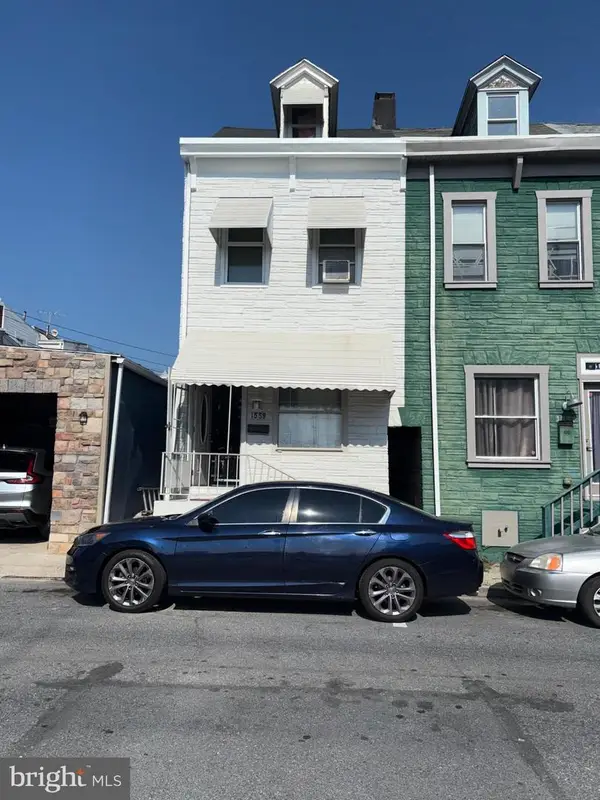 $180,000Pending3 beds 2 baths952 sq. ft.
1559 Moss St, READING, PA 19604
MLS# PABK2074512Listed by: UNITED REAL ESTATE STRIVE 212 $214,900Pending2 beds 1 baths768 sq. ft.
2217 Fairview Ave, READING, PA 19606
MLS# PABK2074506Listed by: LIGHT HOUSE REALTORS, LLC $165,000Pending5 beds 1 baths2,115 sq. ft.
910 N 5th St, READING, PA 19601
MLS# PABK2074416Listed by: RE/MAX OF READING $250,000Active5 beds -- baths2,192 sq. ft.
423 Spring St, READING, PA 19601
MLS# PABK2074300Listed by: COMMONWEALTH REAL ESTATE LLC $399,900Active5 beds 4 baths5,014 sq. ft.
1847 Elder St, READING, PA 19604
MLS# PABK2074352Listed by: IRON VALLEY REAL ESTATE OF BERKS $215,000Active4 beds 2 baths1,663 sq. ft.
812 Bingaman St, READING, PA 19602
MLS# PABK2074428Listed by: IRON VALLEY REAL ESTATE OF BERKS $175,000Active3 beds 1 baths1,032 sq. ft.
1749 Perkiomen Ave, READING, PA 19602
MLS# PABK2074430Listed by: COLDWELL BANKER REALTY $350,000Active6 beds -- baths
518 Franklin St, READING, PA 19602
MLS# PABK2074060Listed by: BOLD REALTY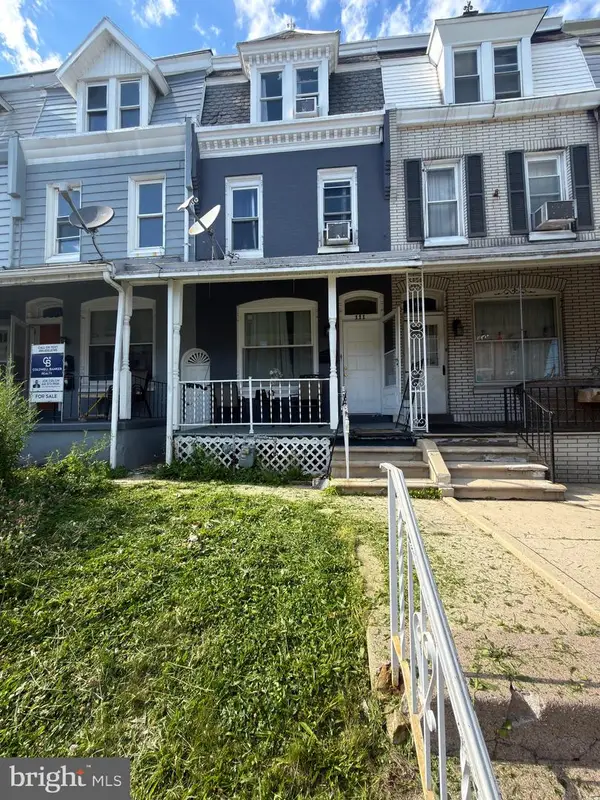 $170,000Pending5 beds 2 baths1,742 sq. ft.
111 West Oley, READING, PA 19601
MLS# PABK2074140Listed by: IRON VALLEY REAL ESTATE OF BERKS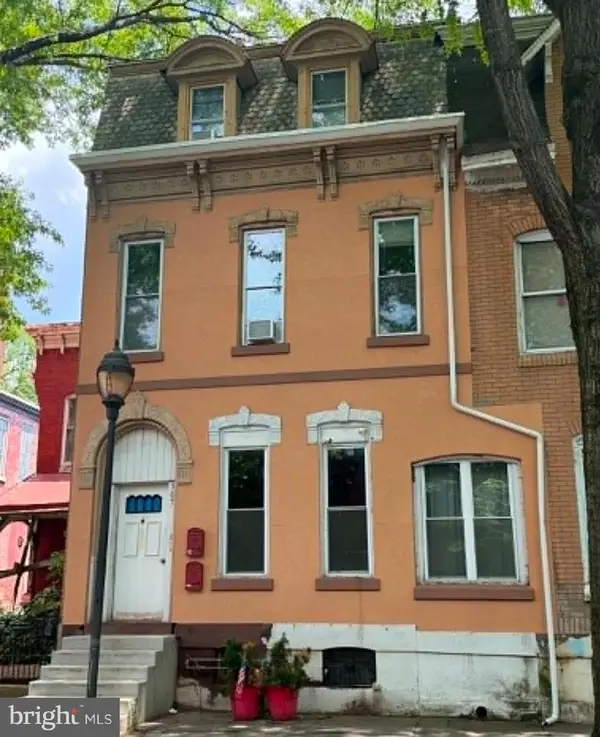 $220,000Pending5 beds -- baths2,840 sq. ft.
307 S 6th St, READING, PA 19602
MLS# PABK2074130Listed by: UNITED REAL ESTATE STRIVE 212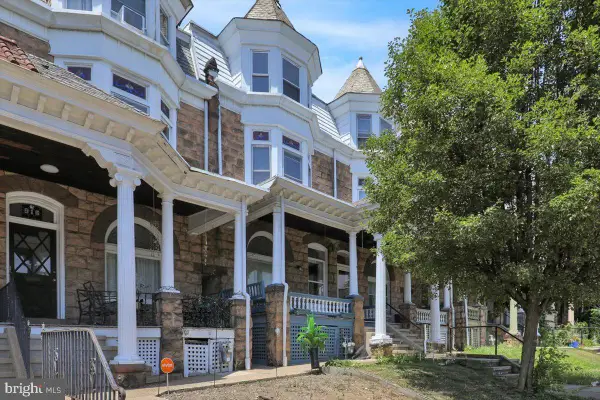 $225,000Pending5 beds 2 baths2,139 sq. ft.
918 N 5th St, READING, PA 19601
MLS# PABK2074170Listed by: KELLER WILLIAMS PLATINUM REALTY - WYOMISSING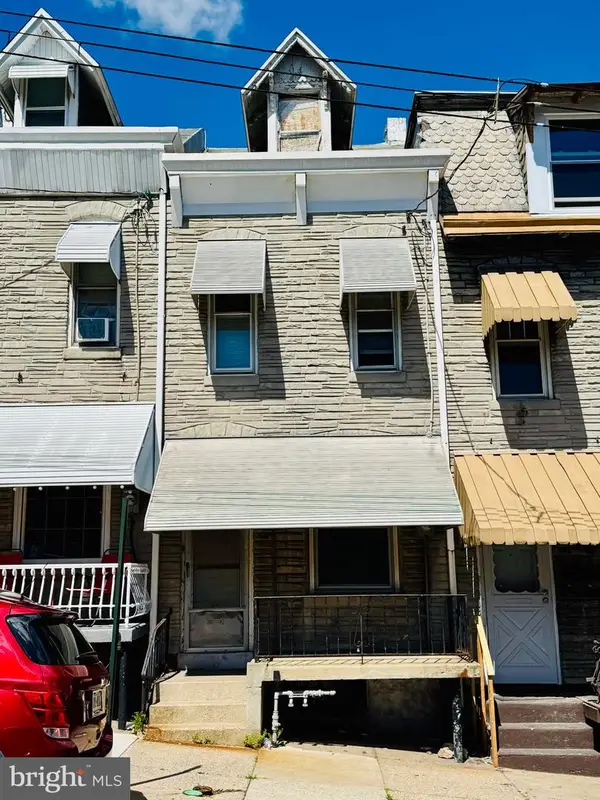 $55,000Pending3 beds 1 baths1,000 sq. ft.
510 S 11th St, READING, PA 19602
MLS# PABK2074236Listed by: RE/MAX OF READING- Coming Soon
 $275,000Coming Soon3 beds 2 baths
2416 High St, READING, PA 19605
MLS# PABK2074168Listed by: KELLER WILLIAMS PLATINUM REALTY - WYOMISSING 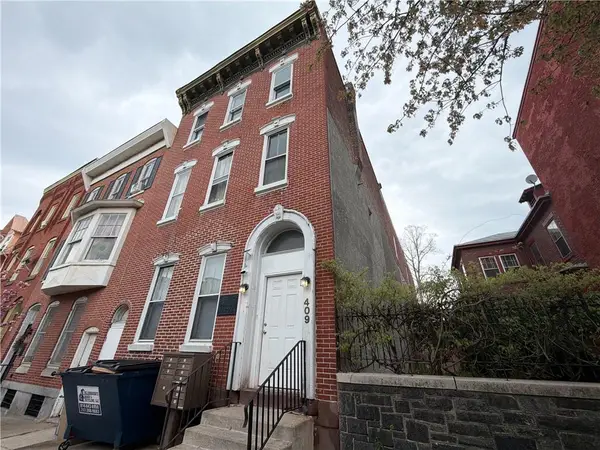 $995,000Active-- beds -- baths10,350 sq. ft.
409 Walnut Street, Reading City, PA 19601
MLS# 779632Listed by: THE REAL ESTATE FIRM&PROPMNGMT $389,000Pending5 beds 4 baths3,791 sq. ft.
800 N 3rd St, READING, PA 19601
MLS# PABK2074074Listed by: AMO REALTY $199,900Pending3 beds 1 baths1,170 sq. ft.
1426 Birch St, READING, PA 19604
MLS# PABK2074150Listed by: RE/MAX ACHIEVERS-COLLEGEVILLE $138,990Pending5 beds 1 baths1,776 sq. ft.
521 Bingaman St, READING, PA 19602
MLS# PABK2073918Listed by: UNITED REAL ESTATE STRIVE 212 $289,900Pending3 beds 2 baths1,374 sq. ft.
438 Oak Tc, READING, PA 19611
MLS# PABK2074112Listed by: COLDWELL BANKER REALTY $210,000Pending3 beds 2 baths1,146 sq. ft.
1401 Perry St, READING, PA 19604
MLS# PABK2074098Listed by: UNITED REAL ESTATE STRIVE 212 $284,900Active5 beds -- baths2,618 sq. ft.
154 Clymer St, READING, PA 19602
MLS# PABK2074076Listed by: REALTY ONE GROUP ALLIANCE $220,000Pending5 beds 2 baths1,685 sq. ft.
1133 Douglass St, READING, PA 19604
MLS# PABK2074034Listed by: IRON VALLEY REAL ESTATE OF BERKS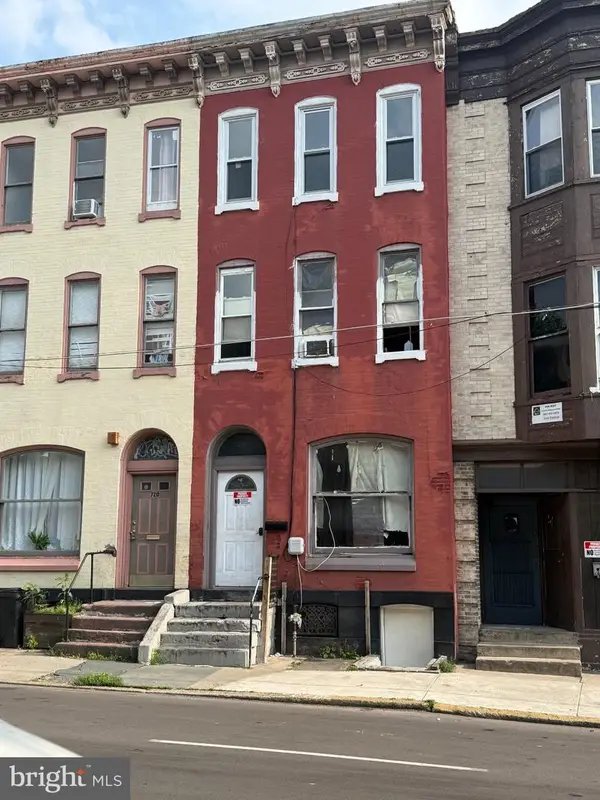 $249,900Active1 beds -- baths2,118 sq. ft.
718 Franklin St, READING, PA 19602
MLS# PABK2074086Listed by: UNITED REAL ESTATE STRIVE 212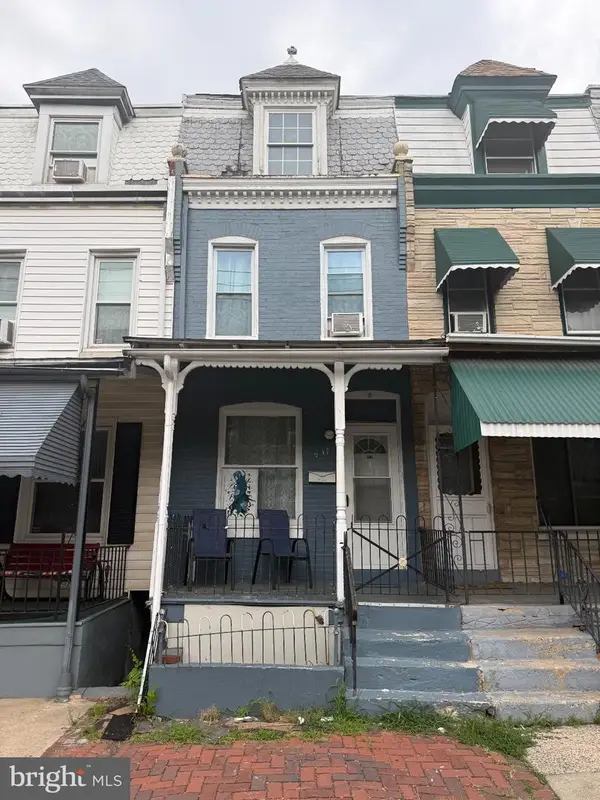 $179,900Active3 beds 1 baths1,164 sq. ft.
431 W Greenwich St, READING, PA 19601
MLS# PABK2074016Listed by: UNITED REAL ESTATE STRIVE 212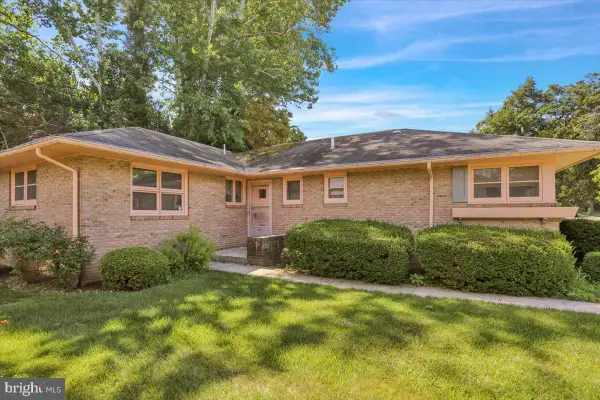 $269,900Active3 beds 2 baths1,704 sq. ft.
1815 N 16th St, READING, PA 19604
MLS# PABK2073998Listed by: REAL OF PENNSYLVANIA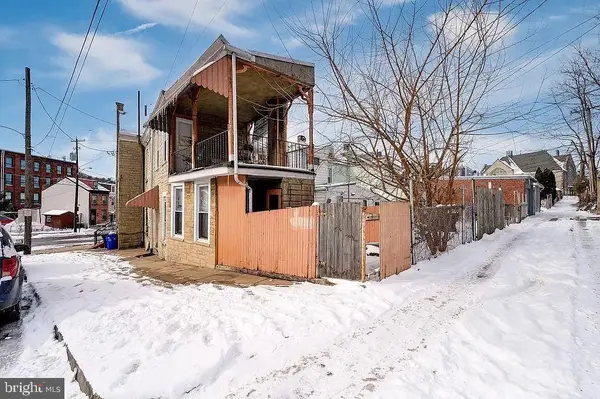 $217,000Active4 beds 2 baths1,350 sq. ft.
349 S Miller St, READING, PA 19602
MLS# PABK2073860Listed by: UNITED REAL ESTATE STRIVE 212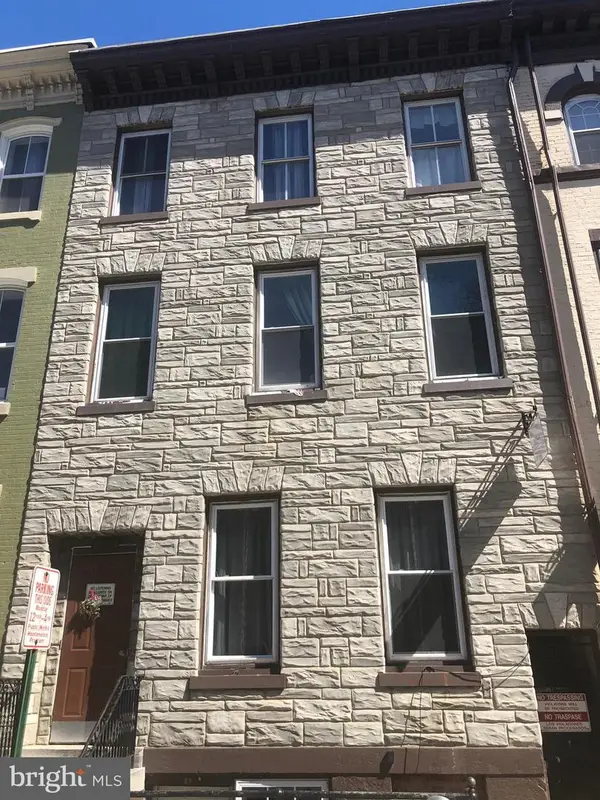 $550,000Pending5 beds -- baths
117 S 6th St, READING, PA 19602
MLS# PABK2073858Listed by: BOLD REALTY $269,900Pending3 beds 1 baths1,210 sq. ft.
2120 Peters Rd, READING, PA 19601
MLS# PABK2073686Listed by: RE/MAX OF READING $369,900Active4 beds 3 baths2,174 sq. ft.
1901 N 15th St, READING, PA 19604
MLS# PABK2073852Listed by: RE/MAX OF READING $199,900Active4 beds 3 baths1,154 sq. ft.
1136 Muhlenberg St, READING, PA 19602
MLS# PABK2073660Listed by: UNITED REAL ESTATE STRIVE 212 $189,000Active4 beds 3 baths1,040 sq. ft.
1329 N 9th St, READING, PA 19604
MLS# PABK2073930Listed by: UNITED REAL ESTATE STRIVE 212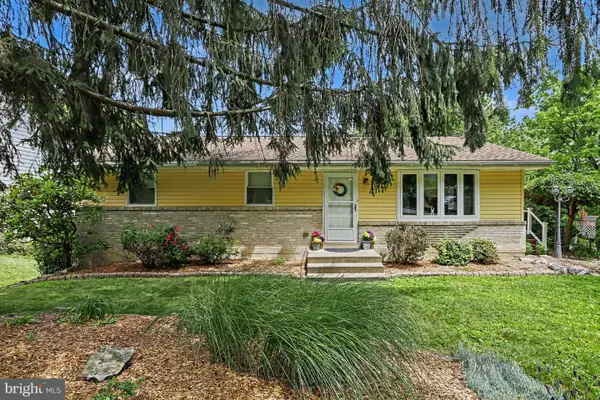 $299,900Pending3 beds 2 baths1,698 sq. ft.
12 Bare Avenue, READING, PA 19607
MLS# PABK2073632Listed by: RE/MAX READY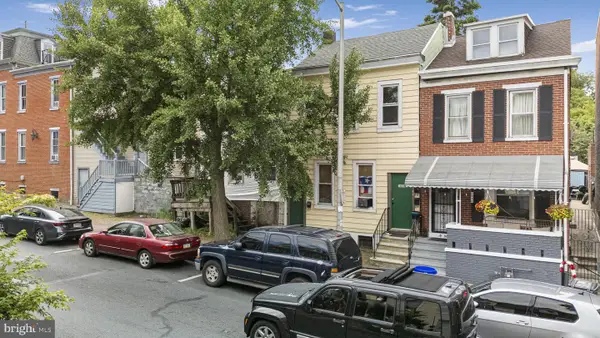 $314,900Active4 beds 3 baths1,355 sq. ft.
1038 Walnut St, READING, PA 19601
MLS# PABK2073908Listed by: LIGHT HOUSE REALTORS, LLC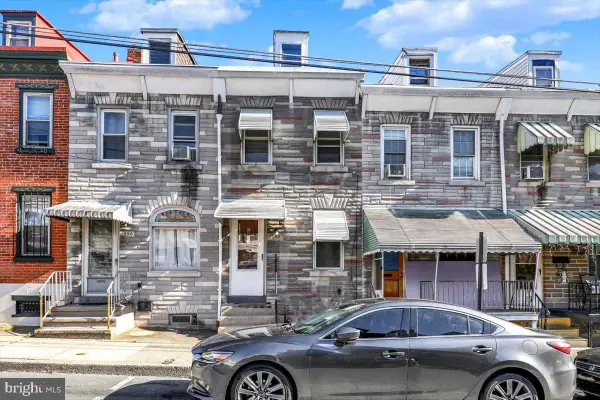 $129,900Pending3 beds 1 baths768 sq. ft.
1348 Muhlenberg St, READING, PA 19602
MLS# PABK2073910Listed by: RE/MAX OF READING $200,000Active3 beds 2 baths1,554 sq. ft.
1537 N 9th St, READING, PA 19604
MLS# PABK2073592Listed by: PAGODA REALTY ERA POWERED $165,000Pending4 beds 2 baths1,540 sq. ft.
129 Poplar St, READING, PA 19601
MLS# PABK2073848Listed by: KELLER WILLIAMS PLATINUM REALTY - WYOMISSING $235,000Pending3 beds 1 baths1,702 sq. ft.
1119 New Holland Rd, READING, PA 19607
MLS# PABK2073838Listed by: IRON VALLEY REAL ESTATE OF BERKS $300,000Pending4 beds 1 baths2,019 sq. ft.
401 Ann, READING, PA 19611
MLS# PABK2073830Listed by: RE/MAX OF READING $112,000Active2 beds 1 baths584 sq. ft.
1037 Cotton St, READING, PA 19602
MLS# PABK2073782Listed by: BOLD REALTY $167,000Active4 beds 1 baths1,225 sq. ft.
1541 Moss St, READING, PA 19604
MLS# PABK2073772Listed by: IRON VALLEY REAL ESTATE OF BERKS $124,900Active2 beds 1 baths744 sq. ft.
470 Spring Garden St, READING, PA 19602
MLS# PABK2073748Listed by: COLDWELL BANKER REALTY $169,900Active4 beds 1 baths1,225 sq. ft.
617 S 10th St, READING, PA 19602
MLS# PABK2073664Listed by: CENTURY 21 GOLD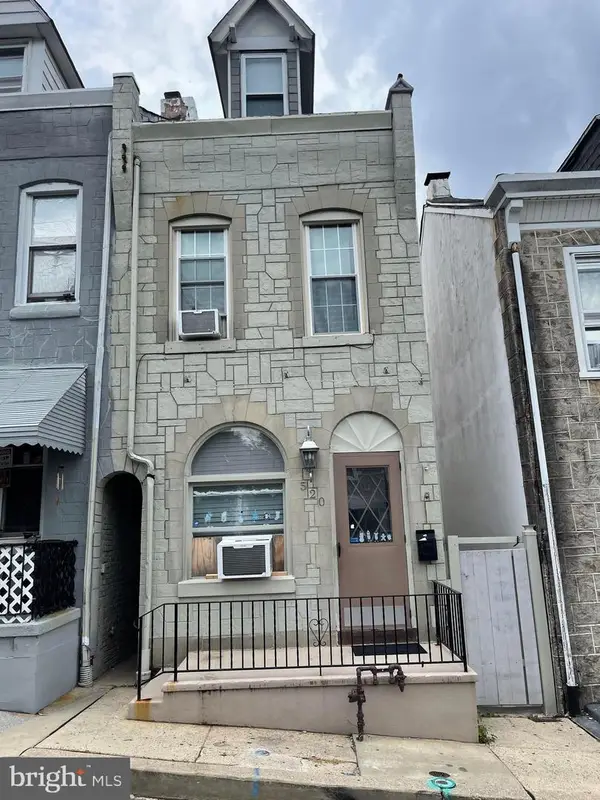 $135,000Active4 beds 1 baths975 sq. ft.
520 S 17 1/2 St, READING, PA 19606
MLS# PABK2072984Listed by: JM DIAMOND REALTY $202,500Active4 beds 2 baths1,380 sq. ft.
1034 Washington St, READING, PA 19601
MLS# PABK2073484Listed by: SPM REAL ESTATE GROUP $185,000Active3 beds 2 baths1,214 sq. ft.
520 Moss St, READING, PA 19604
MLS# PABK2073560Listed by: UNITED REAL ESTATE STRIVE 212 $149,900Active4 beds 2 baths1,160 sq. ft.
326 Spring Garden St, READING, PA 19602
MLS# PABK2073652Listed by: IRON VALLEY REAL ESTATE OF BERKS $109,000Active3 beds 1 baths844 sq. ft.
915 Culvert St, READING, PA 19602
MLS# PABK2073320Listed by: PRIME REALTY PARTNERS $230,000Pending2 beds -- baths1,852 sq. ft.
534 N 9th St, READING, PA 19604
MLS# PABK2073610Listed by: COLDWELL BANKER REALTY $184,900Pending5 beds 1 baths1,522 sq. ft.
1312 Church St, READING, PA 19601
MLS# PABK2073590Listed by: PROSPERITY REAL ESTATE & INVESTMENT SERVICES $259,900Active5 beds 2 baths2,264 sq. ft.
551 N 11th St, READING, PA 19604
MLS# PABK2073596Listed by: COLDWELL BANKER REALTY $219,900Active3 beds 2 baths1,426 sq. ft.
541 Spring St, READING, PA 19601
MLS# PABK2073580Listed by: IRON VALLEY REAL ESTATE OF BERKS $466,000Pending7 beds -- baths3,748 sq. ft.
622 N 3rd St, READING, PA 19601
MLS# PABK2073562Listed by: COLDWELL BANKER REALTY $144,500Pending3 beds 1 baths966 sq. ft.
1122 Buttonwood St, READING, PA 19604
MLS# PABK2073502Listed by: COLDWELL BANKER REALTY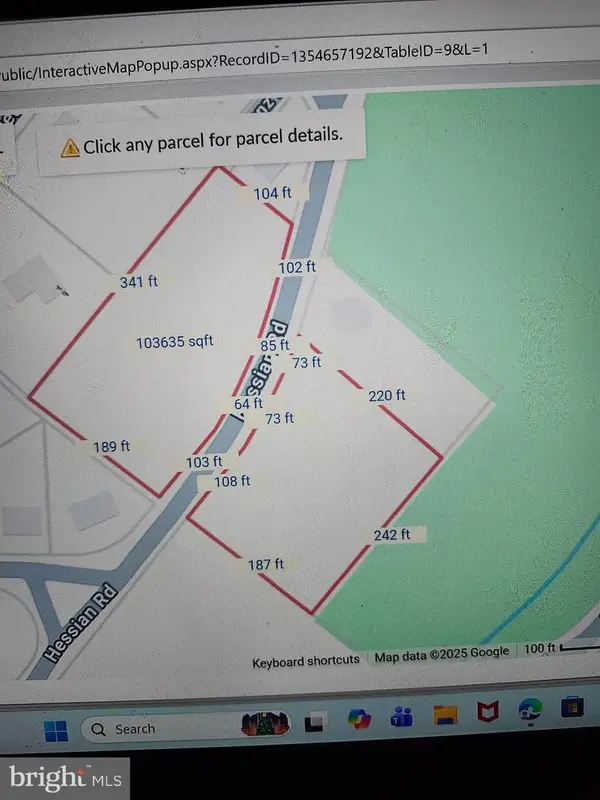 $75,000Active2.38 Acres
0 Hession Road, READING, PA 19602
MLS# PABK2073540Listed by: BOLD REALTY $229,900Pending3 beds 1 baths1,194 sq. ft.
327 Newport Ave, READING, PA 19611
MLS# PABK2073294Listed by: RE/MAX OF READING $180,000Active3 beds 2 baths1,094 sq. ft.
1247 Oley St, READING, PA 19604
MLS# PABK2073530Listed by: COLDWELL BANKER REALTY $245,000Active3 beds 2 baths1,392 sq. ft.
1448 Luzerne St, READING, PA 19601
MLS# PABK2073534Listed by: REALTY ONE GROUP ALLIANCE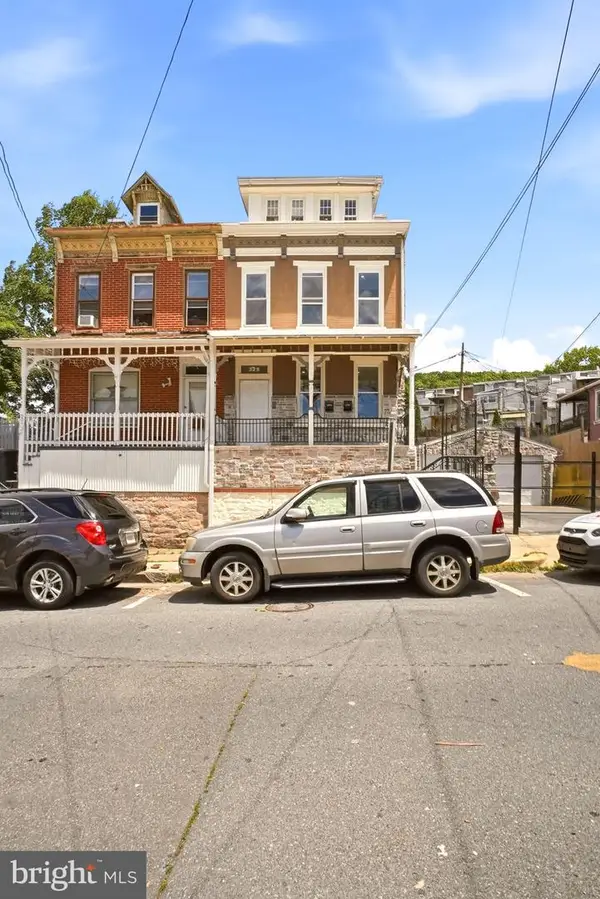 $329,900Active5 beds -- baths2,108 sq. ft.
329 Lombard St, READING, PA 19604
MLS# PABK2073528Listed by: REALTY ONE GROUP ALLIANCE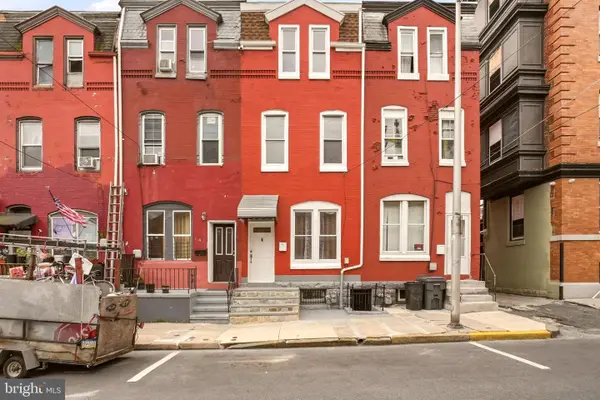 $209,900Active5 beds 2 baths1,848 sq. ft.
616 Elm St, READING, PA 19601
MLS# PABK2073458Listed by: REALTY ONE GROUP ALLIANCE $259,900Pending3 beds 2 baths1,184 sq. ft.
102 Yarnell St, READING, PA 19611
MLS# PABK2072680Listed by: WEIKEL REALTY GROUP LLC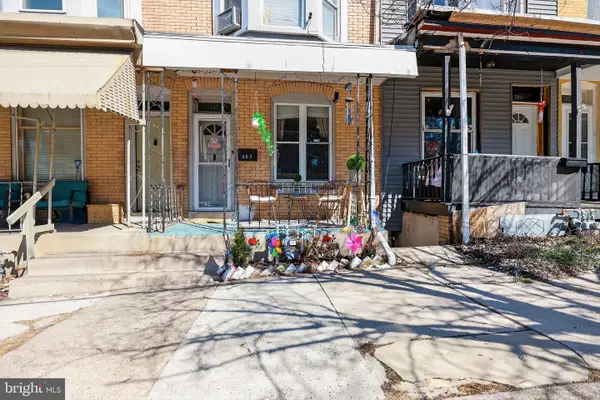 $184,900Pending5 beds 2 baths1,643 sq. ft.
327 W Windsor St, READING, PA 19601
MLS# PABK2073494Listed by: COLDWELL BANKER REALTY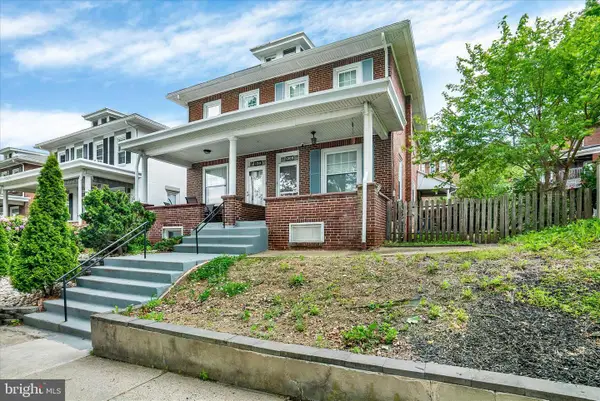 $222,000Pending3 beds 1 baths1,120 sq. ft.
1209 Linden St, READING, PA 19604
MLS# PABK2071838Listed by: SANDS & COMPANY REAL ESTATE $124,900Pending5 beds 2 baths1,882 sq. ft.
948 N 11th St, READING, PA 19604
MLS# PABK2073072Listed by: COLDWELL BANKER REALTY $239,900Pending5 beds 2 baths2,350 sq. ft.
1339 N 11th St, READING, PA 19604
MLS# PABK2073374Listed by: IRON VALLEY REAL ESTATE OF BERKS $180,000Active5 beds 2 baths1,944 sq. ft.
1137 Cotton St, READING, PA 19602
MLS# PABK2073394Listed by: KELLER WILLIAMS PLATINUM REALTY - WYOMISSING $234,900Pending2 beds 1 baths1,248 sq. ft.
1027 Commonwealth Blvd, READING, PA 19607
MLS# PABK2073004Listed by: RE/MAX OF READING $229,000Pending5 beds -- baths1,456 sq. ft.
728 Franklin St, READING, PA 19602
MLS# PABK2073438Listed by: BHHS HOMESALE REALTY- READING BERKS $265,000Pending2 beds 2 baths1,068 sq. ft.
1402 Brooke Blvd, READING, PA 19607
MLS# PABK2073372Listed by: KELLER WILLIAMS ELITE $180,000Pending3 beds 2 baths1,234 sq. ft.
1538 Fairview St, READING, PA 19606
MLS# PABK2073362Listed by: RE/MAX OF READING $329,900Active3 beds 1 baths1,528 sq. ft.
2122 Hampden Blvd, READING, PA 19604
MLS# PABK2073328Listed by: UNITED REAL ESTATE STRIVE 212 $265,500Active2 beds -- baths1,200 sq. ft.
1208 N 6th St, READING, PA 19601
MLS# PABK2073354Listed by: SPM REAL ESTATE GROUP $240,000Pending6 beds 3 baths2,700 sq. ft.
207 N 10th St, READING, PA 19601
MLS# PABK2073342Listed by: UNITED REAL ESTATE STRIVE 212 $200,000Pending3 beds 2 baths1,392 sq. ft.
29 Arlington St, READING, PA 19611
MLS# PABK2072836Listed by: KELLER WILLIAMS PLATINUM REALTY - WYOMISSING $135,000Active2 beds 1 baths984 sq. ft.
338 Cedar St, READING, PA 19601
MLS# PABK2072968Listed by: JM DIAMOND REALTY $195,000Active3 beds 1 baths1,034 sq. ft.
535 Moss St, READING, PA 19604
MLS# PABK2072972Listed by: JM DIAMOND REALTY $285,000Active2 beds -- baths1,148 sq. ft.
1342 Allegheny Ave, READING, PA 19601
MLS# PABK2072974Listed by: JM DIAMOND REALTY $185,000Active4 beds 1 baths1,417 sq. ft.
415 S 14th St, READING, PA 19602
MLS# PABK2072982Listed by: JM DIAMOND REALTY $194,900Active4 beds 1 baths1,217 sq. ft.
1136 N 10th St, READING, PA 19604
MLS# PABK2073280Listed by: IRON VALLEY REAL ESTATE OF BERKS $235,000Pending4 beds 2 baths2,073 sq. ft.
227 N 10th St, READING, PA 19601
MLS# PABK2067886Listed by: UNITED REAL ESTATE STRIVE 212 $215,000Pending3 beds 2 baths1,320 sq. ft.
1206 Scott St, READING, PA 19611
MLS# PABK2073238Listed by: BHHS HOMESALE REALTY- READING BERKS $330,000Pending3 beds 2 baths1,968 sq. ft.
1907 Holly Rd, READING, PA 19602
MLS# PABK2073192Listed by: BERKSHIRE HATHAWAY HOMESERVICES HOMESALE REALTY $277,500Pending3 beds 2 baths998 sq. ft.
1427 Lacrosse Ave, READING, PA 19607
MLS# PABK2072938Listed by: COLDWELL BANKER REALTY $179,900Pending4 beds 2 baths1,530 sq. ft.
612 Locust St, READING, PA 19604
MLS# PABK2073164Listed by: IRON VALLEY REAL ESTATE OF BERKS $310,000Pending3 beds 3 baths2,426 sq. ft.
1840 Lorraine Rd, READING, PA 19604
MLS# PABK2073208Listed by: RE/MAX OF READING $190,000Pending3 beds 2 baths912 sq. ft.
312 Summit Ave, READING, PA 19611
MLS# PABK2073086Listed by: BHHS HOMESALE REALTY- READING BERKS $164,500Pending4 beds 2 baths1,514 sq. ft.
1737 Thorn St, READING, PA 19601
MLS# PABK2073174Listed by: THE GREENE REALTY GROUP $190,000Active4 beds 2 baths1,353 sq. ft.
1424 Muhlenberg St, READING, PA 19602
MLS# PABK2072624Listed by: REALTY MARK ASSOCIATES $175,000Pending5 beds 1 baths2,276 sq. ft.
230 W Douglass St, READING, PA 19601
MLS# PABK2073134Listed by: RE/MAX OF READING $260,000Pending2 beds 1 baths960 sq. ft.
430 Summit Ave, READING, PA 19607
MLS# PABK2073182Listed by: BHHS HOMESALE REALTY- READING BERKS $269,900Pending7 beds 2 baths2,159 sq. ft.
212 W Greenwich St, READING, PA 19601
MLS# PABK2073188Listed by: SAUNDERS REAL ESTATE $245,000Pending4 beds 2 baths1,451 sq. ft.
2140 Kutztown Rd, READING, PA 19605
MLS# PABK2073128Listed by: REALTY ONE GROUP ALLIANCE $224,900Pending3 beds 2 baths1,120 sq. ft.
122 Belvedere Ave, READING, PA 19611
MLS# PABK2073122Listed by: COLDWELL BANKER REALTY $235,000Active5 beds 1 baths1,877 sq. ft.
221 W Oley St, READING, PA 19601
MLS# PABK2073118Listed by: COLDWELL BANKER REALTY $139,900Pending2 beds 1 baths936 sq. ft.
547 S 10th St, READING, PA 19602
MLS# PABK2073092Listed by: PAGODA REALTY ERA POWERED $229,900Active3 beds 2 baths1,943 sq. ft.
1375 Pershing Blvd #608, READING, PA 19607
MLS# PABK2072994Listed by: UNITED REAL ESTATE STRIVE 212 $164,800Active3 beds 2 baths1,146 sq. ft.
1105 Green St, READING, PA 19604
MLS# PABK2073074Listed by: COLDWELL BANKER REALTY $190,000Pending5 beds 2 baths1,992 sq. ft.
813 N Front St, READING, PA 19601
MLS# PABK2072952Listed by: THE GREENE REALTY GROUP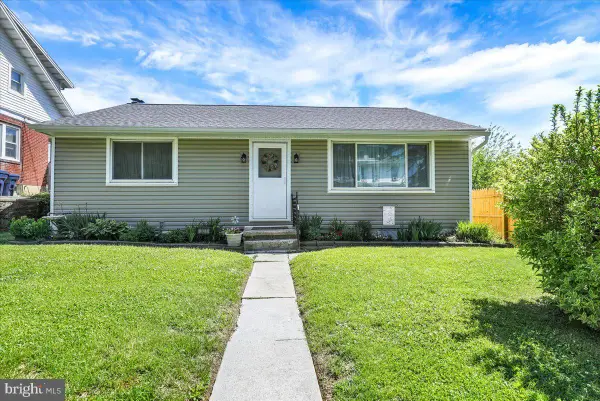 $300,000Pending3 beds 2 baths1,292 sq. ft.
307 Summit Ave, READING, PA 19607
MLS# PABK2073018Listed by: KELLER WILLIAMS PLATINUM REALTY - WYOMISSING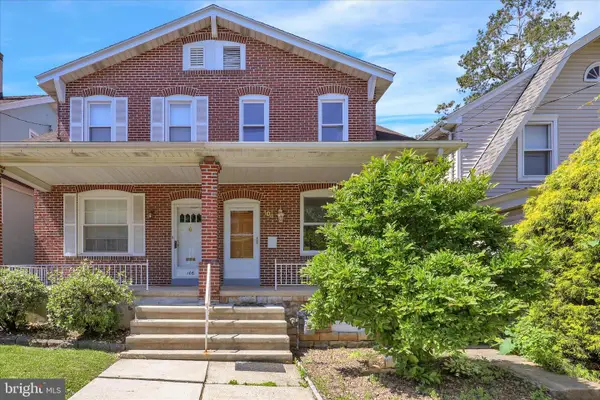 $239,900Pending3 beds 3 baths1,280 sq. ft.
104 Carroll St, READING, PA 19611
MLS# PABK2072554Listed by: IRON VALLEY REAL ESTATE OF BERKS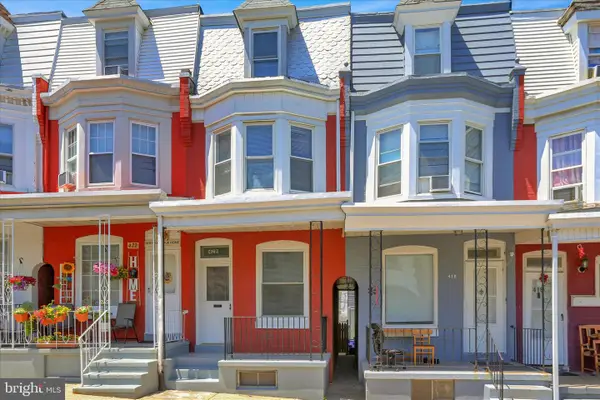 $199,900Active4 beds 2 baths1,448 sq. ft.
420 S 12th St, READING, PA 19602
MLS# PABK2072556Listed by: IRON VALLEY REAL ESTATE OF BERKS $159,900Pending4 beds 1 baths1,040 sq. ft.
1549 Cotton St, READING, PA 19606
MLS# PABK2072998Listed by: IRON VALLEY REAL ESTATE OF BERKS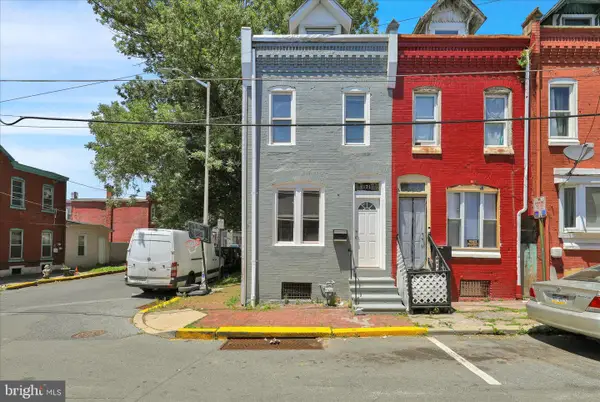 $189,900Pending4 beds 2 baths1,497 sq. ft.
121 W Elm St, READING, PA 19601
MLS# PABK2073000Listed by: IRON VALLEY REAL ESTATE OF BERKS $169,999Active3 beds 2 baths1,308 sq. ft.
645 Lancaster Ave, READING, PA 19611
MLS# PABK2072958Listed by: IRON VALLEY REAL ESTATE OF BERKS $259,900Active2 beds -- baths1,800 sq. ft.
2212 Perkiomen Ave, READING, PA 19606
MLS# PABK2072992Listed by: GODFREY PROPERTIES $115,000Active3 beds 2 baths815 sq. ft.
539 Strong Al, READING, PA 19602
MLS# PABK2072912Listed by: PAGODA REALTY ERA POWERED $165,000Pending4 beds 1 baths1,361 sq. ft.
1223 Elm St, READING, PA 19604
MLS# PABK2072866Listed by: UNITED REAL ESTATE STRIVE 212 $420,000Active-- beds -- baths2,968 sq. ft.
104 N 4th St, READING, PA 19601
MLS# PABK2072898Listed by: COLDWELL BANKER REALTY $185,000Active3 beds 1 baths1,367 sq. ft.
940 Pike St, READING, PA 19604
MLS# PABK2072884Listed by: MULLEN REALTY ASSOCIATES $215,000Pending4 beds 2 baths1,610 sq. ft.
1229 Church St, READING, PA 19601
MLS# PABK2072816Listed by: COLDWELL BANKER REALTY $245,000Pending4 beds 1 baths1,915 sq. ft.
132 Bern St, READING, PA 19601
MLS# PABK2072686Listed by: COMMONWEALTH REAL ESTATE LLC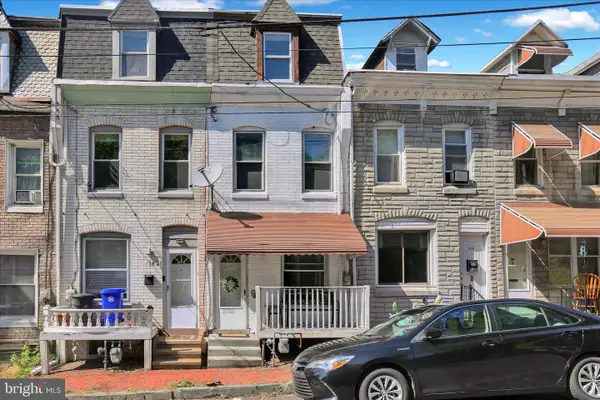 $155,000Pending4 beds 1 baths1,260 sq. ft.
1423 Fairview St, READING, PA 19602
MLS# PABK2072704Listed by: KELLER WILLIAMS PLATINUM REALTY - WYOMISSING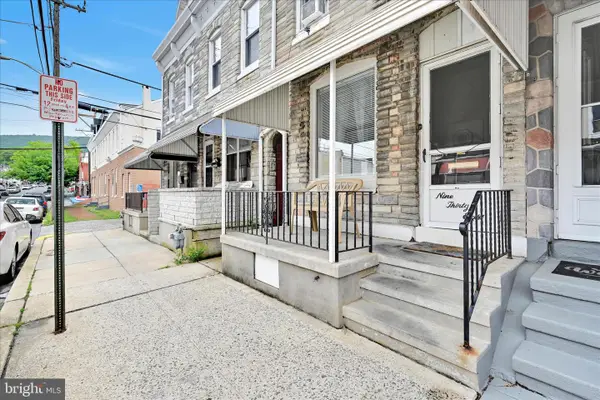 $185,000Active4 beds 1 baths1,487 sq. ft.
938 Pike, READING, PA 19604
MLS# PABK2072730Listed by: MULLEN REALTY ASSOCIATES $190,000Pending4 beds 1 baths1,449 sq. ft.
942 Pike St, READING, PA 19604
MLS# PABK2072732Listed by: MULLEN REALTY ASSOCIATES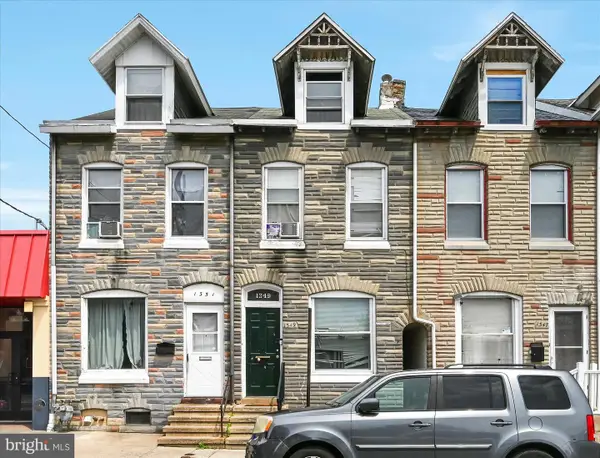 $185,000Active4 beds 1 baths1,118 sq. ft.
1349 Moss St, READING, PA 19604
MLS# PABK2072734Listed by: MULLEN REALTY ASSOCIATES $185,000Active4 beds 1 baths1,165 sq. ft.
936 N Pike St, READING, PA 19604
MLS# PABK2072728Listed by: MULLEN REALTY ASSOCIATES $155,000Active4 beds 1 baths1,146 sq. ft.
131 Pear St, READING, PA 19601
MLS# PABK2072568Listed by: COLDWELL BANKER REALTY $159,900Active4 beds -- baths2,184 sq. ft.
226 Orange St, READING, PA 19602
MLS# PABK2072664Listed by: REALTY ONE GROUP ALLIANCE $174,900Active3 beds 2 baths942 sq. ft.
1218 Fidelity St, READING, PA 19604
MLS# PABK2072622Listed by: COLDWELL BANKER REALTY $240,000Pending4 beds 2 baths1,486 sq. ft.
561 S 15th St, READING, PA 19602
MLS# PABK2072634Listed by: EXP REALTY, LLC $189,800Active3 beds 1 baths936 sq. ft.
1231 Oley St, READING, PA 19604
MLS# PABK2072618Listed by: COLDWELL BANKER REALTY $179,900Pending3 beds 1 baths1,292 sq. ft.
314 Madison Ave, READING, PA 19601
MLS# PABK2072584Listed by: LIGHT HOUSE REALTORS, LLC $184,900Active5 beds 1 baths1,596 sq. ft.
719 N 12th St, READING, PA 19604
MLS# PABK2072594Listed by: EXP REALTY, LLC $179,900Pending4 beds 1 baths1,416 sq. ft.
24 S 23rd St, READING, PA 19606
MLS# PABK2072564Listed by: DARYL TILLMAN REALTY GROUP $199,900Pending4 beds 2 baths1,837 sq. ft.
227 N Front St, READING, PA 19601
MLS# PABK2072536Listed by: IRON VALLEY REAL ESTATE OF BERKS $145,000Active4 beds 1 baths1,414 sq. ft.
629 Tulpehocken St, READING, PA 19601
MLS# PABK2072524Listed by: UNITED REAL ESTATE STRIVE 212 $221,000Pending3 beds 2 baths1,533 sq. ft.
729 Bruckman, READING, PA 19605
MLS# PABK2072520Listed by: REALTY ONE GROUP SUPREME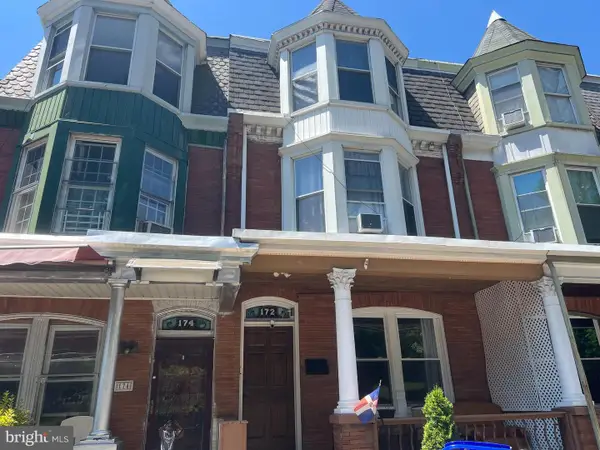 $239,000Pending6 beds 2 baths2,349 sq. ft.
172 Clymer St, READING, PA 19602
MLS# PABK2072370Listed by: RE/MAX OF READING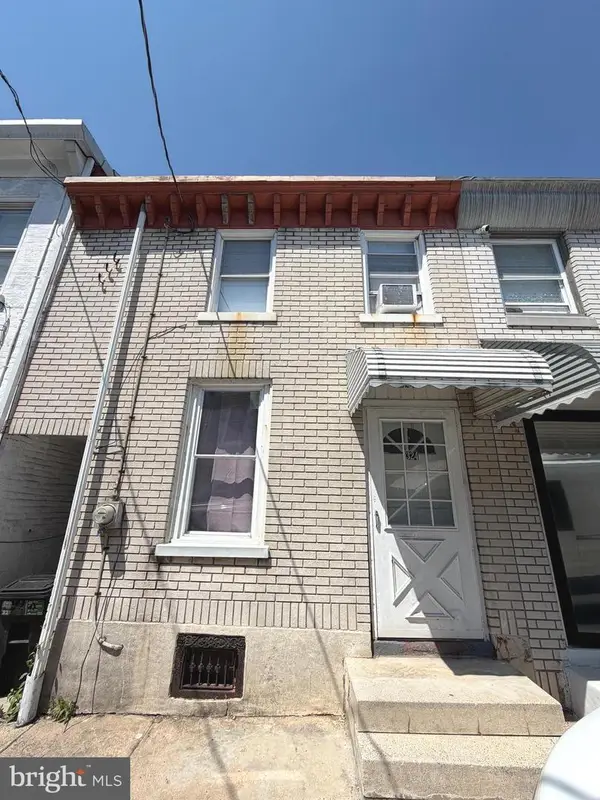 $144,900Active3 beds 1 baths1,192 sq. ft.
324 Spring Garden St, READING, PA 19602
MLS# PABK2072360Listed by: IRON VALLEY REAL ESTATE OF BERKS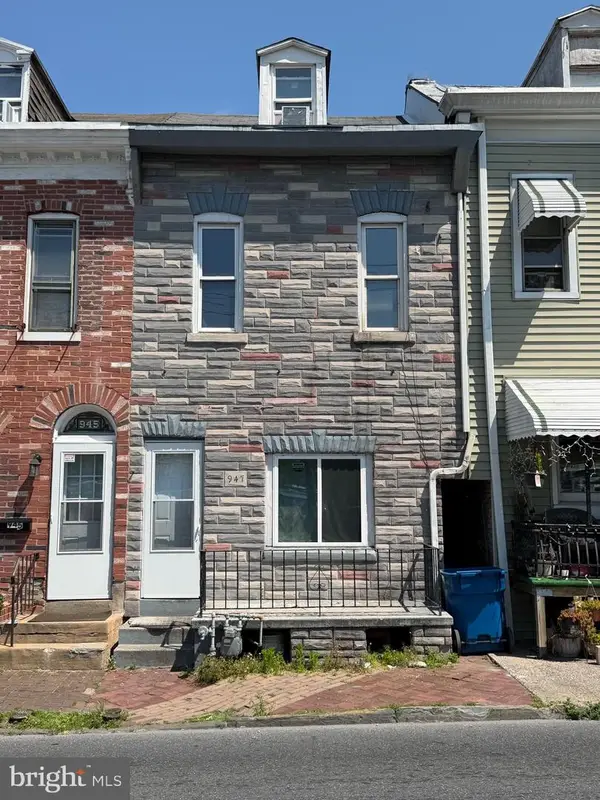 $149,900Active4 beds 2 baths1,154 sq. ft.
947 Cotton St, READING, PA 19602
MLS# PABK2072358Listed by: IRON VALLEY REAL ESTATE OF BERKS $284,900Pending4 beds 3 baths1,824 sq. ft.
1405 Meade St, READING, PA 19607
MLS# PABK2070308Listed by: KELLER WILLIAMS PLATINUM REALTY - WYOMISSING $229,900Pending5 beds 1 baths1,325 sq. ft.
1557 N 10th St, READING, PA 19604
MLS# PABK2072266Listed by: COLDWELL BANKER REALTY $129,900Pending3 beds 2 baths900 sq. ft.
1220 Muhlenberg St, READING, PA 19602
MLS# PABK2072238Listed by: JM DIAMOND REALTY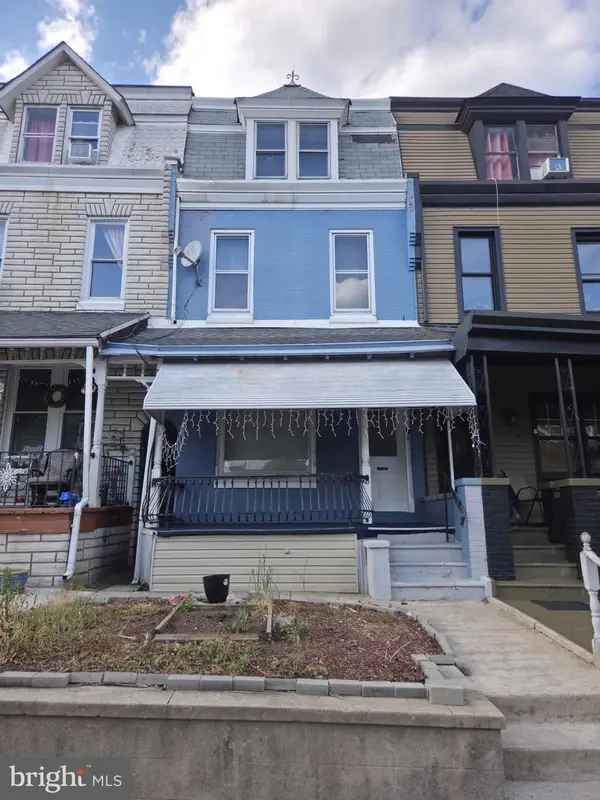 $250,000Pending5 beds 2 baths1,914 sq. ft.
161 W Oley St, READING, PA 19601
MLS# PABK2071890Listed by: UNITED REAL ESTATE STRIVE 212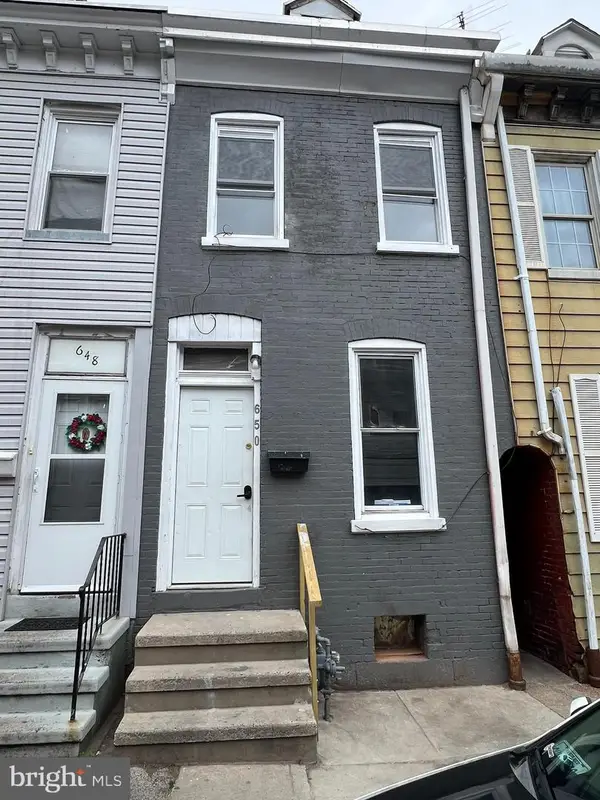 $183,999Active4 beds 2 baths1,250 sq. ft.
650 Mulberry St, READING, PA 19604
MLS# PABK2072140Listed by: UNITED REAL ESTATE STRIVE 212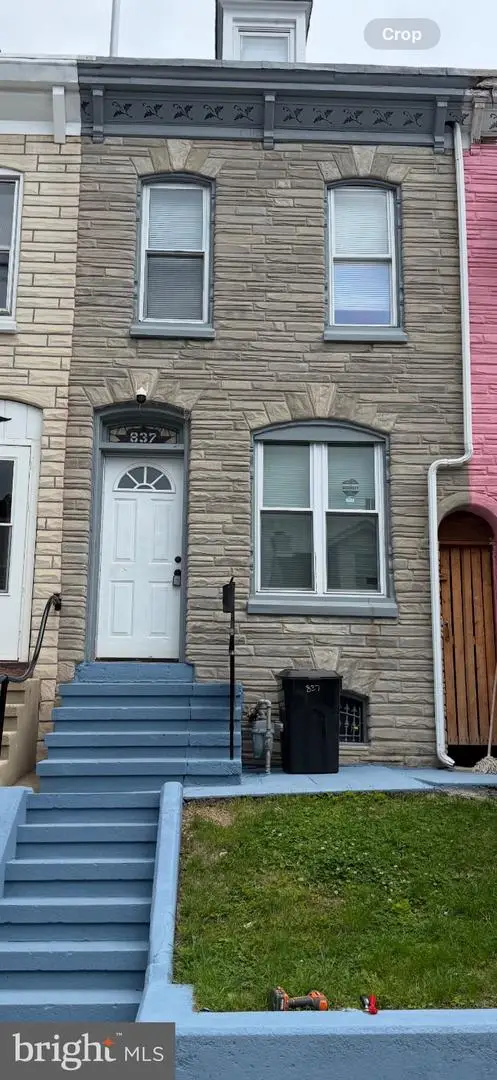 $145,000Active2 beds 1 baths750 sq. ft.
837 Locust St, READING, PA 19604
MLS# PABK2068912Listed by: IRON VALLEY REAL ESTATE OF BERKS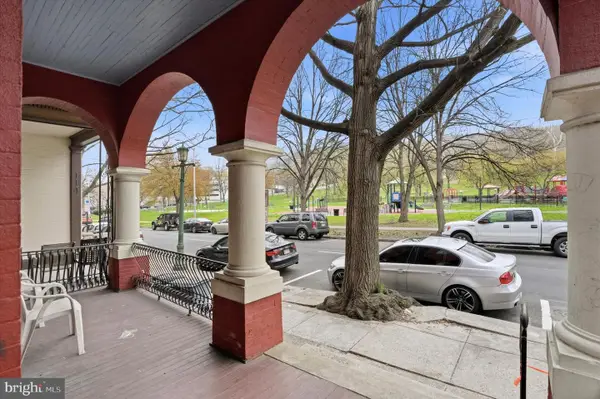 $630,000Active6 beds -- baths
112 N 11th St, READING, PA 19601
MLS# PABK2072018Listed by: SILVERSTONE REAL ESTATE LLC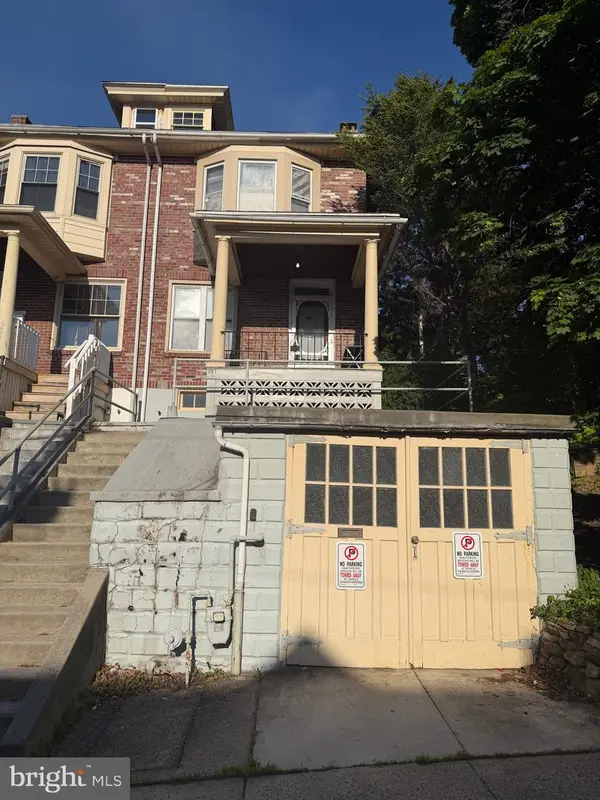 $265,000Pending2 beds -- baths1,520 sq. ft.
521 S 19th St, READING, PA 19606
MLS# PABK2072032Listed by: JM DIAMOND REALTY $269,900Pending3 beds 1 baths1,024 sq. ft.
1392 New Holland Rd, READING, PA 19607
MLS# PABK2072038Listed by: IRON VALLEY REAL ESTATE OF BERKS $187,500Active5 beds 3 baths1,892 sq. ft.
911 Walnut, READING, PA 19601
MLS# PABK2071980Listed by: EXP REALTY, LLC $111,500Pending3 beds 1 baths804 sq. ft.
314 Minor St, READING, PA 19602
MLS# PABK2071744Listed by: PAGODA REALTY ERA POWERED $259,900Active7 beds 3 baths2,368 sq. ft.
429 Greenwich St, READING, PA 19601
MLS# PABK2071886Listed by: EXP REALTY, LLC $254,500Pending3 beds 1 baths1,300 sq. ft.
1423 Fayette Ave, READING, PA 19607
MLS# PABK2071790Listed by: REALTY ONE GROUP ALLIANCE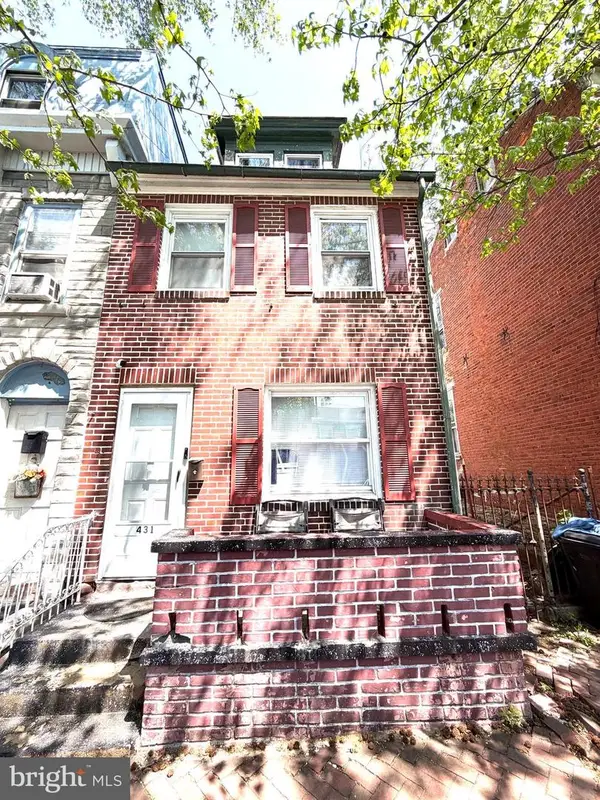 $164,900Active3 beds 2 baths1,266 sq. ft.
431 Pine St, READING, PA 19602
MLS# PABK2071642Listed by: IRON VALLEY REAL ESTATE OF BERKS $215,000Active3 beds 2 baths1,348 sq. ft.
612 Crescent Ave, READING, PA 19605
MLS# PABK2071700Listed by: COLDWELL BANKER REALTY $449,900Active9 beds -- baths4,197 sq. ft.
749 N 9th St, READING, PA 19604
MLS# PABK2071670Listed by: COLDWELL BANKER REALTY $345,000Active3 beds -- baths2,776 sq. ft.
736 And 738 Franklin St, READING, PA 19602
MLS# PABK2071644Listed by: COLDWELL BANKER REALTY $219,000Pending3 beds -- baths1,468 sq. ft.
726 Franklin St, READING, PA 19602
MLS# PABK2071648Listed by: COLDWELL BANKER REALTY $139,900Active3 beds 1 baths850 sq. ft.
1050 Culvert St, READING, PA 19602
MLS# PABK2071628Listed by: HOMEZU BY SIMPLE CHOICE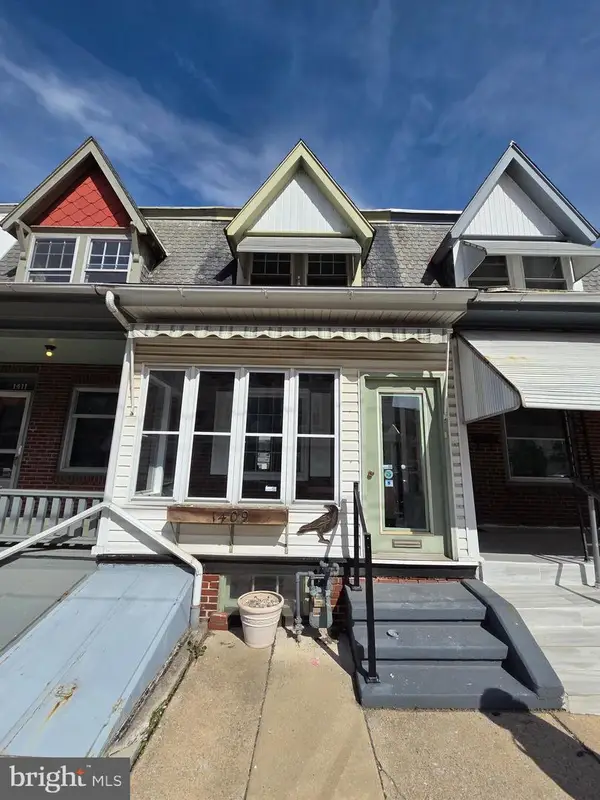 $224,900Active3 beds 1 baths1,036 sq. ft.
1409 Church St, READING, PA 19601
MLS# PABK2071912Listed by: REALTY ONE GROUP ALLIANCE $39,000Active2.5 Acres
2135-r Denglers Hill Ct, READING, PA 19601
MLS# PABK2071392Listed by: IRON VALLEY REAL ESTATE EXTON $269,900Pending3 beds 1 baths1,142 sq. ft.
2121 Peters Rd, READING, PA 19601
MLS# PABK2071578Listed by: RE/MAX OF READING $210,000Pending5 beds 2 baths1,762 sq. ft.
202 W Green St, READING, PA 19601
MLS# PABK2071406Listed by: UNITED REAL ESTATE STRIVE 212 $155,000Pending3 beds 2 baths1,261 sq. ft.
504 N 11th St, READING, PA 19604
MLS# PABK2071462Listed by: IRON VALLEY REAL ESTATE OF BERKS $175,000Pending5 beds 2 baths1,455 sq. ft.
529 Ritter St, READING, PA 19601
MLS# PABK2070480Listed by: JM DIAMOND REALTY $225,000Pending3 beds 2 baths1,830 sq. ft.
304 N 4th St, READING, PA 19601
MLS# PABK2071322Listed by: COLDWELL BANKER REALTY- $210,000Active4 beds 2 baths1,462 sq. ft.
816 Schuylkill Ave, READING, PA 19601
MLS# PABK2071346Listed by: IRON VALLEY REAL ESTATE OF BERKS  $319,900Active6 beds 4 baths2,148 sq. ft.
407 S 7th St, READING, PA 19602
MLS# PABK2071284Listed by: RE/MAX OF READING $309,900Pending3 beds 2 baths1,953 sq. ft.
230 Friedensburg Rd, READING, PA 19606
MLS# PABK2071218Listed by: IRON VALLEY REAL ESTATE OF BERKS $274,900Pending2 beds -- baths2,134 sq. ft.
316 S 8th St, READING, PA 19602
MLS# PABK2071194Listed by: LIGHT HOUSE REALTORS, LLC $29,900Active0.34 Acres
1707 Mineral Spring Rd, READING, PA 19602
MLS# PABK2070990Listed by: RE/MAX OF READING $230,000Pending4 beds -- baths2,228 sq. ft.
1637 Perkiomen Ave, READING, PA 19602
MLS# PABK2071184Listed by: EXP REALTY, LLC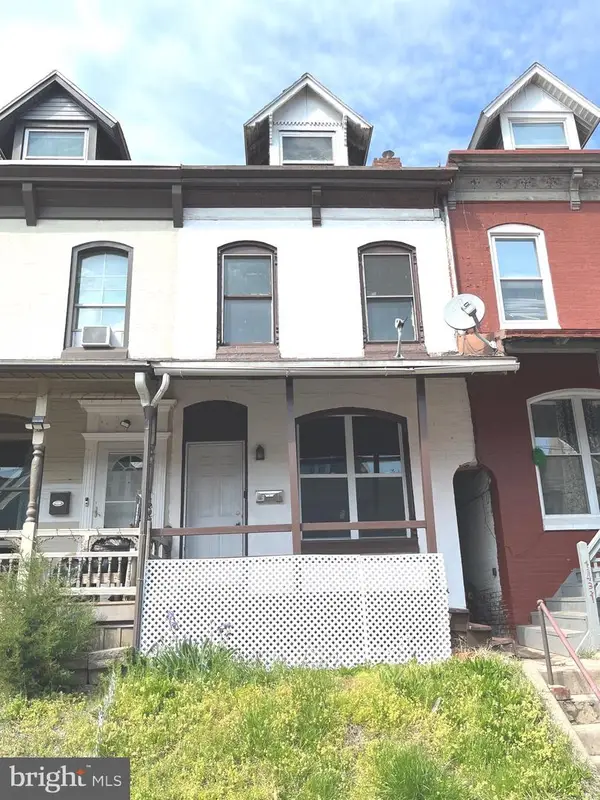 $150,000Pending4 beds 1 baths1,256 sq. ft.
1429 Muhlenberg St, READING, PA 19602
MLS# PABK2070700Listed by: COLDWELL BANKER REALTY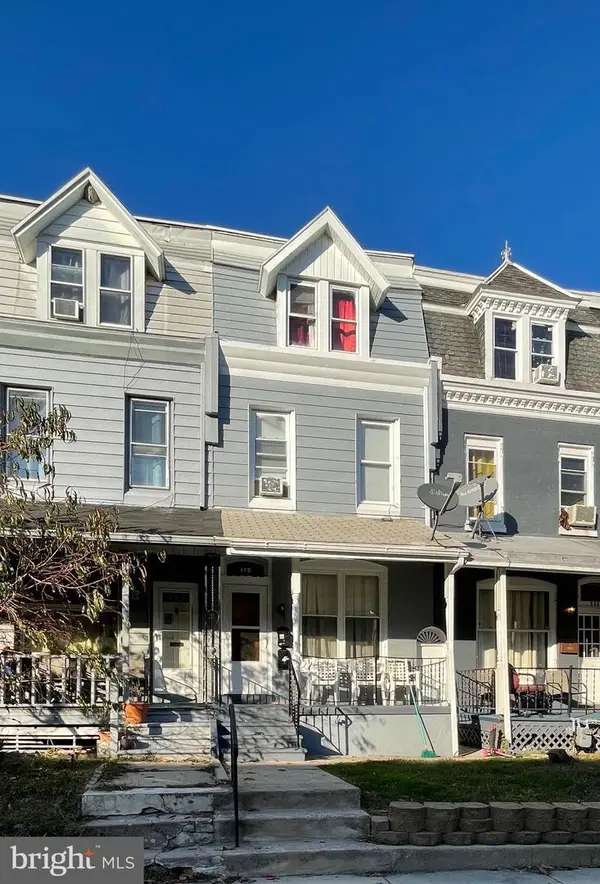 $240,000Pending4 beds -- baths1,663 sq. ft.
113 W Oley St, READING, PA 19601
MLS# PABK2071162Listed by: COLDWELL BANKER REALTY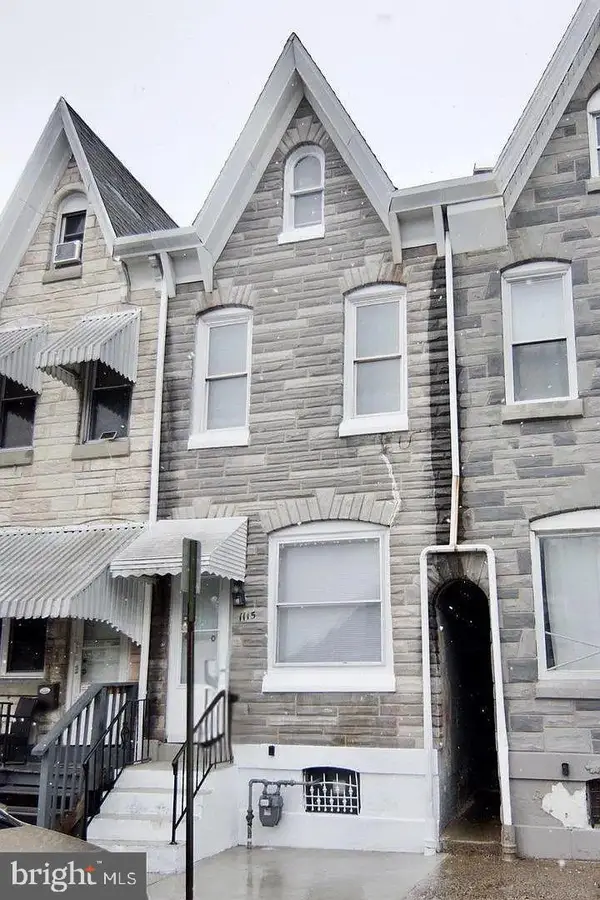 $185,000Active4 beds 2 baths1,010 sq. ft.
1115 Muhlenberg St, READING, PA 19602
MLS# PABK2068908Listed by: JM DIAMOND REALTY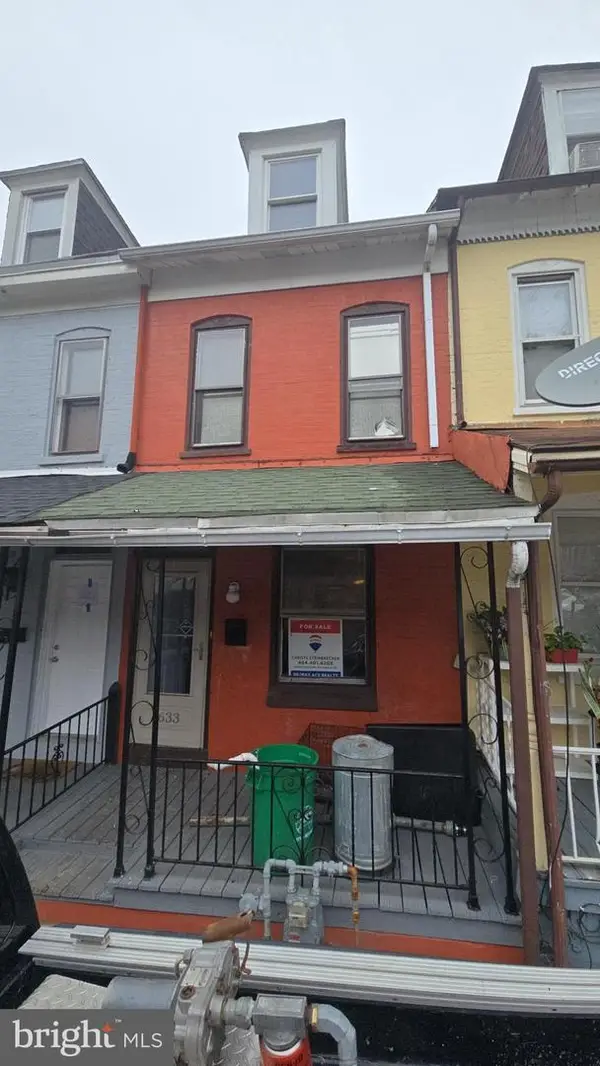 $115,900Active2 beds 1 baths943 sq. ft.
1633 Cotton St, READING, PA 19606
MLS# PABK2070950Listed by: RE/MAX ACE REALTY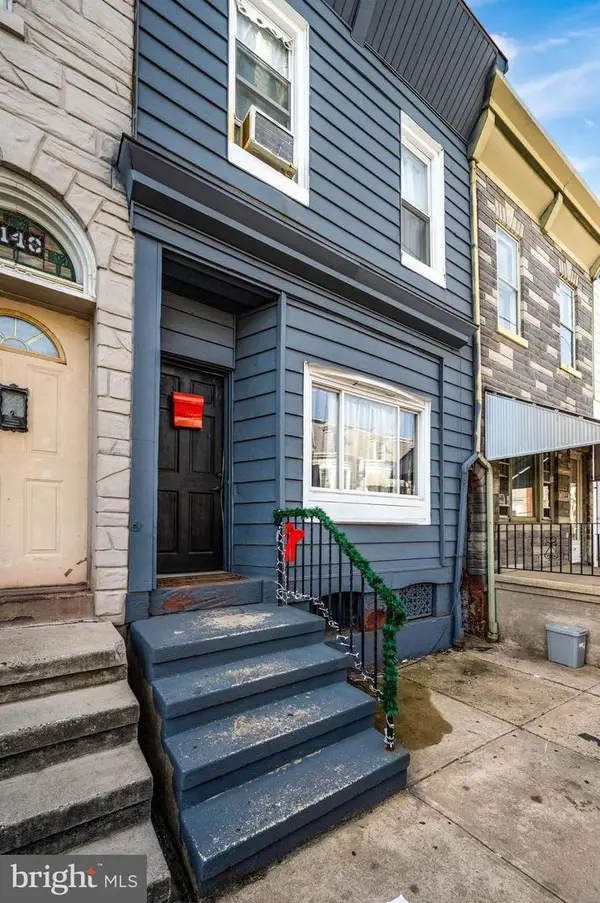 $179,000Active3 beds 1 baths1,260 sq. ft.
1146 Cotton St, READING, PA 19602
MLS# PABK2070790Listed by: IRON VALLEY REAL ESTATE OF BERKS $209,900Pending5 beds 2 baths1,677 sq. ft.
724 Weiser St, READING, PA 19601
MLS# PABK2070744Listed by: COLDWELL BANKER REALTY $124,000Active3 beds 1 baths774 sq. ft.
235 Hudson St, READING, PA 19601
MLS# PABK2070680Listed by: IRON VALLEY REAL ESTATE OF BERKS $207,000Pending4 beds 2 baths1,802 sq. ft.
209 Franklin St, READING, PA 19602
MLS# PABK2070172Listed by: RE/MAX OF READING $295,000Pending3 beds -- baths3,200 sq. ft.
334 Mcknight St, READING, PA 19601
MLS# PABK2070714Listed by: RE/MAX OF READING $249,900Pending4 beds 2 baths1,408 sq. ft.
1020 Meade St, READING, PA 19611
MLS# PABK2070656Listed by: IRON VALLEY REAL ESTATE OF BERKS $162,000Active6 beds 1 baths2,340 sq. ft.
735 N 9th St, READING, PA 19604
MLS# PABK2070606Listed by: JM DIAMOND REALTY $230,000Pending3 beds 1 baths1,120 sq. ft.
1152 Gregg Ave, READING, PA 19607
MLS# PABK2070560Listed by: KELLER WILLIAMS PLATINUM REALTY - WYOMISSING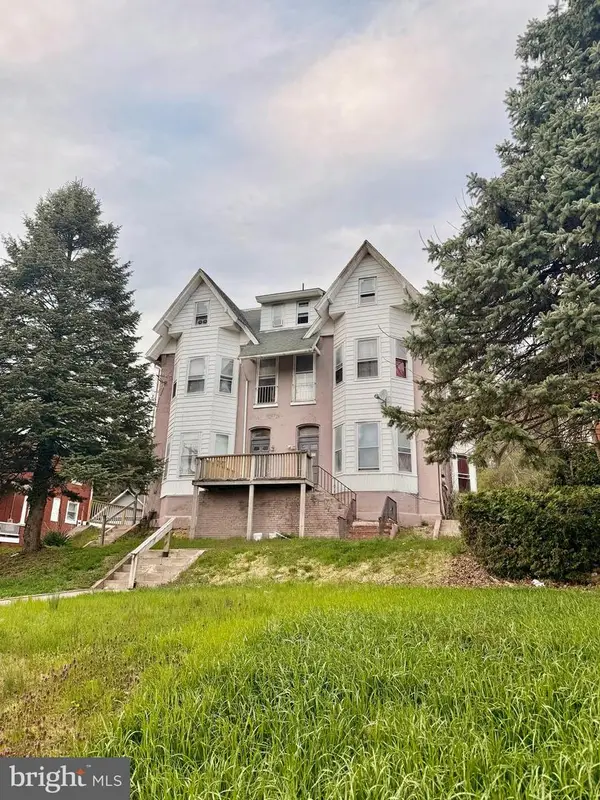 $575,000Active12 beds -- baths6,775 sq. ft.
1601 Mineral Spring Rd, READING, PA 19602
MLS# PABK2070500Listed by: IRON VALLEY REAL ESTATE OF BERKS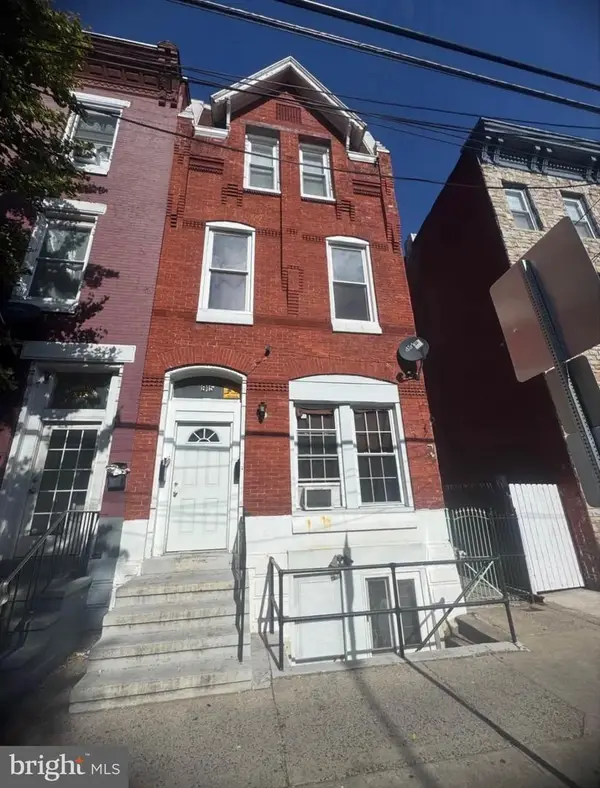 $349,900Pending6 beds -- baths2,550 sq. ft.
815 Chestnut St, READING, PA 19602
MLS# PABK2070432Listed by: IRON VALLEY REAL ESTATE OF BERKS $209,900Active4 beds 2 baths1,476 sq. ft.
100 Neversink St, READING, PA 19602
MLS# PABK2070418Listed by: REALTY ONE GROUP ALLIANCE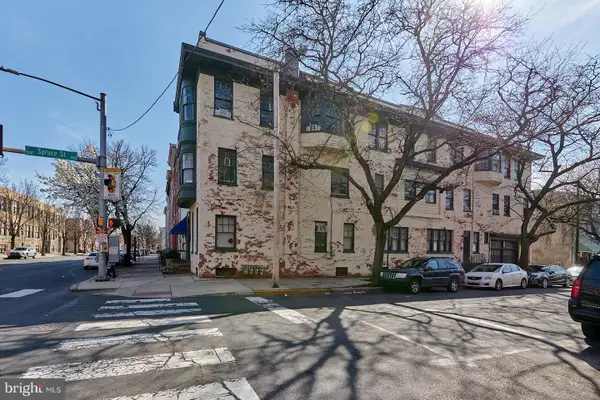 $450,000Pending7 beds -- baths
300 S 5th St, READING, PA 19602
MLS# PABK2070372Listed by: UNITED REAL ESTATE STRIVE 212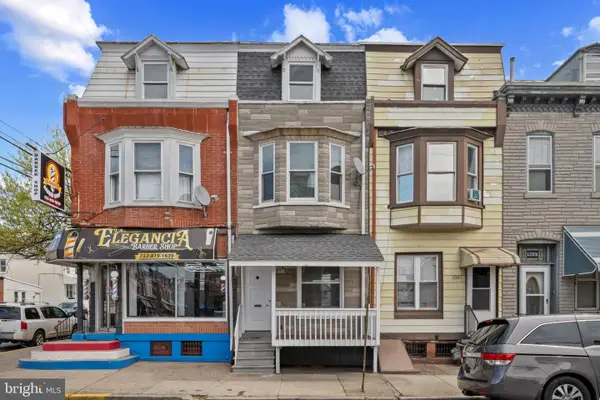 $210,000Pending5 beds 1 baths1,550 sq. ft.
1359 N 10th St, READING, PA 19604
MLS# PABK2070348Listed by: REALTY ONE GROUP ALLIANCE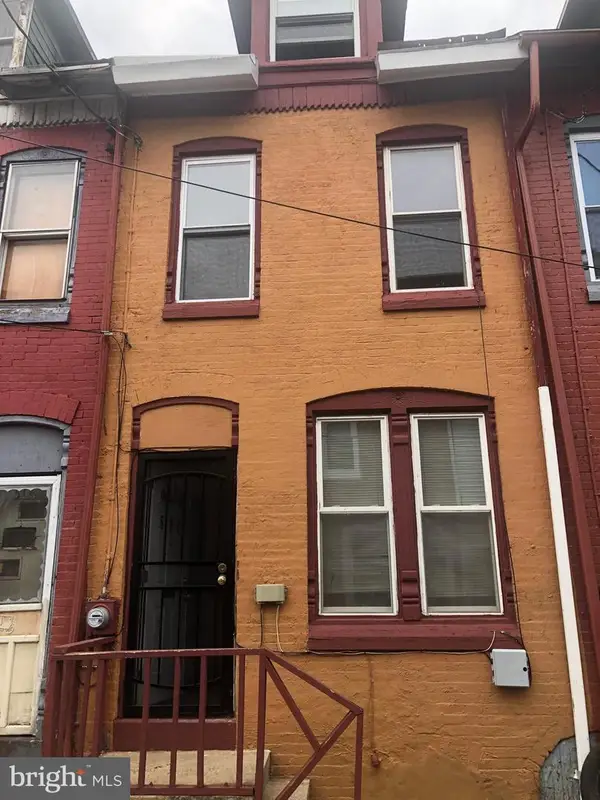 $98,900Active3 beds 1 baths768 sq. ft.
518 Johnson St, READING, PA 19601
MLS# PABK2070362Listed by: BOLD REALTY $269,900Active4 beds 3 baths1,210 sq. ft.
1815 Holly Rd, READING, PA 19602
MLS# PABK2070280Listed by: RE/MAX OF READING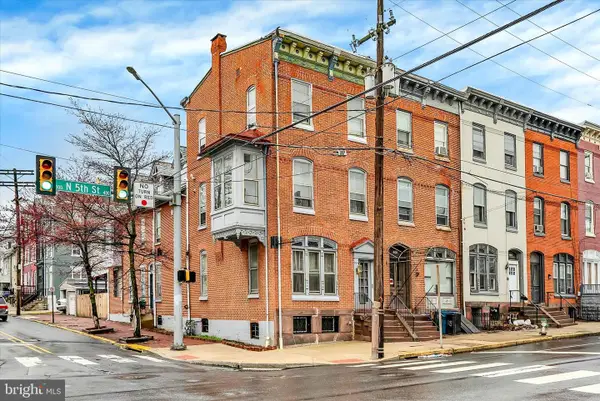 $385,000Pending6 beds -- baths3,385 sq. ft.
400 N 5th St, READING, PA 19601
MLS# PABK2070126Listed by: PAGODA REALTY ERA POWERED $279,900Active6 beds 3 baths3,098 sq. ft.
845 N 8th St, READING, PA 19604
MLS# PABK2069416Listed by: SPRINGER REALTY GROUP $44,900Active0.14 Acres
1428 Liggett Ave, READING, PA 19607
MLS# PABK2069682Listed by: IRON VALLEY REAL ESTATE OF BERKS $259,500Active4 beds -- baths1,716 sq. ft.
343 Chestnut St, READING, PA 19602
MLS# PABK2069606Listed by: SPM REAL ESTATE GROUP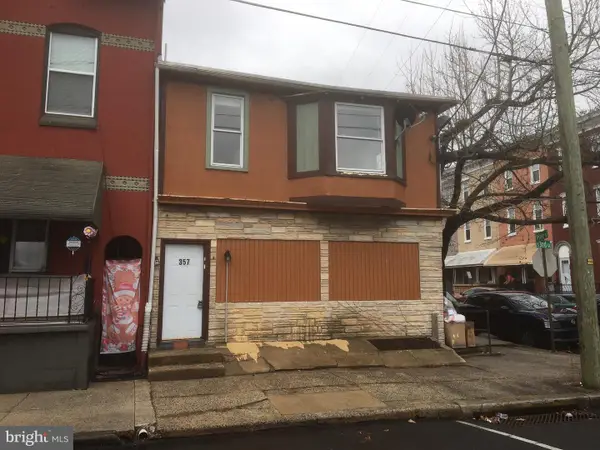 $460,000Active8 beds -- baths2,946 sq. ft.
357 S 3rd St, READING, PA 19602
MLS# PABK2069610Listed by: CENTURY 21 GOLD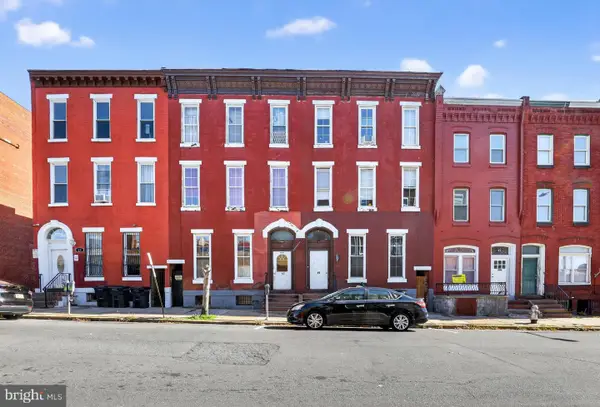 $950,000Active13 beds -- baths5,288 sq. ft.
17-19 S 3rd St, READING, PA 19602
MLS# PABK2069500Listed by: TCS MANAGEMENT, LLC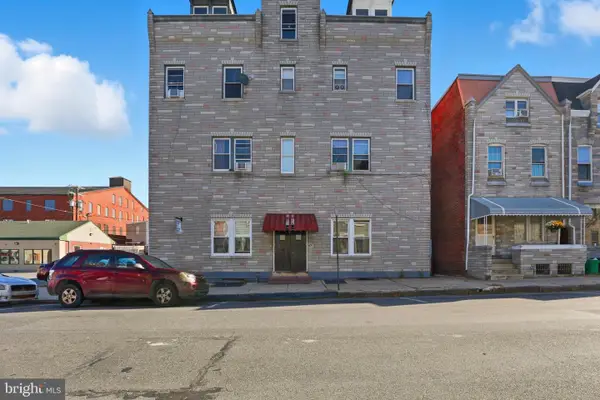 $1,325,000Active21 beds -- baths19,254 sq. ft.
831 N 10th St, READING, PA 19604
MLS# PABK2069502Listed by: TCS MANAGEMENT, LLC $950,000Active11 beds -- baths3,485 sq. ft.
1259 N 10th St, READING, PA 19604
MLS# PABK2069506Listed by: TCS MANAGEMENT, LLC $1,463,900Pending29.43 Acres
0 Philadelphia Ave, READING, PA 19607
MLS# PABK2069382Listed by: NEXTHOME LEGACY REAL ESTATE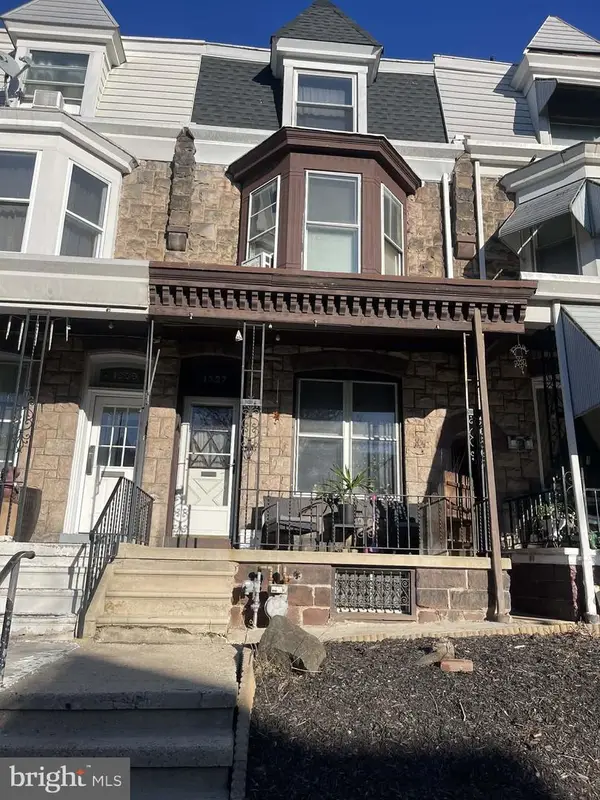 $210,000Pending5 beds 1 baths1,850 sq. ft.
1337 N 11th St, READING, PA 19604
MLS# PABK2069192Listed by: JM DIAMOND REALTY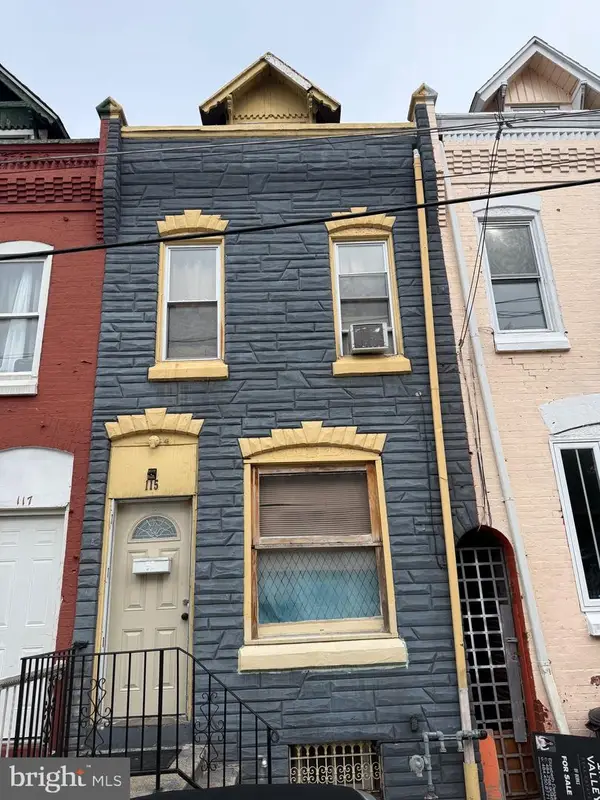 $160,000Active4 beds 1 baths1,163 sq. ft.
115 W Elm St, READING, PA 19601
MLS# PABK2068498Listed by: IRON VALLEY REAL ESTATE OF BERKS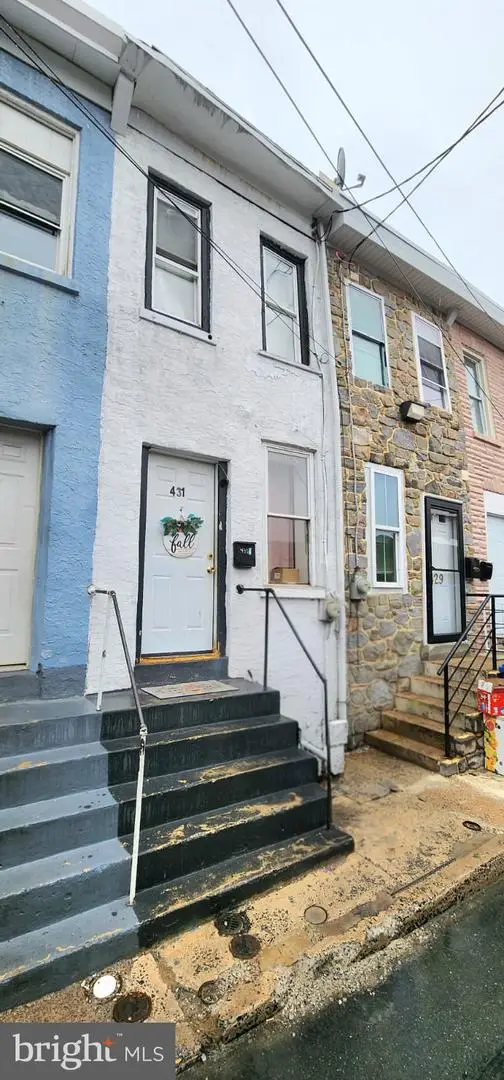 $114,900Pending3 beds 1 baths770 sq. ft.
431 Cedar St, READING, PA 19601
MLS# PABK2069036Listed by: IRON VALLEY REAL ESTATE OF BERKS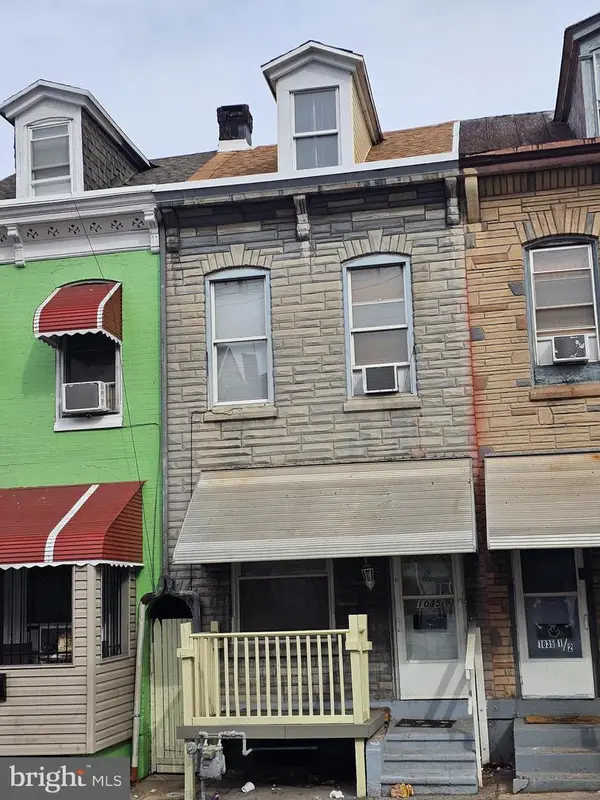 $145,000Active3 beds 1 baths1,034 sq. ft.
1035 Cotton St, READING, PA 19602
MLS# PABK2068854Listed by: NEXTHOME ALLIANCE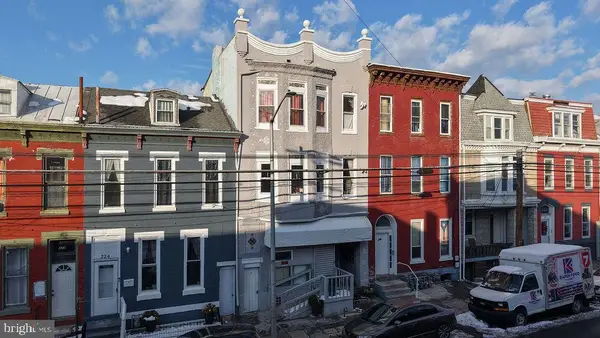 $650,000Active8 beds -- baths
226 N 10th St, READING, PA 19601
MLS# PABK2068850Listed by: IRON VALLEY REAL ESTATE OF BERKS $75,000Pending2 beds 1 baths1,358 sq. ft.
1026 Hampden Blvd, READING, PA 19604
MLS# PABK2068620Listed by: CENTURY 21 EMERALD $180,000Active4 beds 2 baths1,536 sq. ft.
1047 Cotton St Se, READING, PA 19602
MLS# PABK2068558Listed by: COLDWELL BANKER REALTY $175,000Active5 beds -- baths2,158 sq. ft.
418 Schuylkill Ave, READING, PA 19601
MLS# PABK2068306Listed by: BOLD REALTY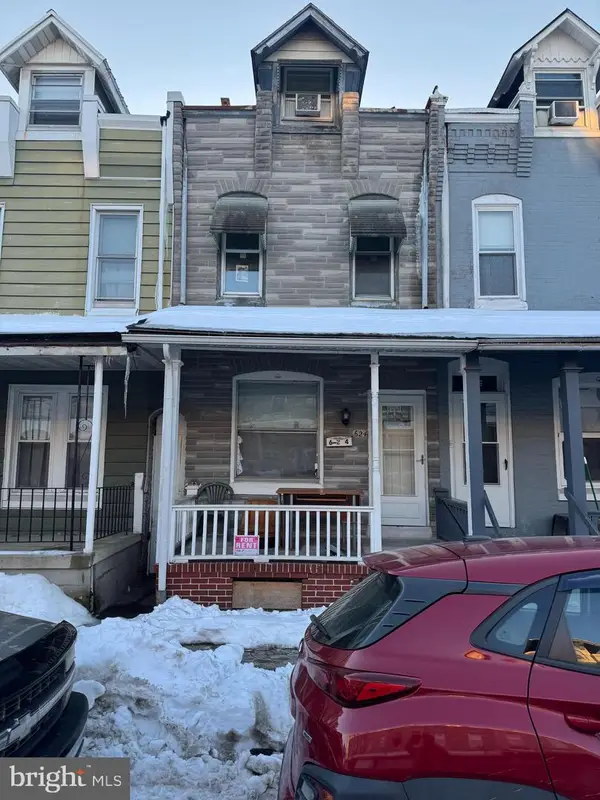 $190,000Active6 beds 3 baths1,152 sq. ft.
624 Gordon St, READING, PA 19601
MLS# PABK2068068Listed by: JM DIAMOND REALTY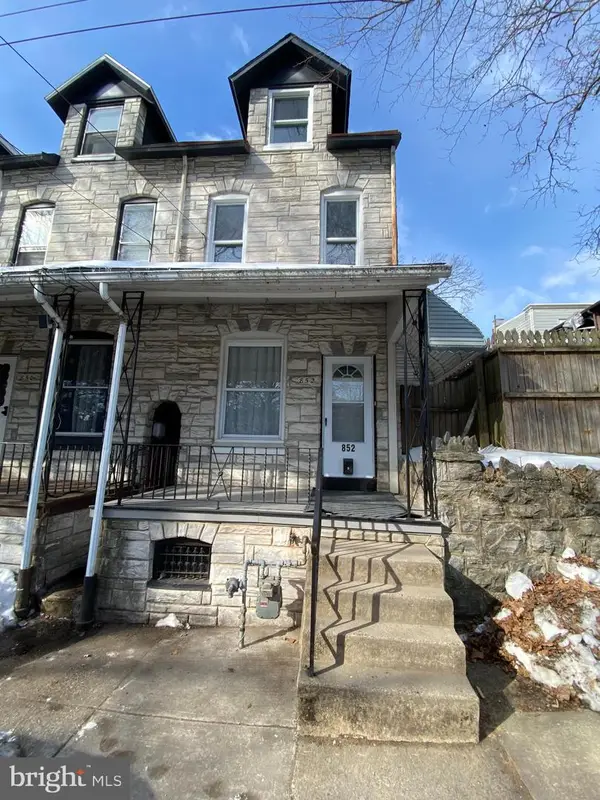 $189,900Pending3 beds 2 baths1,100 sq. ft.
852 Thorn St, READING, PA 19601
MLS# PABK2068082Listed by: REALTY AFFILIATES- $190,000Active7 beds 3 baths948 sq. ft.
427 Wunder St, READING, PA 19602
MLS# PABK2067930Listed by: JM DIAMOND REALTY  $499,900Pending8 beds -- baths4,791 sq. ft.
220 N 6th St, READING, PA 19601
MLS# PABK2067992Listed by: COLDWELL BANKER REALTY $109,900Active2 beds 1 baths1,281 sq. ft.
123 S 10th St, READING, PA 19602
MLS# PABK2067514Listed by: EXETER REALTY $169,900Pending3 beds 2 baths1,306 sq. ft.
1109 Douglass St, READING, PA 19604
MLS# PABK2067554Listed by: COLDWELL BANKER REALTY $179,900Active4 beds 1 baths1,109 sq. ft.
341 S 9th St, READING, PA 19602
MLS# PABK2067532Listed by: CENTURY 21 GOLD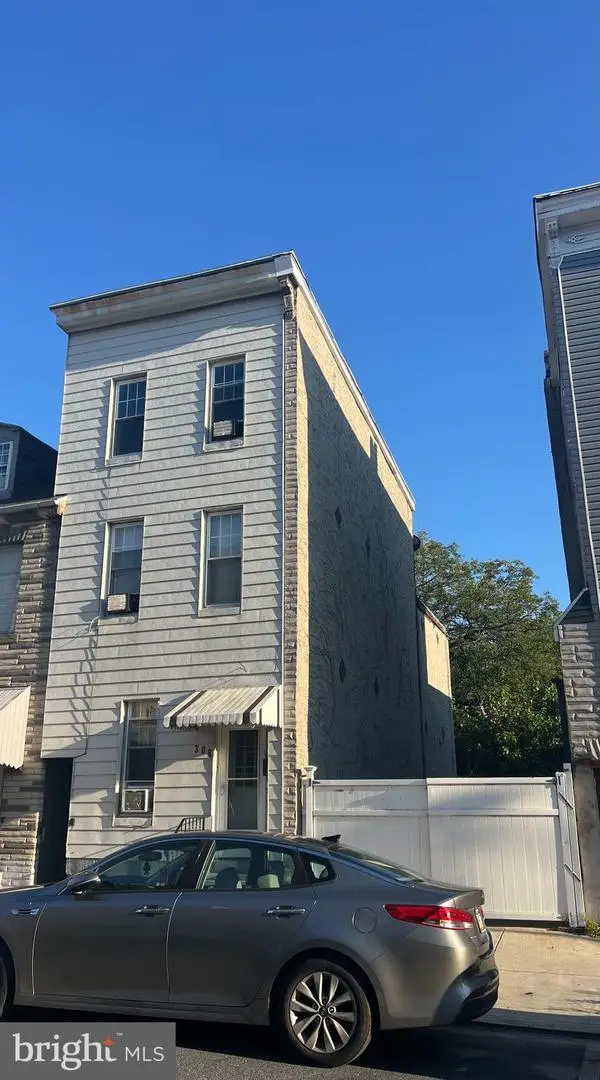 $230,000Active4 beds 1 baths1,529 sq. ft.
308 & 306 Franklin St, READING, PA 19602
MLS# PABK2067538Listed by: CENTURY 21 GOLD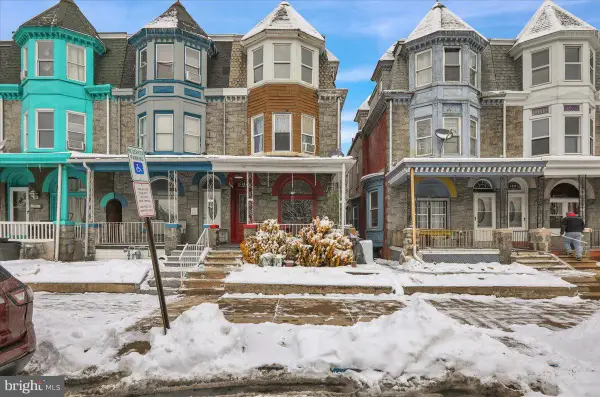 $249,900Pending5 beds -- baths2,408 sq. ft.
163 W Greenwich St, READING, PA 19601
MLS# PABK2067410Listed by: KELLER WILLIAMS PLATINUM REALTY - WYOMISSING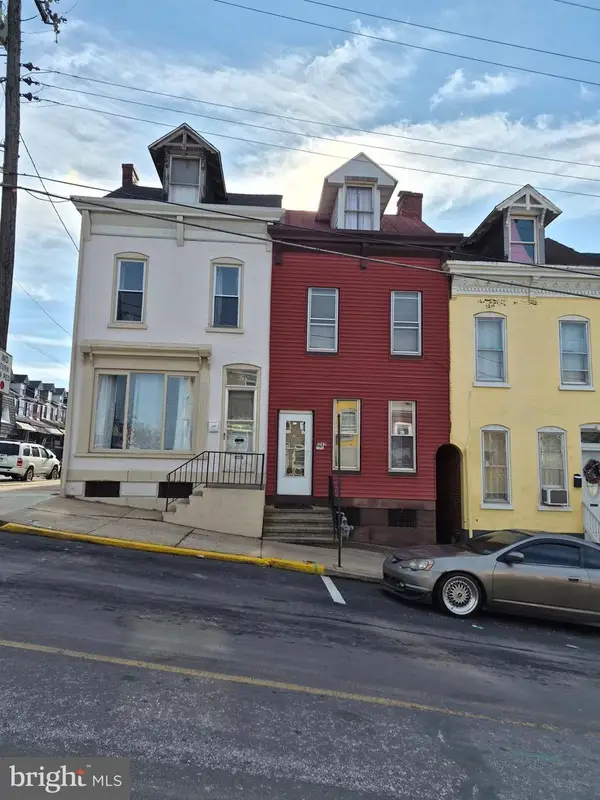 $132,000Pending3 beds 2 baths1,370 sq. ft.
1262 Buttonwood St, READING, PA 19604
MLS# PABK2067090Listed by: COLDWELL BANKER REALTY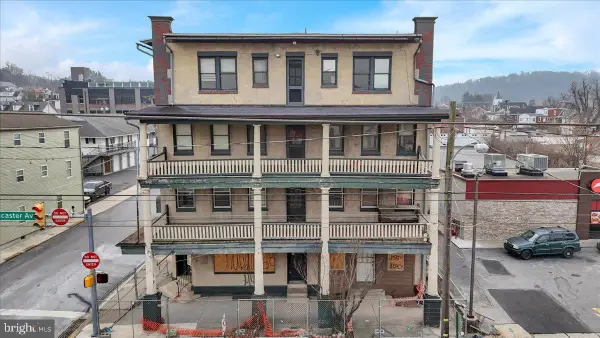 $1,250,000Active15 beds -- baths15,000 sq. ft.
200 W Lancaster Ave, READING, PA 19607
MLS# PABK2067046Listed by: DESTINATION REALTY LLC $169,900Pending3 beds 1 baths1,153 sq. ft.
726 Locust St, READING, PA 19604
MLS# PABK2066728Listed by: KELLER WILLIAMS PLATINUM REALTY - WYOMISSING $130,000Active2 beds 1 baths1,248 sq. ft.
1347 Mulberry St, READING, PA 19604
MLS# PABK2065926Listed by: CENTURY 21 GOLD $100,000Pending3 beds 1 baths1,088 sq. ft.
1043 Walnut St, READING, PA 19601
MLS# PABK2065636Listed by: RE/MAX OF READING $179,900Pending5 beds 1 baths2,310 sq. ft.
1238 Eckert Ave, READING, PA 19602
MLS# PABK2064602Listed by: RE/MAX ACE REALTY $117,000Pending1 beds 4 baths1,306 sq. ft.
1359 Green St, READING, PA 19604
MLS# PABK2063784Listed by: COLDWELL BANKER REALTY $235,000Pending3 beds 2 baths1,658 sq. ft.
2260 Northmont Blvd, READING, PA 19605
MLS# PABK2061970Listed by: RE/MAX OF READING $339,800Pending5 beds 2 baths1,819 sq. ft.
117 S Park Rd, READING, PA 19610
MLS# PABK2062920Listed by: CENTURY 21 EMERALD $210,000Active3 beds 2 baths1,294 sq. ft.
144 S 12th St, READING, PA 19602
MLS# PABK2061914Listed by: RE/MAX OF READING $1,485,000Active21 beds -- baths15,578 sq. ft.
0 Perkiomen Ave, READING, PA 19602
MLS# PABK2061892Listed by: PAGODA REALTY ERA POWERED $495,000Active5 beds -- baths4,029 sq. ft.
835 Washington St, READING, PA 19601
MLS# PABK2061776Listed by: PAGODA REALTY ERA POWERED $149,900Pending3 beds 1 baths1,066 sq. ft.
1642 Muhlenberg St, READING, PA 19606
MLS# PABK2059418Listed by: COLDWELL BANKER REALTY $349,900Active7 beds 3 baths4,570 sq. ft.
226 S 5th St, READING, PA 19602
MLS# PABK2057400Listed by: CENTURY 21 GOLD $260,000Pending5 beds 5 baths2,178 sq. ft.
221 S 5th St, READING, PA 19602
MLS# PABK2056614Listed by: COLDWELL BANKER REALTY $239,900Pending3 beds 2 baths1,144 sq. ft.
1424 Commonwealth Blvd, READING, PA 19607
MLS# PABK2049200Listed by: RE/MAX OF READING $12,500Pending0.05 Acres
323 Pine St, READING, PA 19602
MLS# PABK2039786Listed by: KELLER WILLIAMS PLATINUM REALTY - WYOMISSING $795,000Active4 beds 4 baths3,721 sq. ft.
1804 Bernville Rd, READING, PA 19601
MLS# PABK2055608Listed by: RE/MAX OF READING $766,893Active4 beds 3 baths3,646 sq. ft.
333 Cameron Ln #hawthorne, LITITZ, PA 17543
MLS# PALA2027376Listed by: PATRIOT REALTY, LLC $11,000Active0.03 Acres
634 S 16 1/2 St, READING, PA 19606
MLS# PABK2040994Listed by: COLDWELL BANKER REALTY
Local realty services provided by:CENTURY 21 Rauh & Johns, CENTURY 21 Gold
Neighborhoods near Reading, PA
Zip codes near Reading, PA
- 19508 homes for sale
- 19510 homes for sale
- 19518 homes for sale
- 19522 homes for sale
- 19533 homes for sale
- 19540 homes for sale
- 19547 homes for sale
- 19555 homes for sale
- 19560 homes for sale
- 19565 homes for sale
- 19601 homes for sale
- 19602 homes for sale
- 19604 homes for sale
- 19605 homes for sale
- 19606 homes for sale
- 19607 homes for sale
- 19608 homes for sale
- 19609 homes for sale
- 19610 homes for sale
- 19611 homes for sale
Popular searches near Reading, PA
- Colony Park homes for sale
- Cumru homes for sale
- Flying Hills homes for sale
- Greenfields homes for sale
- Hyde Park homes for sale
- Jacksonwald homes for sale
- Kenhorst homes for sale
- Laureldale homes for sale
- Lincoln Park homes for sale
- Lower Alsace homes for sale
- Mt Penn homes for sale
- Muhlenberg Park homes for sale
- Pennside homes for sale
- Reiffton homes for sale
- St Lawrence homes for sale
- Shillington homes for sale
- Spring Ridge homes for sale
- Stony Creek Mills homes for sale
- West Reading homes for sale
- Wyomissing homes for sale
Protect your home and budget from life's surprises with an Assurant Home Warranty, backed by a partner that supports you through every step of homeownership. Explore Plans.
©2026 Century 21 Real Estate LLC. All rights reserved. CENTURY 21®, the CENTURY 21 Logo and C21® are service marks owned by Century 21 Real Estate LLC. Century 21 Real Estate LLC fully supports the principles of the Fair Housing Act and the Equal Opportunity Act. Each office is independently owned and operated. Listing information is deemed reliable but not guaranteed accurate.